This template is a modified version of the original work done by pbergdolt and posted on the zabbix forum a while ago here: https://www.zabbix.com/forum/zabbix-cookbook/35336-zabbix-zfs-discovery-monitoring?t=43347 . Also the original home of this variant was on https://share.zabbix.com/zfs-on-linux .
I have maintained and modified this template over the years and the different versions of ZoL on a large number of servers so I'm pretty confident that it works ;)
Tested Zabbix server version include 3.0, 3.4 and 4.0. The template shipped here is in 3.0 format to allow import to all those versions.
This template will give you graph on basically everything, which includes triggers for low disk space and other alarms. Disk space alarms can be customized using Zabbix macros.
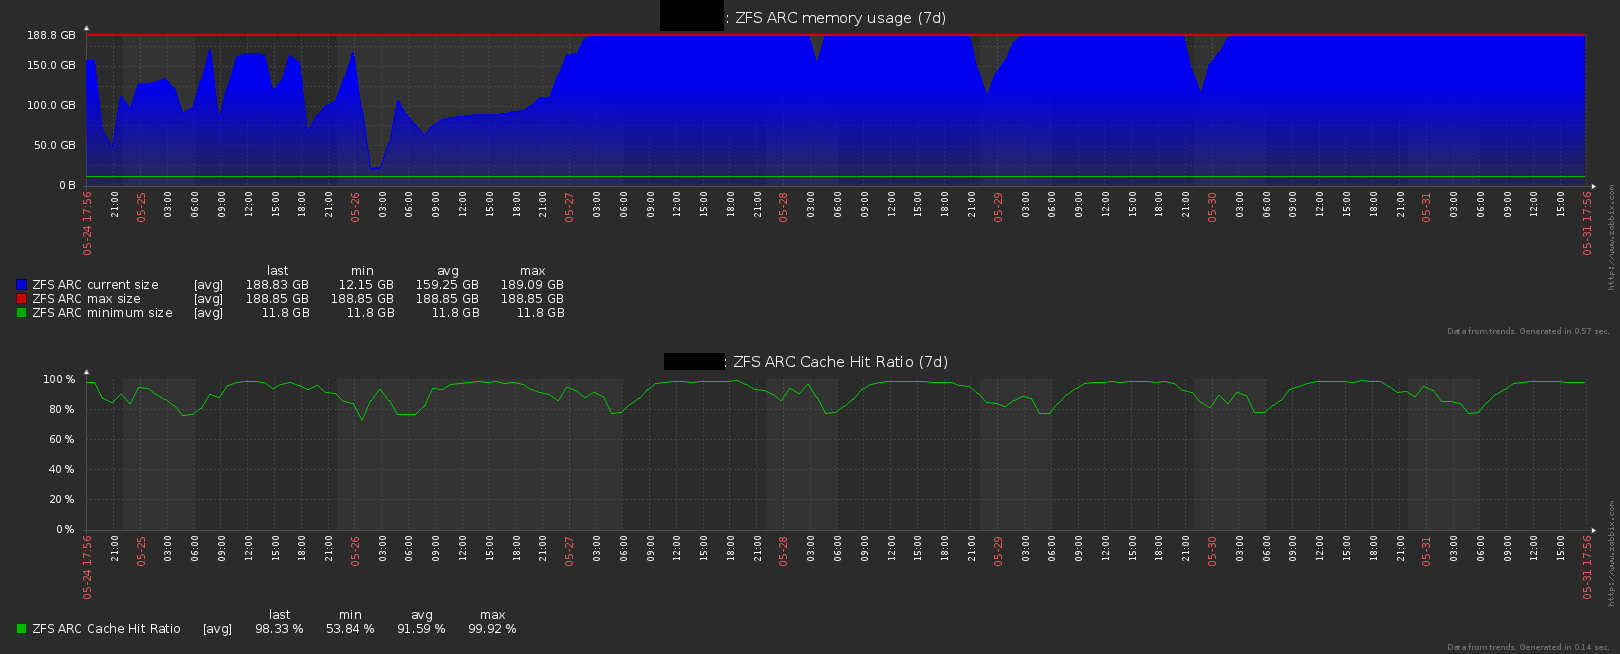
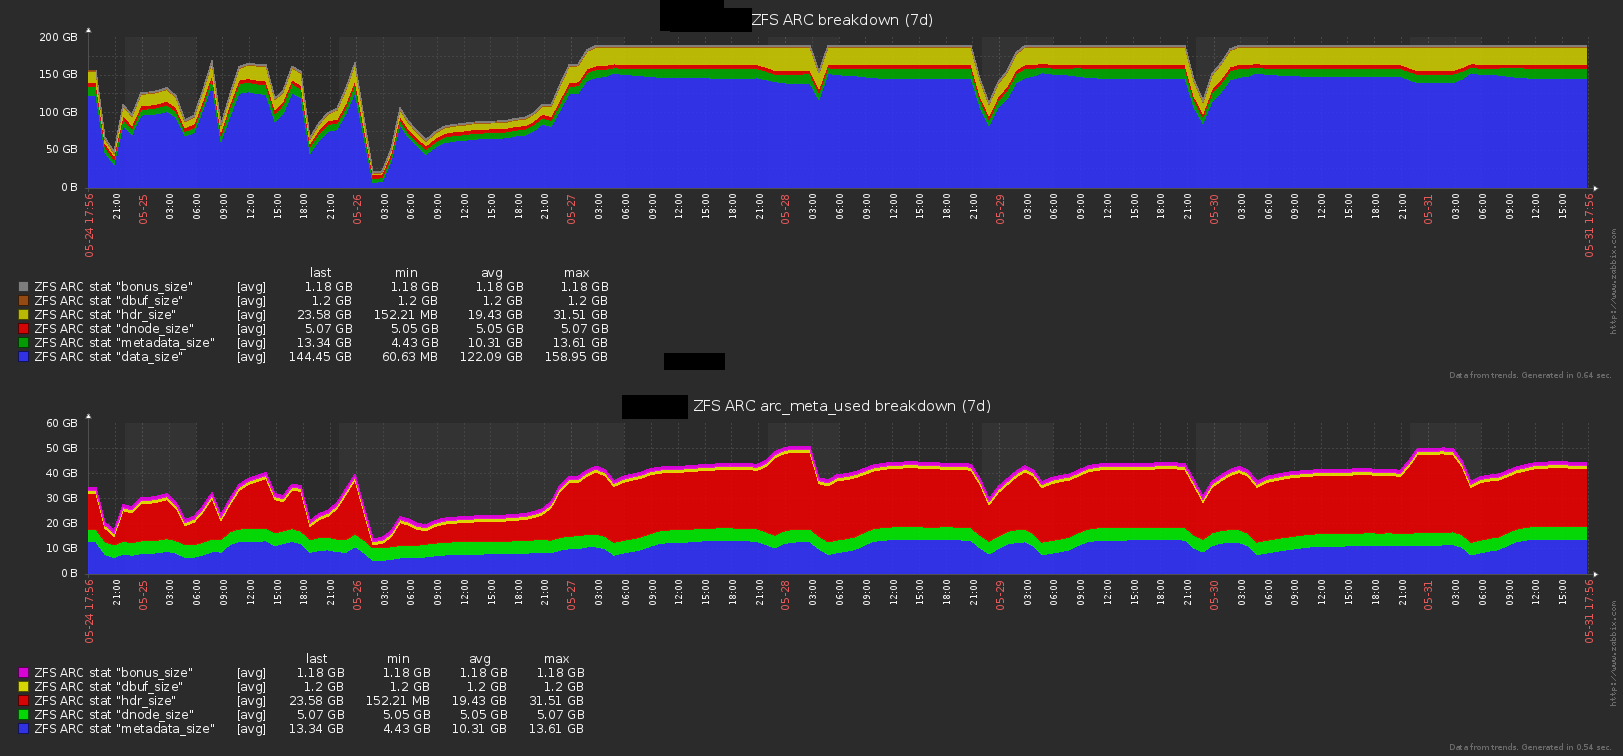
Example of graph:
- Arc memory usage and hit rate:

- Complete breakdown of META and DATA usage:

- Dataset usage, with available space, and breakdown of used space with directly used space, space used by snapshots and space used by children:

Any Linux variant should work, tested version by myself include:
- Debian 8, 9, 10
- Ubuntu 16.04 and 18.04
- CentOS 6 and 7
About the ZoL version, this template is intended to be used by ZoL version 0.7.0 or superior but still works on the 0.6.x branch.
To use this template, follow those steps:
On your zabbix server web UI, go to:
- Administration
- General
- Regular expressions
Then Create 2 new regular expressions:
- "ZFS fileset"
Expression type: Character string included
Expression: /
- "not docker ZFS dataset"
Expression type: Result is FALSE
Expression: ([a-z-0-9]{64}$|[a-z-0-9]{64}-init$)
The second expression is to avoid this template to discover docker ZFS datasets because there can be a lot of them and they are not that useful to monitor as long as you monitor the parent dataset. This is especially true on host that create and destroy a lot of docker containers all day, creating dataset that disapear shortly after creation.
Go to:
- Administration
- General
- Value mapping
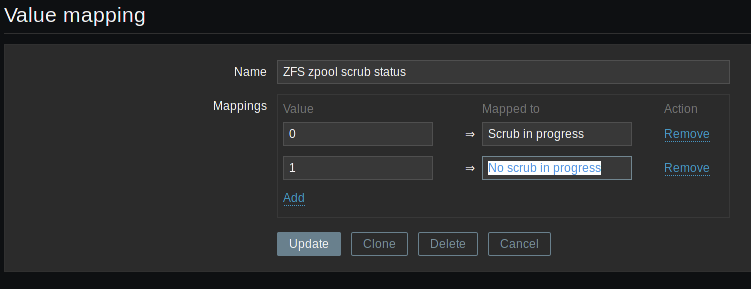
Then create a new value map named ZFS zpool scrub status with the following mappings:
| Value | Mapped to |
|---|---|
| 0 | Scrub in progress |
| 1 | No scrub in progress |
Import the template that is in the "template" directory of this repository or download it directly with this link:
The server needs to have some very basic tools to run the user parameters:
- awk
- cat
- grep
- sed
- tail
Usually, they are already installed and you don't have to install them.
There are 2 different userparameters files in the "userparameters" directory of this repository.
One uses sudo to run and thus you must give zabbix the correct rights and the other doesn't use sudo.
On recent ZFS on Linux versions (eg version 0.7.0+), you don't need sudo to run zpool list or zfs list so just install the file and you are done.
For older ZFS on Linux versions (eg version 0.6.x), you will need to add some sudo rights with the file . On some distribution, ZoL already includes a file with all the necessary rights at
/etc/sudoers.d/zfs but its content is commented, just remove the comments and any user will be able to list zfs datasets and pools. For convenience, here is the content of the file commented out:
## Allow read-only ZoL commands to be called through sudo
## without a password. Remove the first '#' column to enable.
##
## CAUTION: Any syntax error introduced here will break sudo.
##
## Cmnd alias specification
Cmnd_Alias C_ZFS = \
  /sbin/zfs "", /sbin/zfs help *, \
  /sbin/zfs get, /sbin/zfs get *, \
  /sbin/zfs list, /sbin/zfs list *, \
  /sbin/zpool "", /sbin/zpool help *, \
  /sbin/zpool iostat, /sbin/zpool iostat *, \
  /sbin/zpool list, /sbin/zpool list *, \
  /sbin/zpool status, /sbin/zpool status *, \
  /sbin/zpool upgrade, /sbin/zpool upgrade -v

## allow any user to use basic read-only ZFS commands
ALL ALL = (root) NOPASSWD: C_ZFS
If you don't know where your "userparameters" directory is, this is usually the /etc/zabbix/zabbix_agentd.d folder. If in doubt, just look at your zabbix_agentd.conf file for the line begining by Include=, it will show where it is.
Once you have added the template, restart zabbix-agent so that it will load the new userparameters.
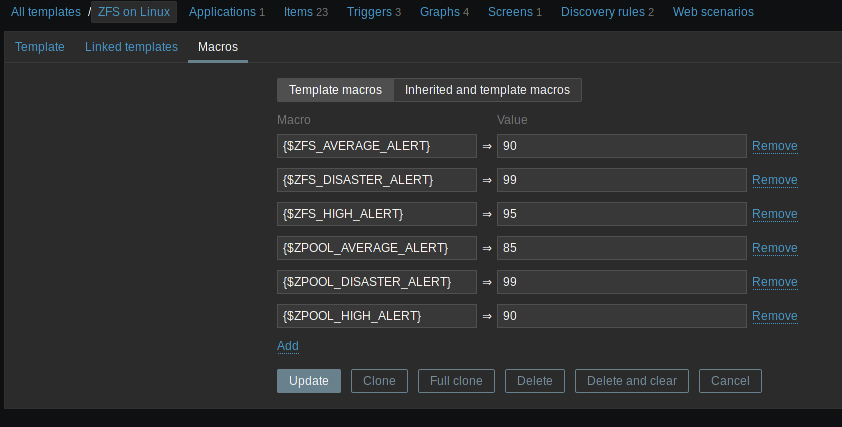
This template includes macros to define when the "low disk spaces" type triggers will fire.
By default, you will find them on the macro page of this template:

If you change them here, they will apply to every hosts linked to this template, which may not be such a good idea. Prefer to change the macros on specific servers if needed.
You can see how the macros are used by looking at the discovery rules, then "Trigger prototypes":

This template uses Zabbix items of type Zabbix agent (active) (= active items). By default, most template uses Zabbix agent items (= passive items).
If you want, you can convert all the items to Zabbix agent and everything will work, but you should really uses active items because those are way more scalable. The official documentation doesn't really make this point clear (https://www.zabbix.com/documentation/4.0/manual/appendix/items/activepassive) but active items are optimized: the agent asks the server for the list of items that the server wants, then send them by batch periodically.
On the other hand, for passive items, the zabbix server must establish a connection for each items and ask for them, then wait for the anwser: this results in more CPU, memory and network consumption used by both the server and the agent.
To make an active item work, you must ensure that you have a ServerActive=your_zabbix_server_fqdn_or_ip line in your agent config file (usually /etc/zabbix/zabbix_agentd.conf).
You also need to configure the "Host Name" on the zabbix UI to be the same as the server output of the hostname command (you can always adjust the "Visible name" in the Zabbix UI to anything you want if needed) because the zabbix agent sends this information to the zabbix server. It basically tells the server "Hello, I am $(hostname), which items do you need from me?" so if there is a mismatch here, the server will most likely answer "I don't know you!" ;-)
Beyond a certain point, depending on your hardware, you will have to use active items.
An old but still relevant blog about high performance zabbix is available on https://blog.zabbix.com/scalable-zabbix-lessons-on-hitting-9400-nvps/2615/ .


