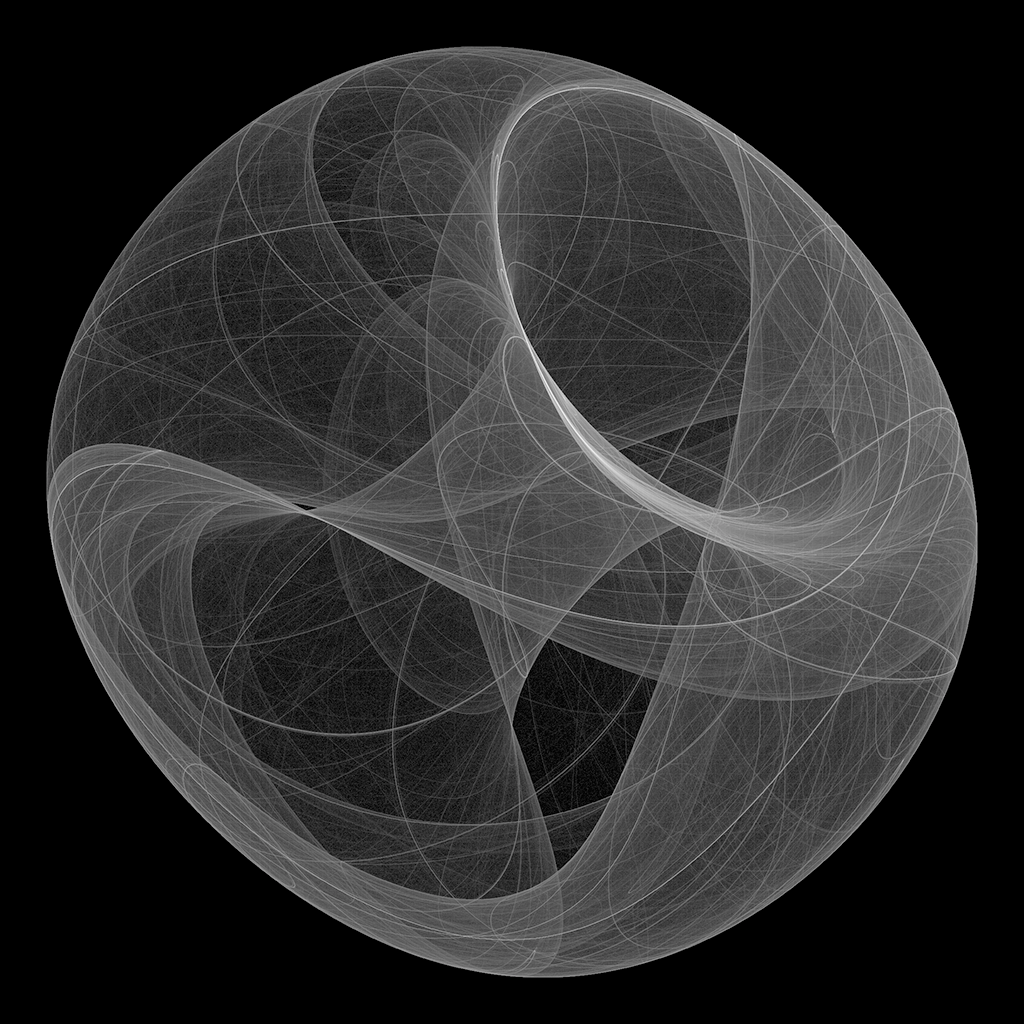
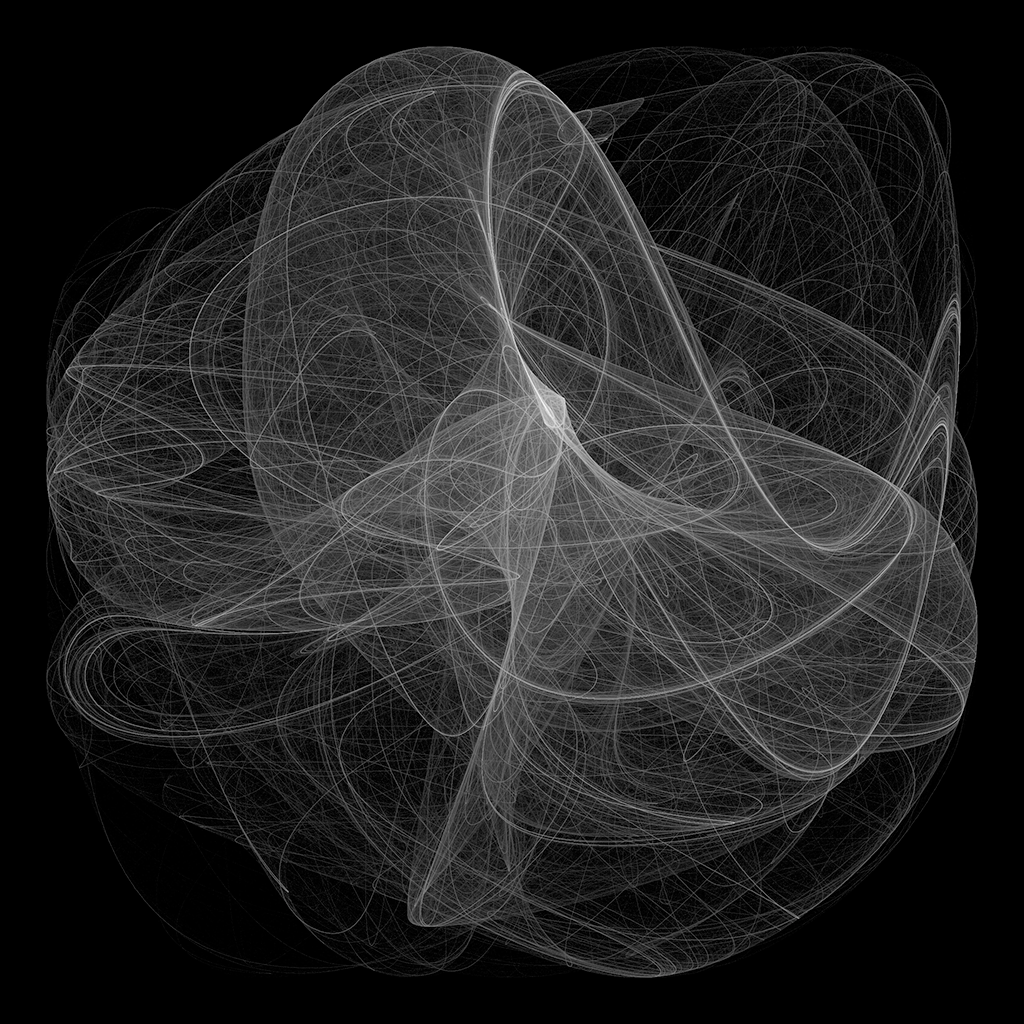
This program takes two arrays of evenly spaced x and y values (together defining evenly spaced points on a grid) and passes them through a set of equations to obtain new x and y values for each point. This new set of x and y values is passed through the equations again for a given number of iterations, tracing the path of each starting point over time.
The number of points created is defined by the lattice_size^2 (number of starting points) multiplied by the number of iterations, which for lattice_size = 100, n_iter = 1000000 (for example) is 10 billion points. Instead of asking our loyal silicon servants to plot the many billions of points that define our paths, we can create a 2D histogram to bin the points into a smaller grid, summing the number of times a point is in each bin. The log of this grid is taken to make the darker values more visible, and it's saved as a 16-bit png.
- Python 3.x
- NumPy
- Matplotlib
- OpenCV
- tqdm
- fast-histogram
First, clone the repository to your local machine. You can do this by running the following command in your terminal:
git clone https://github.com/tristanmanchester/some_nice_python_artThen, install the dependencies:
cd some_nice_python_art
pip install -r requirements.txtThe program consists of the following main files:
This is the entry point of the program. It contains two main sections:
-
Generate images from random parameters in a range
- Uncomment the
generate_random_imagescall to create a batch of images with randomly generated parameters. - Adjust the configuration parameters (
param_ranges,num_images,lattice_size,n_iter,bins,save_folder,equations) as desired.
- Uncomment the
-
Plot a specific equation with specific parameters
- Uncomment the
create_and_plotcall to generate and display a single image with specific parameters. - Modify the
single_image_configdictionary with the desired parameters (params,equation,lattice_size,n_iter,bins,save_folder).
- Uncomment the
This module contains the core functions for generating and saving images:
calculate_paths: Calculates the paths of each point by applying the transformation equation over a specified number of iterations.generate_random_images: Generates a specified number of images using random parameters for the given equations.confirm_execution: Prompts the user to confirm execution when the operation involves processing a large number of points.create_histogram: Creates a histogram from x and y values.create_image: Converts a histogram into a grayscale image.generate_filename: Generates a filename based on the equation name and parameters.plot_specific_equation: Generates an image for a specific equation and set of parameters.ensure_directory_exists: Checks if a directory exists and creates it if necessary.image_saver: Saves the generated image to the specified location.create_and_plot: Creates and plots an image based on the given configuration.
This file contains the mathematical equations used for transforming the points on the grid. You can add your own equations to this file and import them into main.py.
Here are some examples of the images you can generate with this program:


