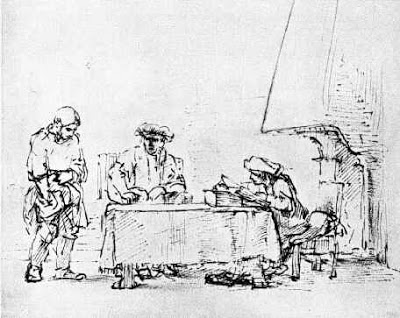
So he called ten of his servants and gave them ten minas. ‘Put this money to work,’ he said, ‘until I come back.’ - Luke 19:11
"A perfection of means, and confusion of aims, seems to be our main problem."" - Einstein
-
Trend
These technical indicators measure the direction of a trend by comparing prices to an established baseline. Direction but not strength.
- Moving averages (MA)
- Parabolic stop and reverse (PSAR): Used to find potential reversals in the market price direction.
- Moving Average Convergence Divergence (MACD): Used to reveal changes in the strength, direction, momentum, and duration of a trend in a stock’s price.
-
Momentum
These technical indicators may identify the speed of price movement by comparing the current closing price to previous closes. Strength and not direction.
- Stochastic Oscillator: Used to predict price turning points by comparing the closing price to its price range.
- Commodity Channel Index (CCI): An oscillator that helps identify price reversals, price extremes, and trend strength.
- Relative Strength Index (RSI): Measures recent trading strength, velocity of change in the trend, and magnitude of the move.
-
Volatility
These technical indicators measure the rate of price movement, regardless of direction.
- Bollinger bands: Measures the “highness” or “lowness” of price, relative to previous trades.
- Average True Range: Shows the degree of price volatility.
- Standard Deviation: Used to measure expected risk and to determine the significance of certain price movements.
- measures risk rising, or risk dropping
-
volume
These technical indicators measure the strength of a trend based on volume of shares traded.
- Chaikin Oscillator: Monitors the flow of money in and out of the market, which can help determine tops and bottoms.
- On-Balance Volume (OBV): Attempts to measure level of accumulation or distribution, by comparing volume to price.
- Volume Rate of Change: Highlights increases in volume. These normally happen mostly at market tops, bottoms, or breakouts.
-
Money Flow
- is stock being accumulated or distributed
- https://www.investors.com/how-to-invest/investors-corner/tracking-distribution-days-a-crucial-habit/
-
Sentiment
- too fearful? too euphoric?
- Natural Language Toolkit - http://www.nltk.org/
- Examples:
-
Breadth
- healthy move or unhealthy move
http://thepatternsite.com/CandleEntry.html
https://www.candlestickforum.com/PPF/Parameters/16_263_/candlestick.asp
https://www.quantopian.com/lectures
https://camdavidsonpilon.github.io/Probabilistic-Programming-and-Bayesian-Methods-for-Hackers/
Docs:
Links:
-
JohnnyQuotron:
-
DMonkey:
-
StanL:
- Onenote: https://onedrive.live.com/view.aspx?resid=186A54BC7E98AF81!114&app=OneNote&authkey=!AM6a5se-lH2yutg
- PDF to Markdown of snippet collection: https://github.com/jshingler/TOS-and-Thinkscript-Snippet-Collection/
-
Mobius
Github: - https://github.com/themechanicalbear/ThinkScript - https://github.com/buckyinsfo/thinkscript - https://github.com/anupambagchi/denken - https://github.com/ranrotx/thinkscript - https://github.com/sheldonth/thinkscripts - https://github.com/Gerst20051/ThinkScripts - https://github.com/philipbred/tos-thinkscript - https://github.com/drewgriffith15/ThinkOrSwim - https://github.com/Nicholas-Picini/Thinkscript-Strategies
James Simons
David Swensen
Louis Bacon
Steven Cohen
Kenneth Griffin
Paul Tudor Jones
George Soros
Michael Steinhardt
Jack Nash
Seth Klarman
Alfred Jones
Leon Levy
Julian Roberston
Bruce Kovner
https://en.wikipedia.org/wiki/Autocorrelation
https://www.quantopian.com/lectures
- https://www.quantopian.com/lectures/linear-correlation-analysis
- https://www.quantopian.com/lectures/p-hacking-and-multiple-comparisons-bias
- https://www.quantopian.com/lectures/introduction-to-pairs-trading
- https://www.quantopian.com/lectures/integration-cointegration-and-stationarity
https://stockcharts.com/school/doku.php?id=chart_school:trading_strategies
https://www.investopedia.com/trading/continuation-patterns-introduction/

