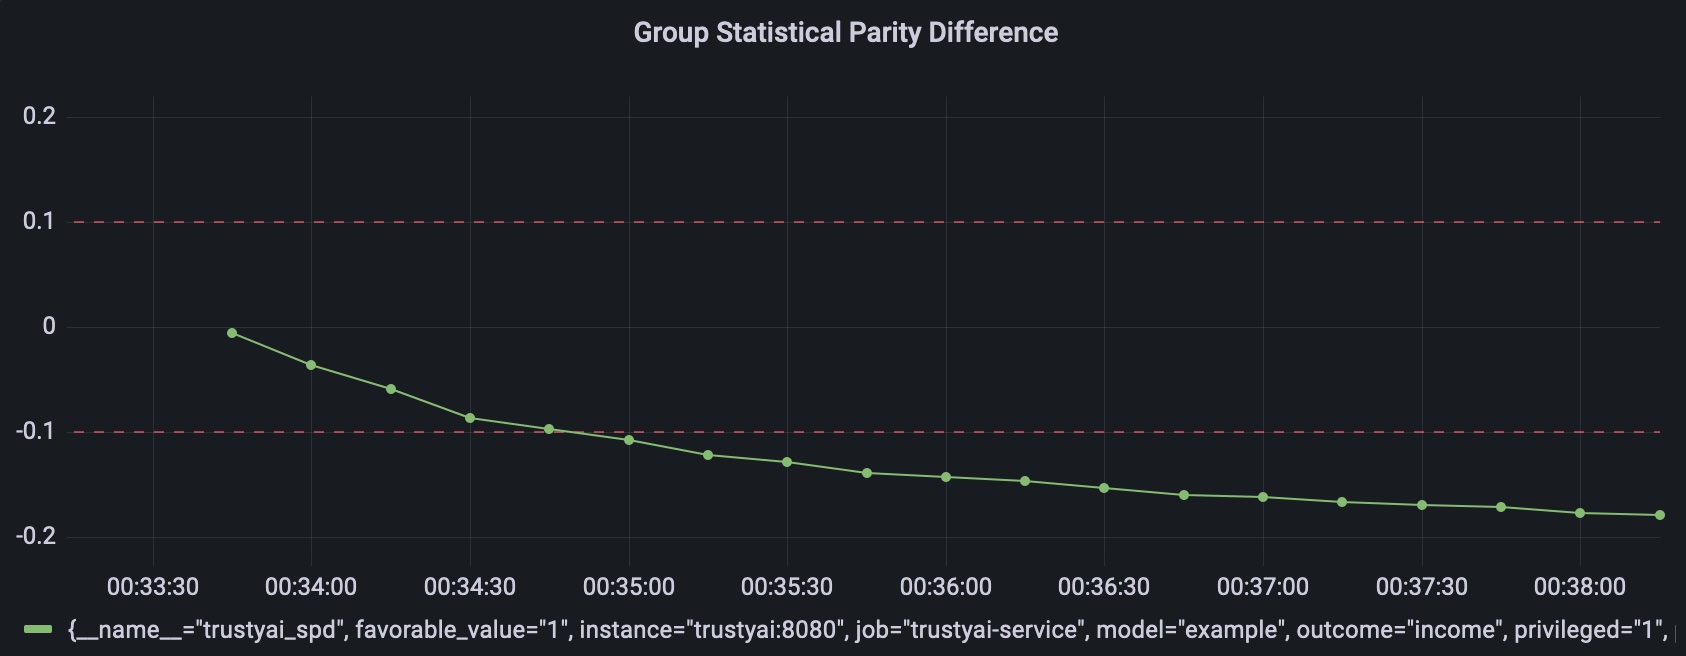
The demo consists of a "data logger", which writes data inputs and outputs to a MinIO bucket, the TrustyAI service, Prometheus and Grafana.
Build the TrustyAI service container image with:
mvn clean installBuild the remaining images using:
$ cd demo
$ docker compose build
Finally, run the demo using:
$ docker compose upIssue a metric request to, for instance:
curl -X POST --location "http://localhost:8080/metrics/spd/request" \
    -H "Content-Type: application/json" \
    -d "{
          \"protectedAttribute\": \"gender\",
          \"favorableOutcome\": 1,
          \"outcomeName\": \"income\",
          \"privilegedAttribute\": 1,
          \"unprivilegedAttribute\": 0
        }"
And observe the trustyai_spd metric in Prometheus: http://localhost:9090
To use your own provided data, configure the MinIO container (by pre-populating it with data, according to
the steps below)
and run the container using (either docker, podman):
docker run -p 8080:8080 \
    --env SERVICE_STORAGE_FORMAT=CSV \
    --env SERVICE_MODEL_NAME=example \
    --env SERVICE_STORAGE_FORMAT="MINIO" \
    --env MINIO_BUCKET_NAME="inputs" \
    --env MINIO_ENDPOINT="http://localhost:9000" \
    --env MINIO_INPUT_FILENAME="income-biased-inputs.csv" \
    --env MINIO_OUTPUT_FILENAME="income-biased-outputs.csv" \
    --env MINIO_SECRET_KEY="minioadmin" \
    --env MINIO_ACCESS_KEY="minioadmin" \
    --env SERVICE_METRICS_SCHEDULE="5s" \
trustyai/trustyai-service:1.0.0-SNAPSHOT -d In order to set up MinIO for local development, first install the MinIO client mc.
Run the MinIO server with
docker run \
   -p 9000:9000 \
   -p 9090:9090 \
   --name minio \
   -v ~/minio/trustyai-service/data:/data \
   -e "MINIO_ROOT_USER=minioadmin" \
   -e "MINIO_ROOT_PASSWORD=minioadmin" \
   quay.io/minio/minio server /data --console-address ":9090"
Connect to MinIO using:
mc alias set local http://127.0.0.1:9000 minioadmin minioadminNow create a bucket, for instance, inputs:
mc mb local/inputsCopy a file into the bucket:
mc cp data/income-biased-inputs.csv local/inputsOptionally, check the file was successfully copies:
mc ls local/inputsWhich should produce:
[2023-02-09 23:01:49 GMT] 68KiB income-biased-inputs.csv
The OpenAPI schema can be displayed using
curl -X GET --location "http://localhost:8080/q/openapi"Each of the metrics default bounds can be overridden with the corresponding environment variable, e.g.
METRICS_SPD_THRESHOLD_LOWERMETRICS_SPD_THRESHOLD_UPPERMETRICS_DIR_THRESHOLD_LOWER- etc
Get statistical parity difference at /metrics/spd
curl -X POST --location "http://localhost:8080/metrics/spd" \
    -H "Content-Type: application/json" \
    -d "{
          \"protectedAttribute\": \"gender\",
          \"favorableOutcome\": 1,
          \"outcomeName\": \"income\",
          \"privilegedAttribute\": 1,
          \"unprivilegedAttribute\": 0
        }"
Returns:
HTTP/1.1 200 OK
content-length: 199
Content-Type: application/json;charset=UTF-8

{
  "type": "metric",
  "name": "SPD",
  "value": -0.2531969309462916,
  "timestamp": 1675850601910,
  "thresholds": {
    "lowerBound": -0.1,
    "upperBound": 0.1,
    "outsideBounds": true
  },
  "id": "ec435fc6-d037-493b-9efc-4931138d7656"
}curl -X POST --location "http://localhost:8080/metrics/dir" \
-H "Content-Type: application/json" \
-d "{
\"protectedAttribute\": \"gender\",
\"favorableOutcome\": 1,
\"outcomeName\": \"income\",
\"privilegedAttribute\": 1,
\"unprivilegedAttribute\": 0
}"HTTP/1.1 200 OK
content-length: 197
Content-Type: application/json;charset=UTF-8
{
"type": "metric",
"name": "DIR",
"value": 0.3333333333333333,
"id": "15f87802-30ae-424b-9937-1589489d6b4b",
"timestamp": 1675850775317,
"thresholds": {
"lowerBound": 0.8,
"upperBound": 1.2,
"outsideBounds": true
}
}In order to generate period measurements for a certain metric, you can send a request to the /metrics/$METRIC/schedule.
Looking at the SPD example abov,e if we wanted the metric to be calculated periodically we would request:
curl -X POST --location "http://localhost:8080/metrics/spd/request" \
    -H "Content-Type: application/json" \
    -d "{
          \"protectedAttribute\": \"gender\",
          \"favorableOutcome\": 1,
          \"outcomeName\": \"income\",
          \"privilegedAttribute\": 1,
          \"unprivilegedAttribute\": 0
        }"
We would get a response with the schedule id for this specific query:
HTTP/1.1 200 OK
content-length: 78
Content-Type: application/json;charset=UTF-8

{
  "requestId": "3281c891-e2a5-4eb3-b05d-7f3831acbb56",
  "timestamp": 1676031994868
}
The metrics will now be pushed to Prometheus with the runtime provided SERVICE_METRICS_SCHEDULE configuration (
e.g. SERVICE_METRICS_SCHEDULE=10s)
which follows the Quarkus syntax.
To stop the periodic calculation you can issue an HTTP DELETE request to the /metrics/$METRIC/request endpoint, with the id
of periodic task we want to cancel
in the payload.
For instance:
curl -X DELETE --location "http://{{host}}:8080/metrics/spd/request" \
    -H "Content-Type: application/json" \
    -d "{
          \"requestId\": \"3281c891-e2a5-4eb3-b05d-7f3831acbb56\"
}"Whenever a metric endpoint is called with a HTTP request, the service also updates the corresponding Prometheus metric.
The metrics are published at /q/metrics and can be consumed directly with Prometheus.
The examples also include a Grafana dashboard to visualize them.
Each Prometheus metric is scoped to a specific model and attributes using tags.
For instance, for the SPD metric request above we would have a metric:
trustyai_spd{
    favorable_value="1",
    instance="trustyai:8080",
    job="trustyai-service",
    model="example",
    outcome="income",
    privileged="1",
    protected="gender",
    request="e4bf1430-cc33-48a0-97ce-4d0c8b2c91f0",
    unprivileged="0"
}
Storage backend adapters implement the Storage interface which has the responsibility
of reading the data from a specific storage type (flat file on PVC, S3, database, etc)
and return the inputs and outputs as ByteBuffer.
From there, the service converts the ByteBuffer into a TrustyAI Dataframe to be used
in the metrics calculations.
The type of datasource is passed with the environment variable SERVICE_STORAGE_FORMAT.
The supported data sources are:
- MinIO
The data can be batched into the latest n observations by using the configuration key
SERVICE_BATCH_SIZE=n. This behaves like a n-size tail and its optional.
If not specified, the entire dataset is used.
An explainer can be linked to the service using the environment
variables SERVICE_KSERVE_TARGET and SERVICE_MODEL_NAME.
These will be used by the service's gRPC client which can natively
query KServe and ModelMesh using that endpoint.
To deploy in Kubernetes or OpenShift, the connection information can be passed in the manifest as environment variables:
apiVersion: apps/v1
kind: Deployment
spec:
  template:
    spec:
      containers:
        - env:
            - name: KUBERNETES_NAMESPACE
              valueFrom:
                fieldRef:
                  fieldPath: metadata.namespace
            - name: KSERVE_TARGET
              value: localhost
            - name: STORAGE_FORMAT
              value: RANDOM_TEST
            - name: MODEL_NAME
              value: example
          image: trustyai/trustyai-service:1.0.0-SNAPSHOT
          name: trustyai-service
          ports:
            - containerPort: 8080
              name: http
              protocol: TCP