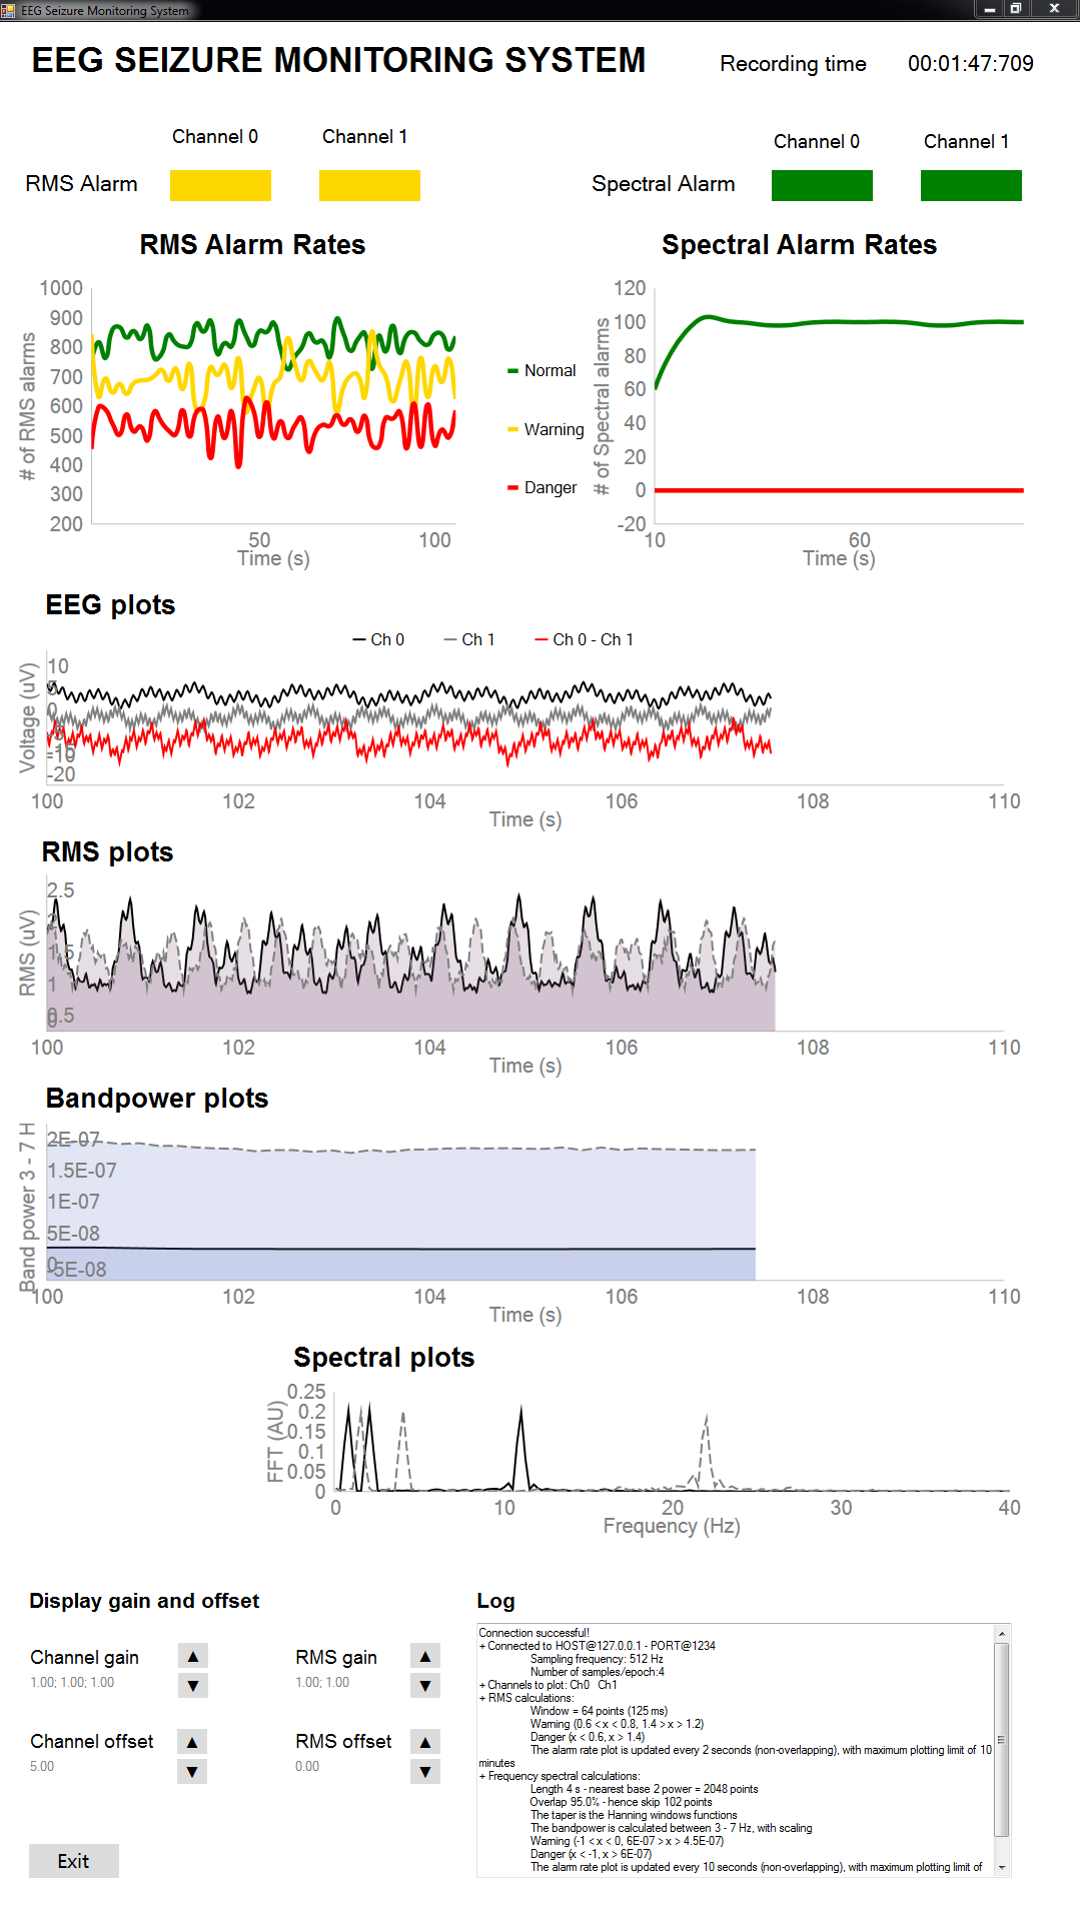
EEG Seizure Filter GUI
Leo Towle 's lab - University of Chicago
Contributors: Dominic Dicario, Tuan Pham
Purpose: Designing a GUI to visualize streamed EEG data and indication of seizure activity based on customized threshold via root-mean-square and spectral-related calculation of the EEG data
Requirements: Communication with EEG data port. The way this was set up assumes communication with softwares like OpenViBE Designer and OpenViBE Acquisition
Description: For a more detailed description, please refer to docs//master_instructions.pdf
-
This program reads in data from a TCP server generated by OpenViBE Designer. For the acquisition, it takes in the data given at 512 Hz signal delivered in 4-sample chunks. The root-mean-square (RMS) of a certain length of data is calculated like a sliding RMS function. The short-time Fourier Transform (STFT) of a certain length of data is also obtained to calculate the spectral of the signal, as well as the total band power of a certain frequency band (limited band power or LBP).
-
The program also evaluates the alarm level of both RMS and LBP. If the RMS (or LBP) approaches certain upper or lower bounds, the graphical interface of the program will change the color of a bar to signify this, the default choice is from green (normal) to yellow/gold (warning), to red (danger). Right now, the upper and lower bounds of these ranges has been arbitrarily decided. To use this program for the visual prosthesis, these values will either have to be pre-determined or determined after experimentation has begun.We must decide whether to err on the side of safety or risk.
And this is the diagram showing the communication between the program and the OpenViBE software
