This is a Java Application Performance Monitoring Plugin for Intellij, that tracks every detail of the JVM (CPU, thread, memory, garbage collection, etc) and also monitors applications live in production environments.
The Plugin was built using gradle with the Intellij Platform SDk.
In addition, this plugin uses the NewRelic JFR Daemon to do the application profiling. You can also find more information about NewRelic profiling here.
With the New Relic's real-time profiling for Java using Java Flight Recorder (JFR) metrics, you can run steadily, always-on profiling of your Java code in production environments. This Plugin uses NewRelic JFR Daemon gain insight into the JVM and its operations, such as analysis from the ThreadLocal Allocation Buffer (TLAB) that can pinpoint which threads are allocating which object types. This can often be used in connection with garbage collection analysis to reveal not only what is being thrown away, but also where it is coming from.
  - Flight Recorder
  - Java Application
  - Java Virtual Machine
  - Operating System
The JFR daemon serves as a transporter for JFR events and allows you to control the ability of the New Relic One platform for visualizing your JVM's behavior.
  - JVM Information
  - JFR Compilation
  - JFR Method Sample
  - Java Monitor Wait
-
Manually:
Download the latest release and install it manually using Settings/Preferences > Plugins > ⚙️ > Install plugin from disk...
-
Navigate to the downloaded jar from the previous step and click on OK
-
A preview of the NewRelic Profiler will show on the right side, then you click Apply and OK. Afterwards the NewRelic profiler window will be seen at the lower toolbar as displayed below.
- This plugin currently supports the intelliJ versions 2020.1.* up to the current version.
-
Steps To Follow
-
Go to: File > Project Structure
-
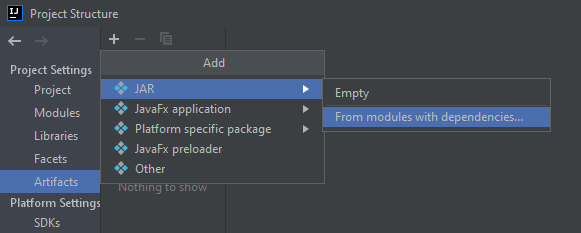
Select Artifacts > + > Jar > From Modules With dependencies
-
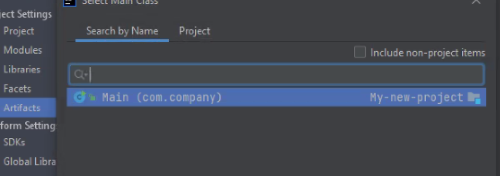
Choose the main class and click on OK.
-
Ensure to check the "Include in project build", afterwards click on Apply and OK.
-
Go to: Build Menu > Build Artifacts... > Select your application jar > Build
-
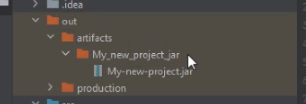
After building, the project's jar will be generated into the directory
out > artifactsas shown in the image below
- Ensure that the name of the jar generated and its directory have the same name as the name of your application as shown in the image above.
-
- Before you run your application with the profiler, open the New Relic Java Profiler tool window to activate its local server. Only open the tool window in the project you wish to profile.
- Profiling can be done multiple times on the same project once the server is still active.
- After profiling, close the project window entirely to deactivate the local server.
- The same process can be repeated for another project.
-
To Run with profiler: Goto Run > Run with NewRelic Profiler
-
A pop-up will appear which will require that you set your main class as depicted in the image below.
-
For gradle projects, the module has to be set to the location of the main class before the main class can be found and set. For example in the image below, the main class (GradleSpringTestProjectApplication) is located in the "main" module before the project's root module. Therefore, the module will be set to the option highlighted below.
-
Click on Run
-
Subsequently, the NewRelic run configuration will be saved and added to the run configuration list
-
The results below indicates that your application is about to be profiled

-
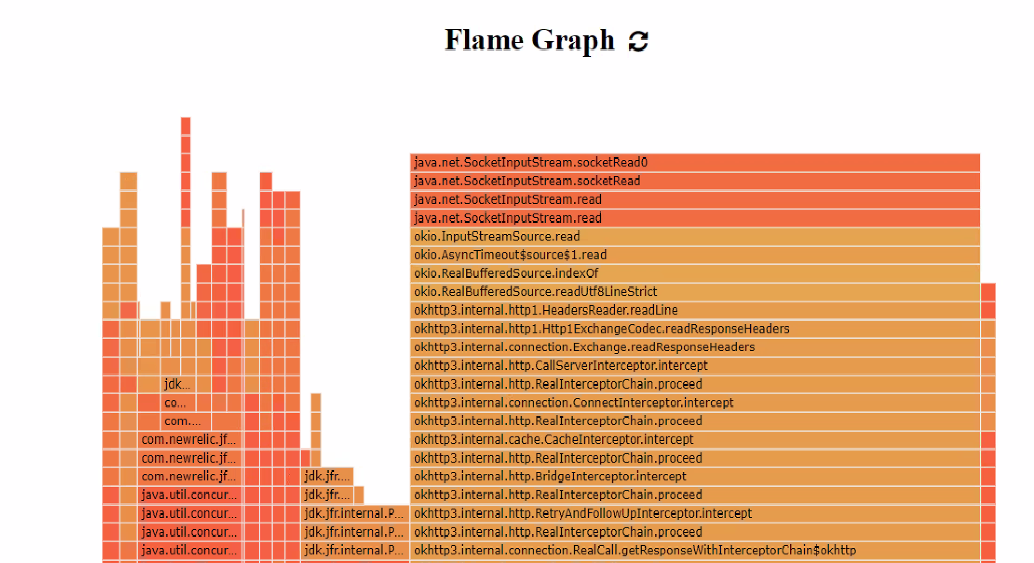
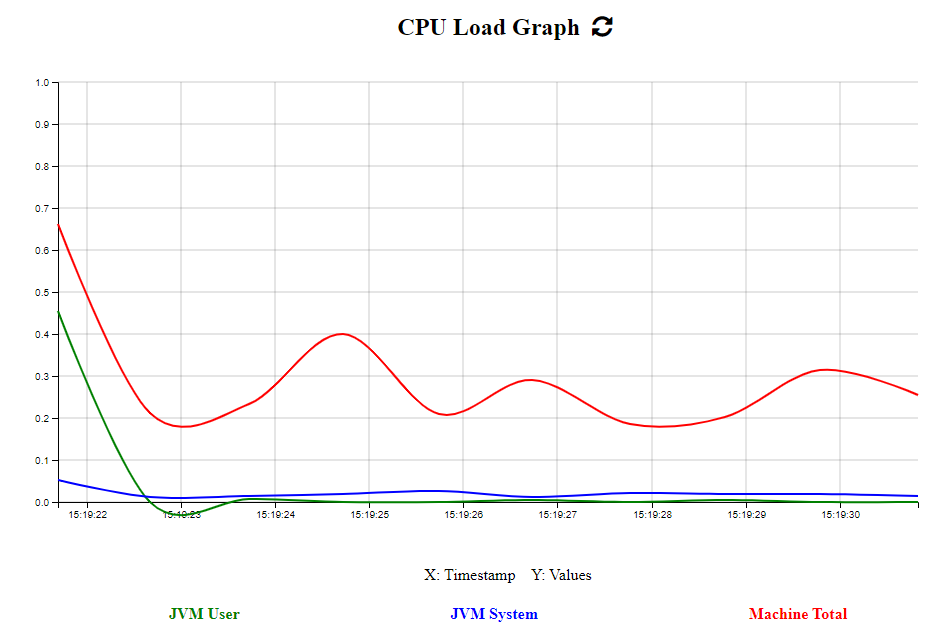
You can then view the data in the tool window
  - Do not tamper with the Vm options and Environment variables unless you know what you are doing.
  - Ensure you stop NewRelic profiler from running when you are done profiling your application in order to avoid getting full heap error or warnings.
- Spiermar's D3.js Flame Graph Library was used to develop the flame graph
- Spiermar's Burn Library was used to help convert the profiled data into the required format needed for the flame graph. The Burn Library is originally in GoLang and aspects of it was converted to Java for the purpose of this plugin.
- D3.js Library for the Metric Graphs
