IBM APM plugin for Grafana
Version 0.9 includes a couple of new features (see Changelog) and dashboards created with older version of the IBM APM Grafana plugin may be not fully compatible. You may need to fix or recreate some of the table and singlestat panels.
You may be also interested in Prometheus exporter for ITM.
- Introduction
- Configure the ITM/APM data source
- Query Editor
- Templating
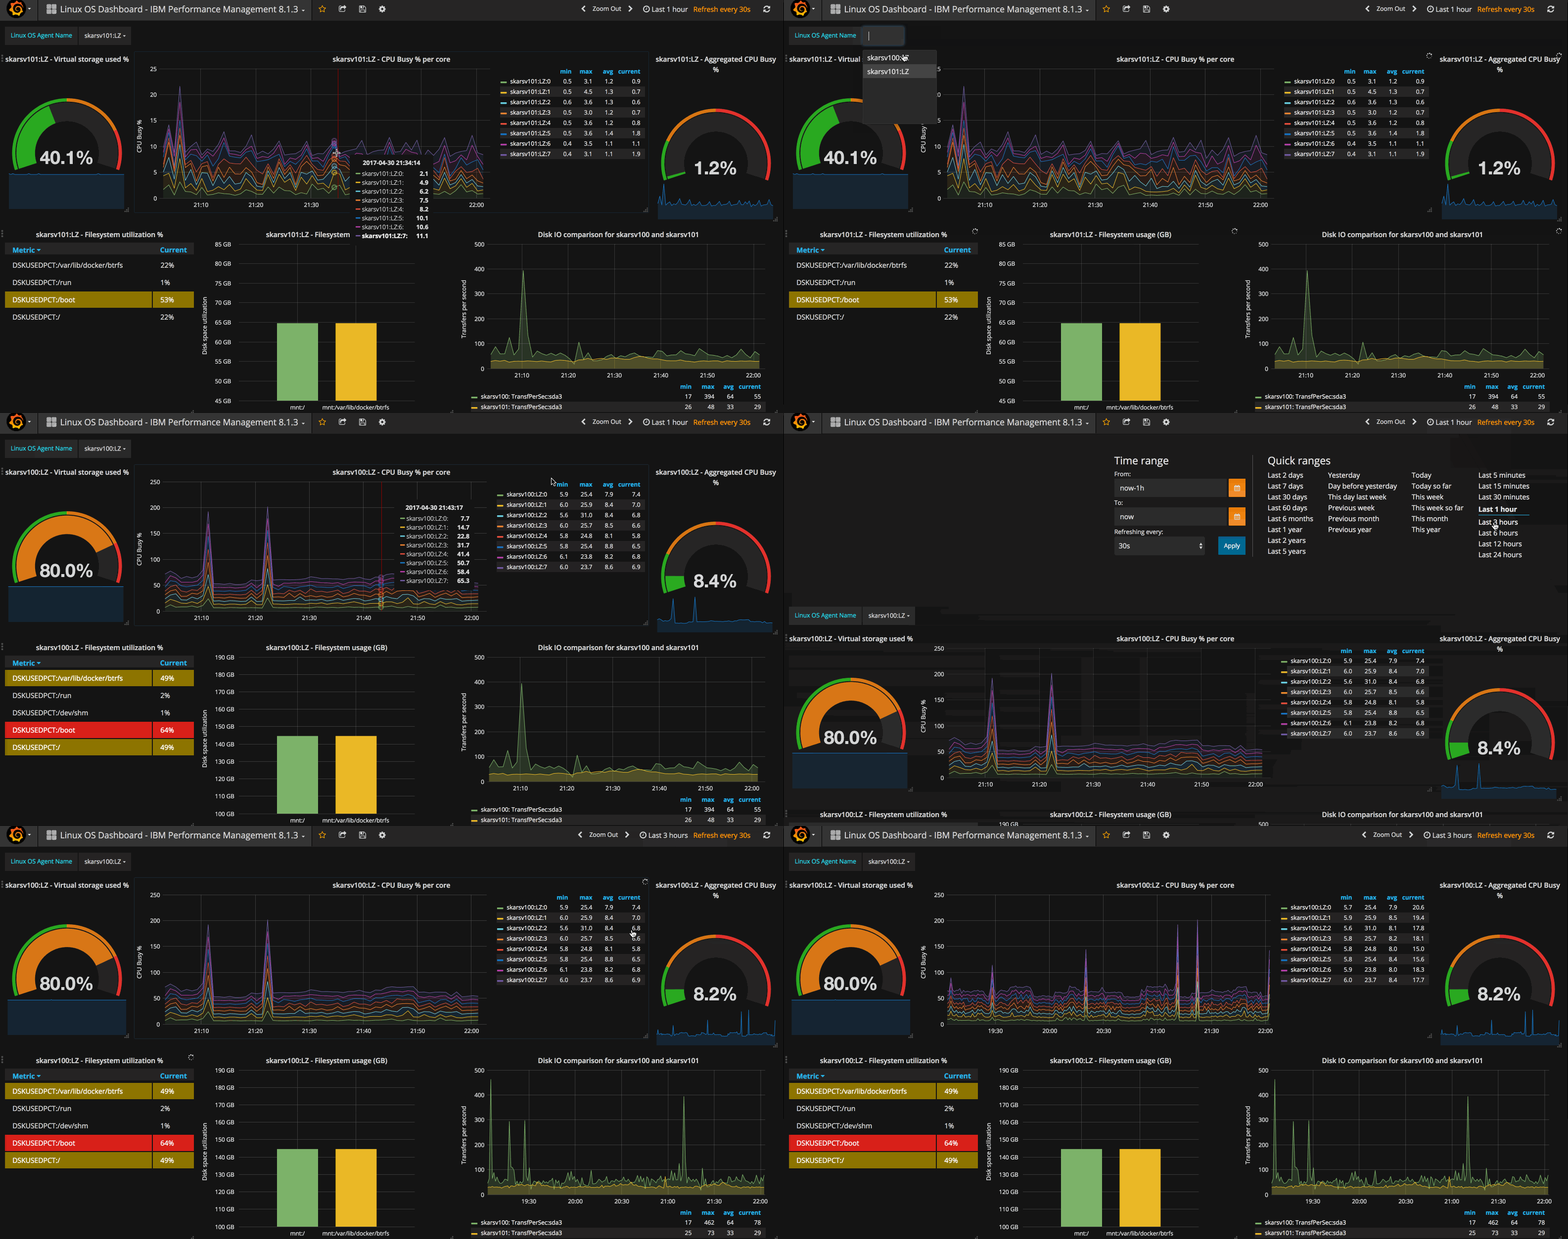
- Example dashboards
- Troubleshooting
Introduction
IBM APM plugin provides Grafana support for:
- IBM Tivoli Monitoring 6.x and IBM OMEGAMON
- IBM SmartCloud Application Performance Management 7.x
- IBM Cloud Application Performance Management Private
The plugin collects data directly from APM v8 or ITM v6 metrics REST API.
Configure the ITM/APM data source
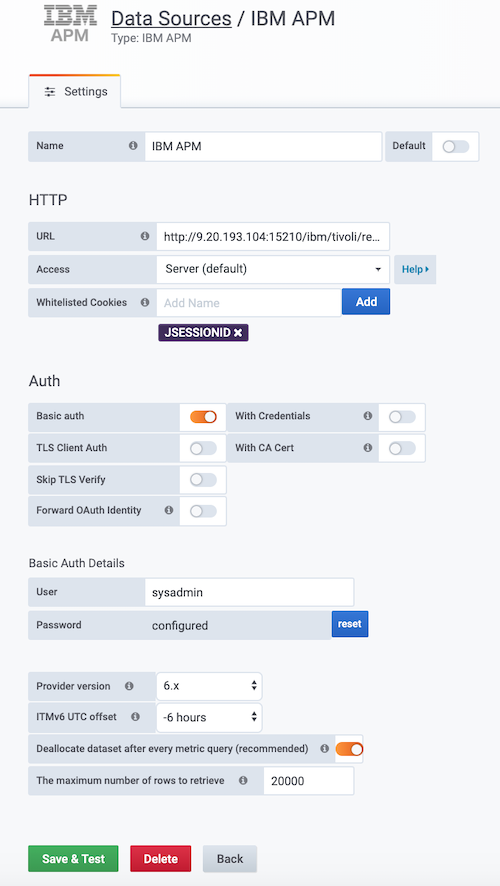
The screen below illustrates the configuration for the ITM v6 data source:
Specify the REST API URL:
- APMv8
http://<apm_server_hostname>:8090/ibm/tivoli/rest/providers/itm.KD8
- ITMv6/SCAPMv7
http://<TEPS_server_hostname>:15200/ibm/tivoli/rest/providers/itm.<TEMS_NAME>
Note: If you connect IBM APM data source to Hub TEMS with HA configuration or <TEMS_NAME> contains non-alphanumeric characters, then define Domain Override in TEPS Data Provider. Check issue #3 for more details.
Select Basic Auth and specify the user name
- APMv8 –
smadmin - ITMv6/SCAPMv7 -
sysadmin
Select checkbox Deallocate dataset after every metric query. It is recommended to have it enabled all the time. Lack of datasource deallocation requests may cause memory leak and OutOfMemory exceptions on APM or ITM server. Disable this option only for testing a new panel query, if you want to use Grafana Query Inspector feature.
Query Editor
The query editor for IBM APM Grafana plugin helps to assemble ITM/APM metrics API request.
The examples below show how to use it.
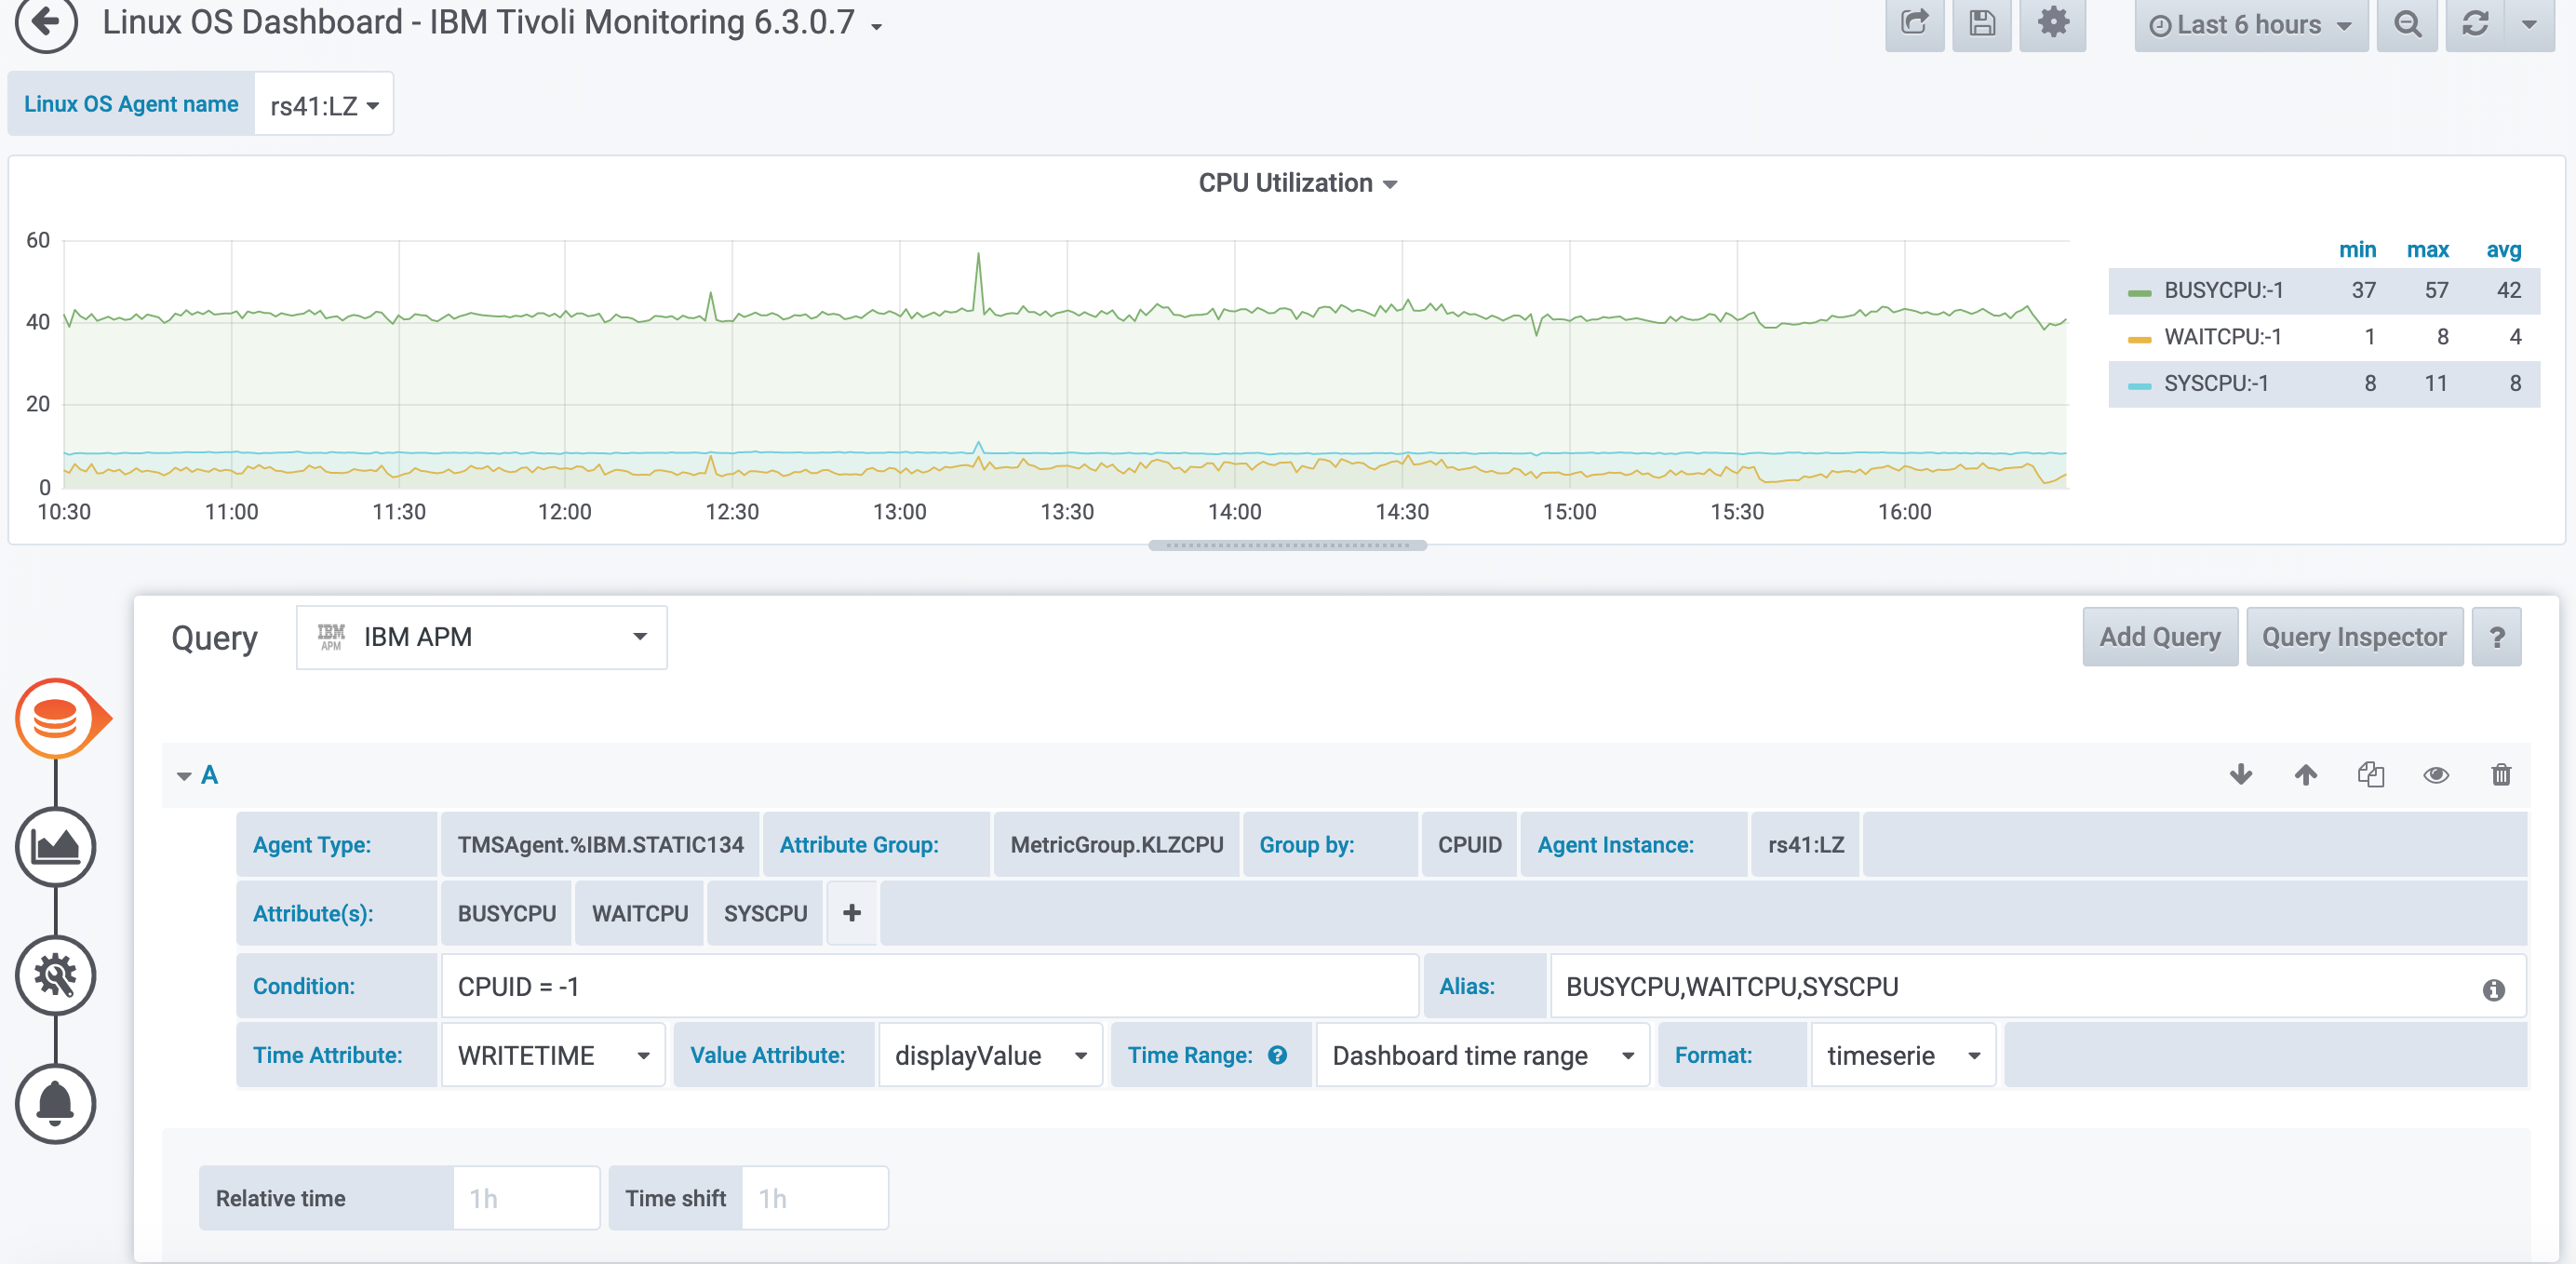
Example 1: Line chart for Linux OS CPU
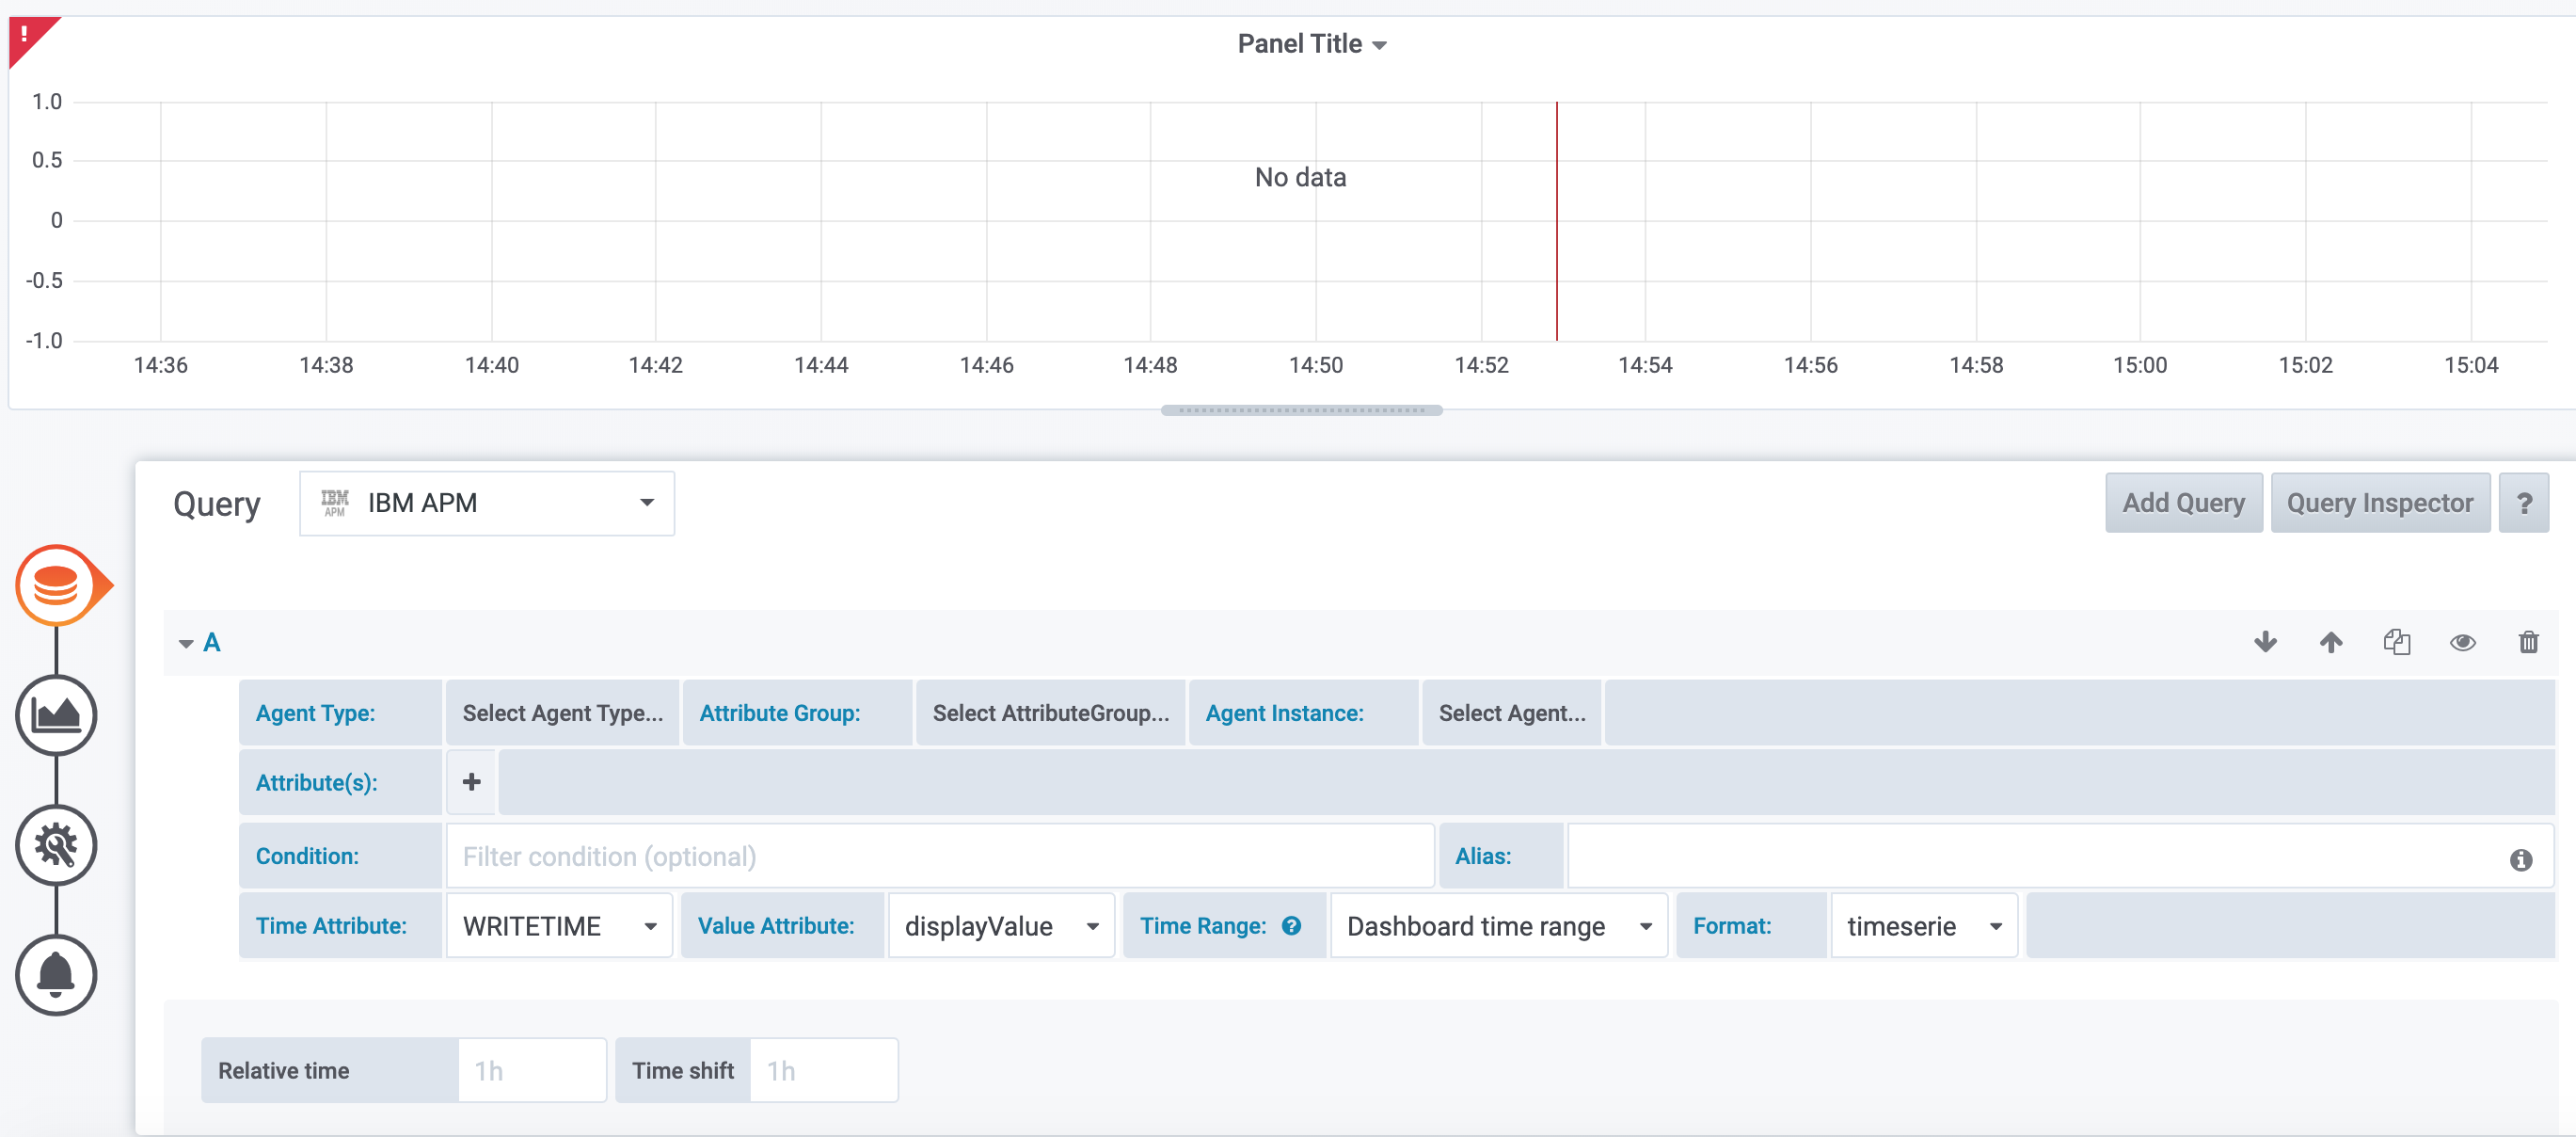
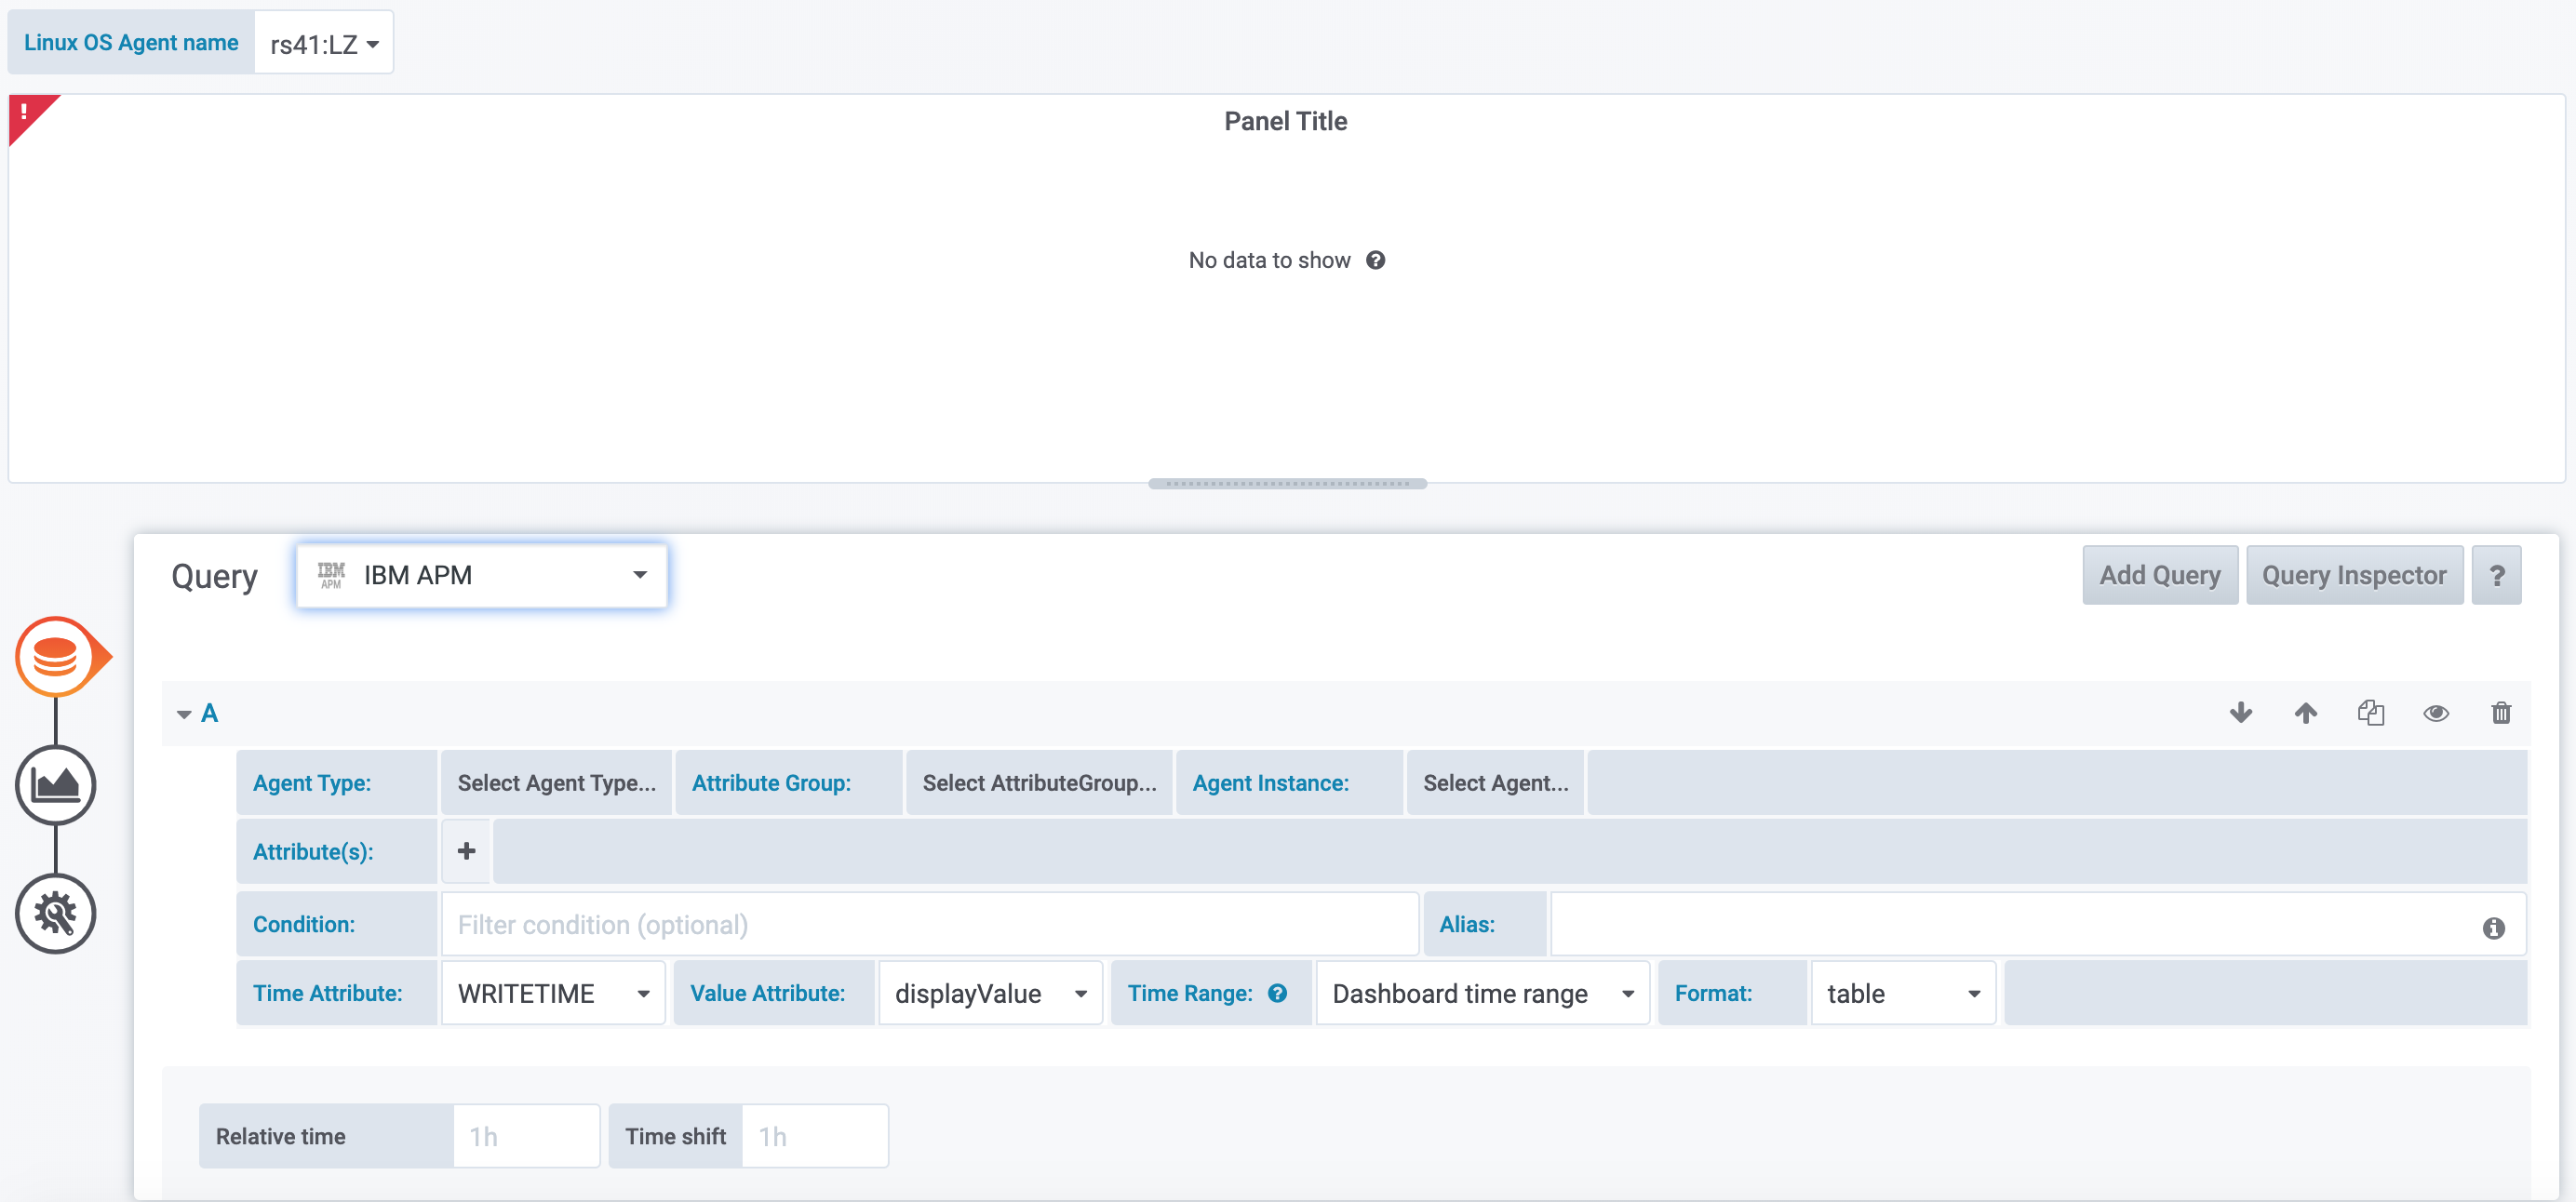
1). Add new panel, select Graph as a visualization type, select Queries and your configured IBM APM data source.
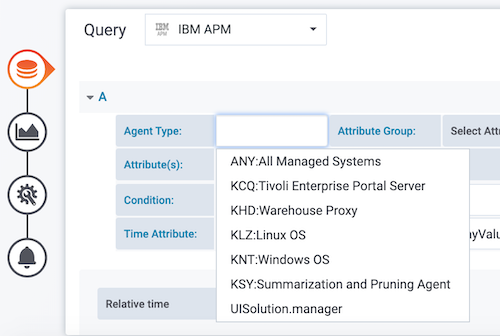
2). Select Agent Type. You can type agent code or agent type name to search for supported agent type or scroll down a dropdown list.
The list is built dynamically through the REST API call. If the resulting dropdown list is empty, a possible cause might be a connection problem with the APM REST API. You can troubleshoot it with Developer Tools in Chrome or Firebug in Firefox (see the Troubleshooting chapter at the end of this document).
3). Similar way select other parameters like Attribute Group, Group by (only for Attribute groups with Primary Key/Display Item) and Agent Instance. Make sure that selected Format for Graph panel is timeserie.
4). Click + to select one or more Attributes (metrics).
5). Optionaly specify a Condition (for filtering results) and edit default Aliases for parameter name
customization. Alias, if defined, will replace the default parameter name in the legend. The default is AttributeName:DisplayItem. The alias replaces AttributeName part.
6). The result should be similar to the one below:
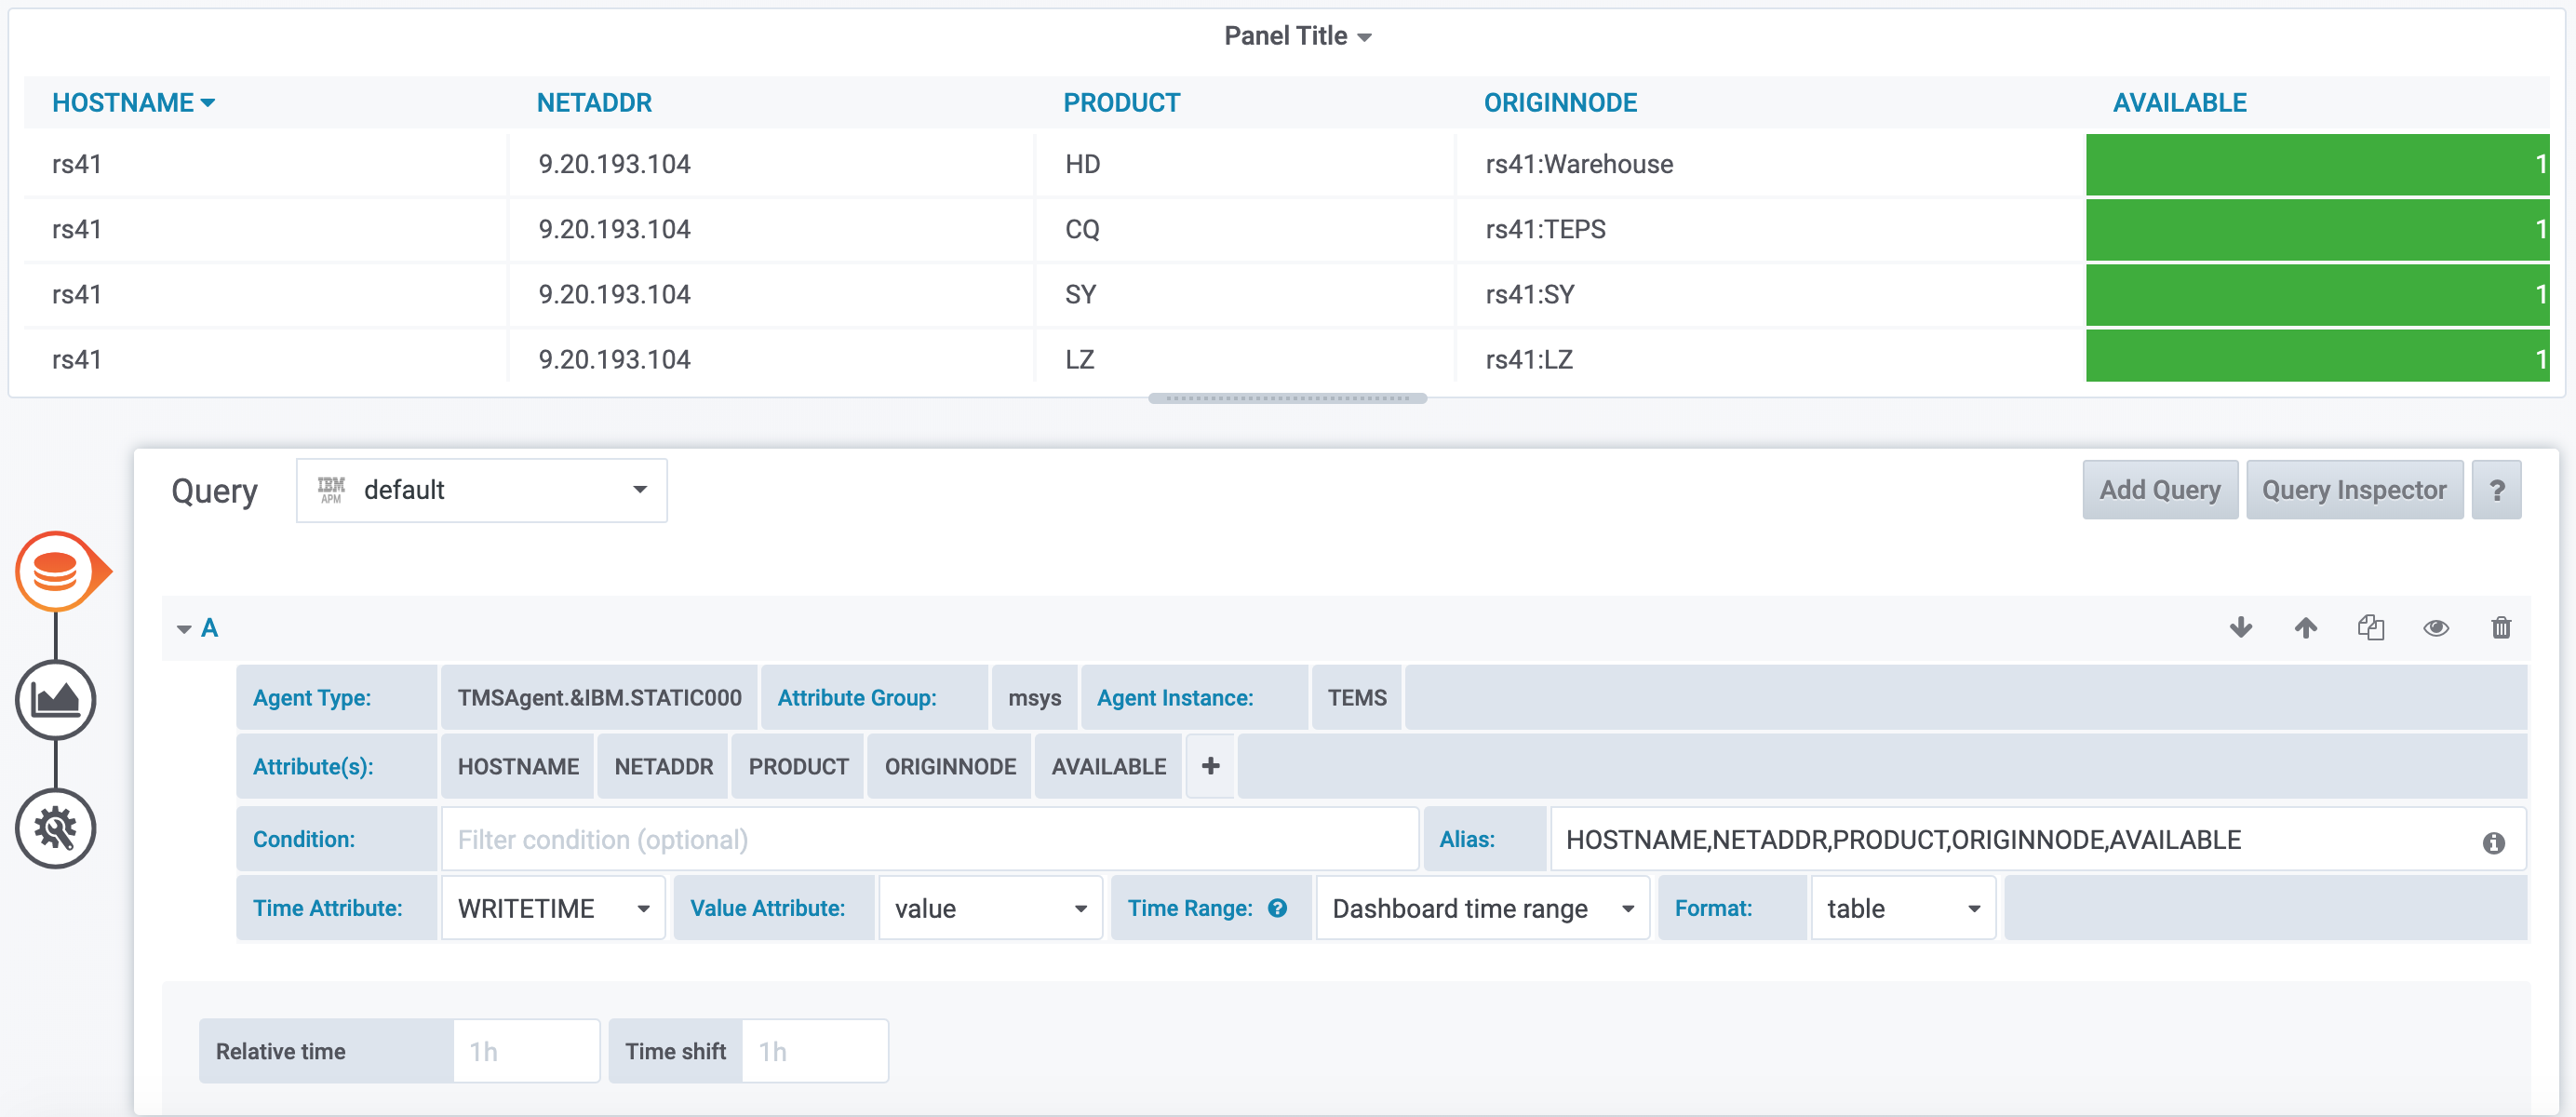
Example 2: Table with Agents status
1). Add new panel, select Table as a visualization type, select Queries and your configured IBM APM data source.
2). Select parameters in the first row of Query Editor like Agent Type, Attribute Group. In our example we will show current agent status, so select ANY:All Managed Systems Agent Type, Managed System Information Attribute Group, and TEMS Agent Instance. Make sure that selected Format for Table panel is table.
3). Select the following Attributes in the second row of Query Editor: HOSTNAME, NETADDR, PRODUCT, ORIGINNODE, AVAILABLE.
4). The result should be similar to the one below:
Templating
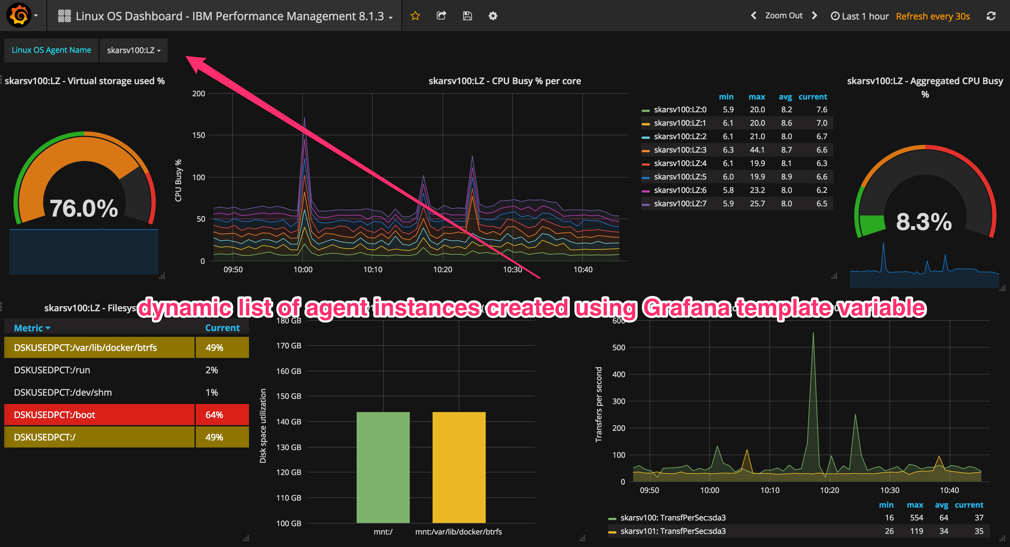
The IBM APM plugin for Grafana supports the basic templating feature.
The agent instances list (dynamic and searchable) in the upper left corner was created using Grafana template variable. When you select another agent instance, all the panels are updated with data from another agent instance.
How to set it up step by step:
-
Create the template variable. Click
 Manage dashboards > Templating, then click the +New
 -
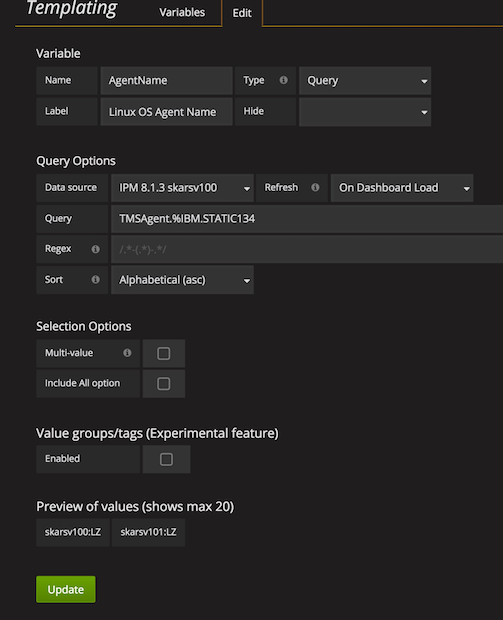
Specify the template settings as shown in the picture below:
Variable name AgentName will be used in a panel query as $AgentName and will be substituted during query execution by the current option selected from the upper-left corner list. Select your APM Data Source and specify agent type in the Query.
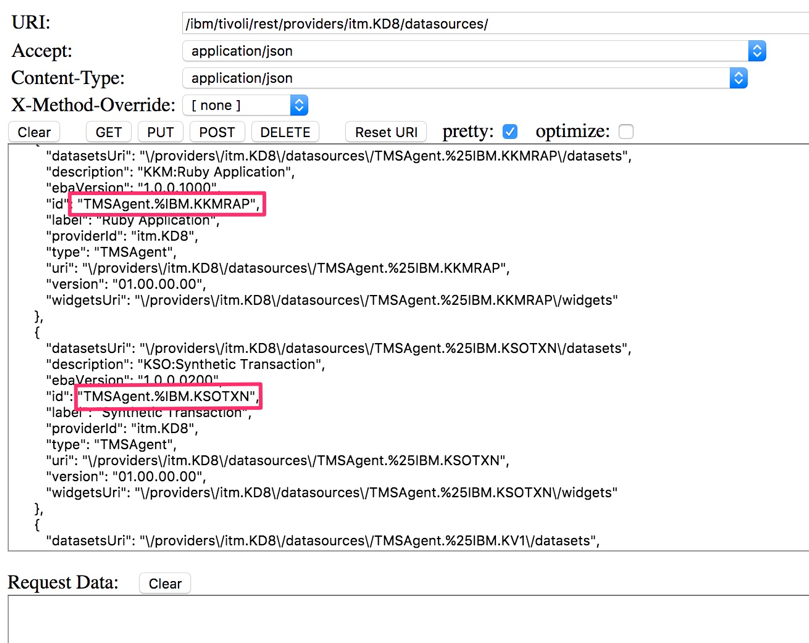
Agent Type in the Query field should be specified in an obscure form of the APM REST API datasource id (it may be improved in a future version of the plugin). For example, for Linux OS Agent it is TMSAgent.%IBM.STATIC134.
Datasource IDs can be listed using APM REST API test tool via HTTP GET request of the following URL:
/ibm/tivoli/rest/providers/itm.KD8/datasources for APMv8 or /ibm/tivoli/rest/providers/itm.<TEMS_name>/datasources for ITMv6/SCAPMv7.
