This repo is a collection of the notebooks used to complete the UW Physics 417 neural networks course. This work is a collaboration between Thomas Sweeney and Megan Sarkissian. Special thanks to professor Shih-Chieh Hsu for his advising throughout this project.
The aim of this project was to take a dataset of "Strain" gravitational wave data and classify it into 4 categories:
- Binary Black Hole Merger (BBH): Occurs when two black holes orbit each other until they eventually collide.
- Core Collapse Supernova (CCSN): Occurs when fusion stops in the core of a large star, causing gravity to collapse the star on itself. This causes a massive explosion which generates gravitational waves.
- Glitch: Loud instrumental or environmental effects. Many sources and types of glitches.
- Background: No event occuring.
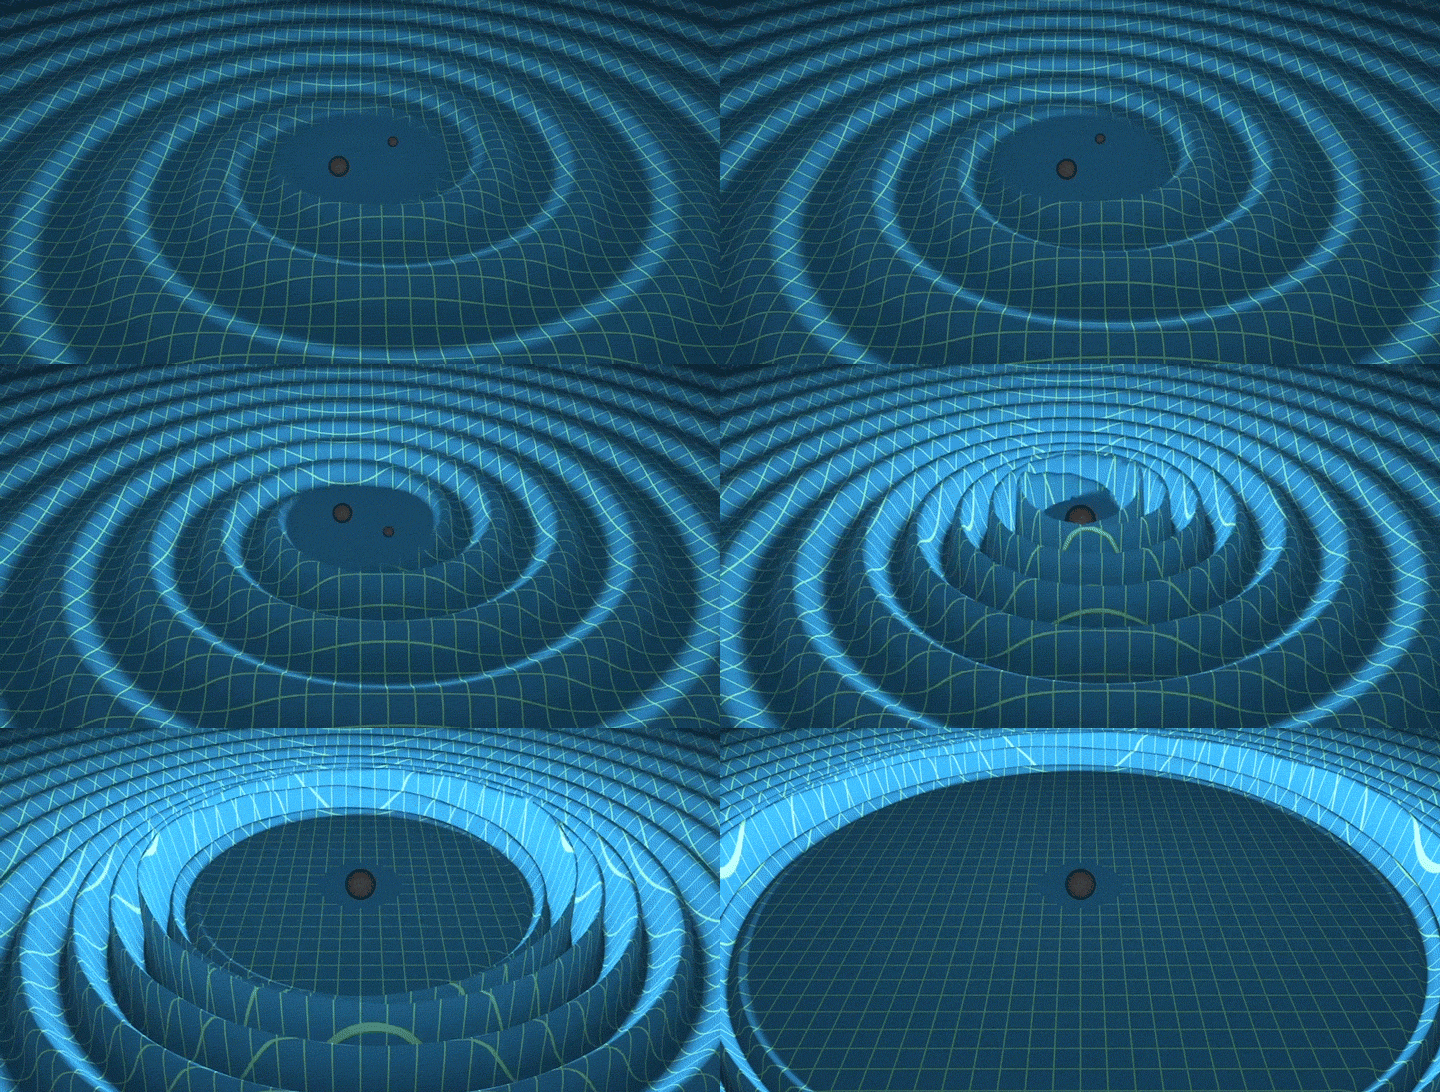
Einstein's general theory of relativity tells us that massive objects curve and distort spacetime. So as objects move through space, the curvature of spacetime changes as well to reflect the location of mass. This means that Objects accelerating quickly will create detectable ripples in spacetime, what we call gravitational waves.
 GIF source: LIGO/T. Pyle
The gravitational wave signal is incredibly weak, so to detect them an incredibly sensitive instrument is used. A gravitational wave will stretch and compress spacetime, so lasers are used to constantly measure a section of space. If a gravitational wave goes through the observatory, then the length of space will slightly change. This stretching and pulling is summarized in our dataset as a feature called "strain". This feature is a unitless quantity that encapsulates the change in length of the LIGO arms. To learn more about this, see the LIGO website.
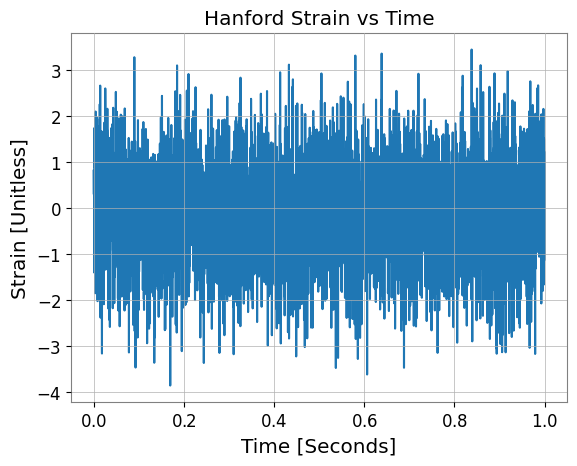
The dataset used in this project consisted of 8192 one-second segments of strain versus time data. Each second of data includes measurements from both LIGO detectors, one located in Hanford, Washington, and the other in Livingston, Louisiana. The dataset was labeled based on categories, with 2048 examples available for each category.Here is an example of the raw strain vs time data:
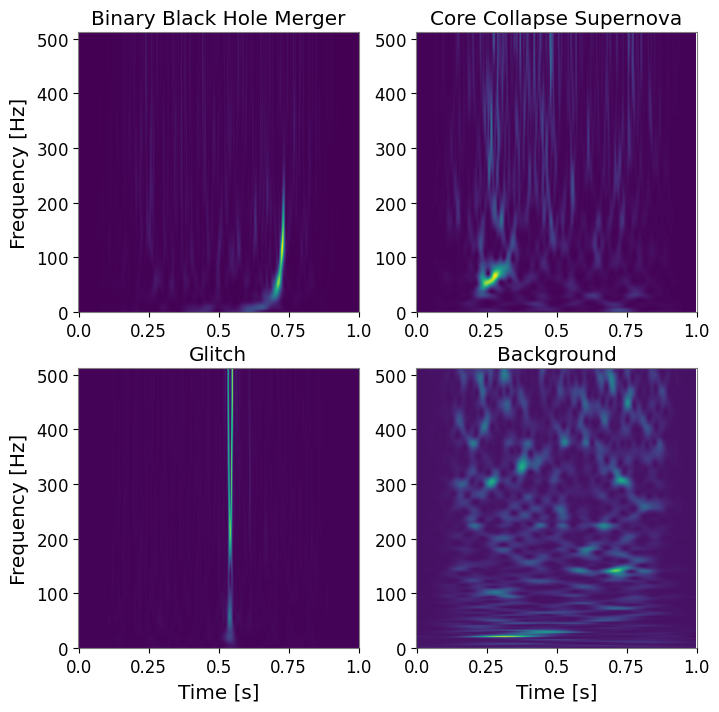
The data is very noisy and it is very difficult to see any distinct features. To prepare our data for the classifier, it is effective to represent in frequency vs time space in a spectrogram. The specific transformation used in this project was a Q-Transform. When a this transformation is done on each of the datapoints, some clear features appear:
It can be seen that the BBH signal appears as a chirp-like signal, the CCSN is a large signal localized in time, the glitch is an odd looking spike at a single instant, and the background has no disticnt features. Now that we have translated our raw data into images and want to classify them, applying a convolutional neural network seems appropriate.
Our model takes the spectrogram images and classifies them into one of four categories. In experimentation, it was found that using a series of binary classifiers was effective for this task. The "parent" classifier takes in a spectrogram image, and classifies is as signal (BBH or CCSN) or non-signal(Glitch or Background). The images classified as signal are then passed to the signal classifier, where they are classifies as BBH or CCSN. The same is then done with the non signals, but they are passed to their own classifier that assigns them as glitch or background.
Each classifier is a CNN with 7 layers consisting of a convolution, batch normalization, relu activation function, and max pool. As the data moves to the next layer the number of channels increases by a factor of two. Then at the end of the convolutional layers, three fully connected layers are used. The final layer outputs into two nodes which represent the two categories.
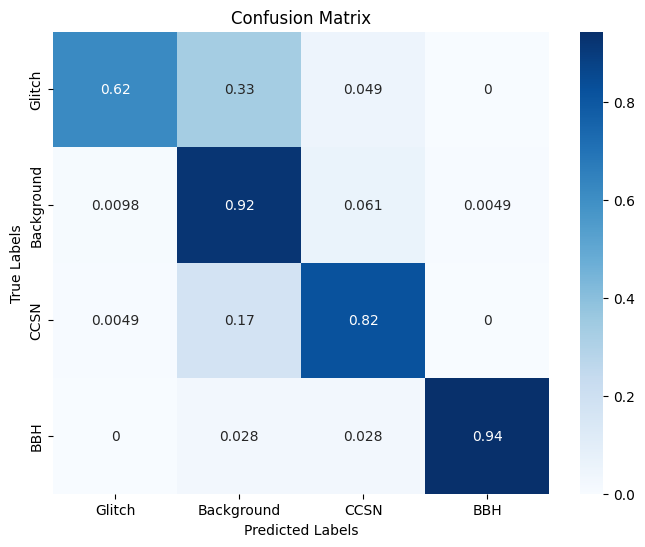
The performance of our model is summarized in this confusion matrix:
The model classifies the signals very effectively. The model does seem to overclassify images as background. This issue likely comes from not all glitches being the same, and the model not seeing enough examples of each type of glitch.
To recreate the results in our poster the following steps should be taken.
- Run the notebook titled "image_generation.ipynb" to create the spectrogram image dataset that will be fed into each classifier
- Run the notebook titled "GW_Parent_Classifier.ipynb" to train a classifier to sort images into Signals and non signals.
- Run both of the other Classifier notebooks to train each child network. "glitch_bg_classifier.ipynb" is trained to classify glitch and background examples, while "signal_classifier.ipynb" is trained to classify BBH vs CCSN
- Finally, run the "Model_Evaluation.ipynb" notebook to apply the test dataset on each of the three networks that were just trained.
One will need to obtain the raw data file "GW2_Andy.h5" to do this analysis. This file can be found at this Google Drive Link
One may wonder why each model is contained in a separate notebook file and not within one large script or notebook. This choice was made due to the development of this project being done in google colab. Due to memory limitations and issues with clearing GPU memory, it was necessary that each model be trained in a different notebook.
The code contained will need to have the specific file paths updated, but otherwise should run "as is".
- Jarov, S., Thiele, S., Soni, S., Ding, J., McIver, J., Ng, R., … Davis, D. (2024). A new method to distinguish gravitational-wave signals from detector noise transients with Gravity Spy. arXiv [Gr-Qc]. Retrieved from http://arxiv.org/abs/2307.15867
- Speri, L., Karnesis, N., Renzini, A.I. et al. A roadmap of gravitational wave data analysis. Nat Astron 6, 1356–1363 (2022). https://doi.org/10.1038/s41550-022-01849-y
- Gebhard, T. D., Kilbertus, N., Harry, I., & Schölkopf, B. (2019). Convolutional Neural Networks: A magic bullet for gravitational-wave detection? Physical Review D, 100(6). https://doi.org/10.1103/physrevd.100.063015
- Álvarez-López, S., Liyanage, A., Ding, J., Ng, R., & McIver, J. (2024). GSpyNetTree: A Signal-vs-glitch classifier for gravitational-wave event candidates. Classical and Quantum Gravity, 41(8), 085007. https://doi.org/10.1088/1361-6382/ad2194


