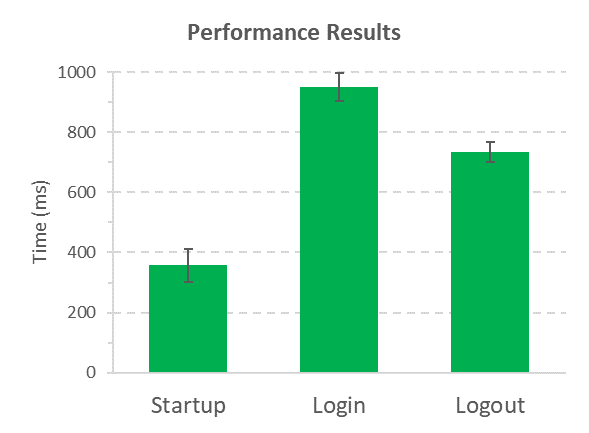
performance-total
Note:
For WebdriverIO v8 use version 3.x.x.
For WebdriverIO v7 use version 2.x.x.
For WebdriverIO v6 use version 1.x.x.
With this plugin for webdriver.io you can easily add performance analysis to any flow in your tests.
Installation
The easiest way to install this module as a (dev-)dependency is by using the following command:npm install wdio-performancetotal-service --save
Or:
npm install wdio-performancetotal-service --save-dev
Usage
Add wdio-performancetotal-service to your wdio.conf.js:
exports.config = {
  // ...
  services: ['performancetotal']
  // ...
};
...or with the service options:
exports.config = {
  // ...
  services: [
      ['performancetotal',
      // The options (with default values)
        {
            disableAppendToExistingFile: false,
            performanceResultsFileName: "performance-results",
            dropResultsFromFailedTest: false,
            performanceResultsDirectory: "performance-results",
            analyzeByBrowser: false
        }]
      ]
  // ...
};
Options
disableAppendToExistingFile
When set to true, new test runs or tests from another spec file will overwrite any existing performance data.
When set to false (default), performance data will be added to the existing data.
performanceResultsFileName
You can set the default results file name (performance-results).
A newly created results file normally overwrites the old file. If you want to keep old files, it is recommended to add a timestamp to the file name. For example:
...
performanceResultsFileName: `performance-results_${new Date().getTime()}`
...
dropResultsFromFailedTest
Default is false. When the value is set to true, performance analysis from failed tests would be excluded.
performanceResultsDirectory
You can override the default path for the results directory in the project's root dir. For example:...
performanceResultsFileName: "results-dir/performance-total-results"
...
analyzeByBrowser
Default is `false`. If true, the performance data would be grouped also by the browser type.Usage in test
Just import performancetotal where you need it, whether it be your test file or any other class:
import { performancetotal } from "wdio-performancetotal-service";

it("should test github startup performance", () => {
            // ...
            performancetotal.sampleStart("Startup");

            browser.url("https://github.com/");

            performancetotal.sampleEnd("Startup");
            //...
        });
It is possible to get the time span for a single sample inside a test:
it("should test github startup performance", () => {
            // ...
            performancetotal.sampleStart("Startup");

            browser.url("https://github.com/");

            performancetotal.sampleEnd("Startup");

            expect(performancetotal.getSampleTime("Startup")).to.be.at.most(1000);
        });
Getting the results
A new results directory (the default directory name is performance-results) is created in your project's root folder and when all the tests are completed two files are created inside it: performance-results.json and performance-results.csv. The analyzed data includes: average time, standard error of mean(sem), number of samples, min value, max value, earliest time and latest time.
Typescript support
Typescript is supported for this plugin.
