Metrics Dashboard is a project that implements microservices observability using the Prometheus-Grafana-Jaeger stack. This is a project for the Udacity's Cloud Native Application Architecture Nanodegree.
- Table of Contents
- Main steps
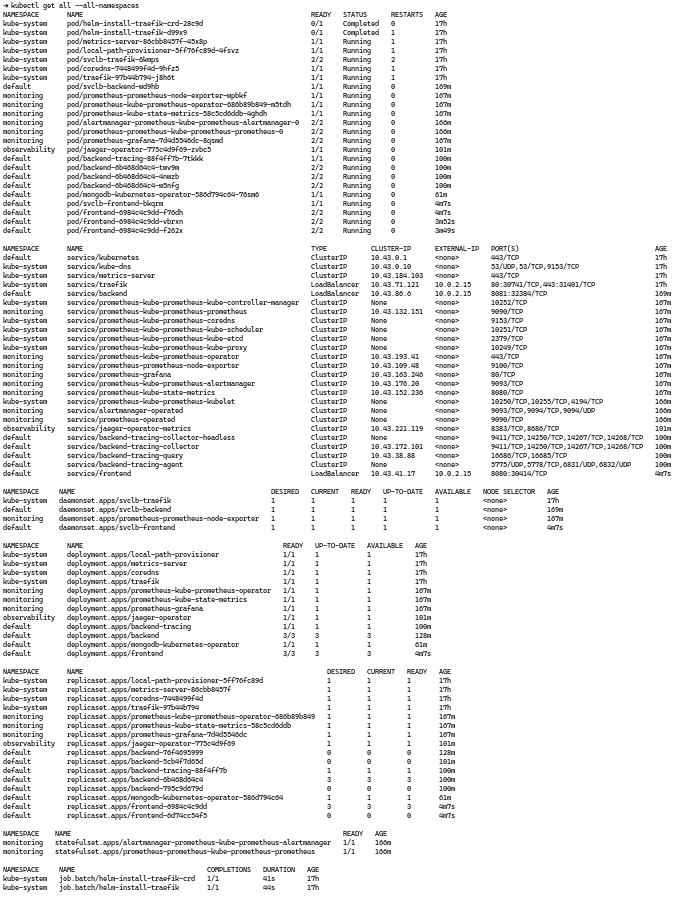
- Verify the monitoring installation
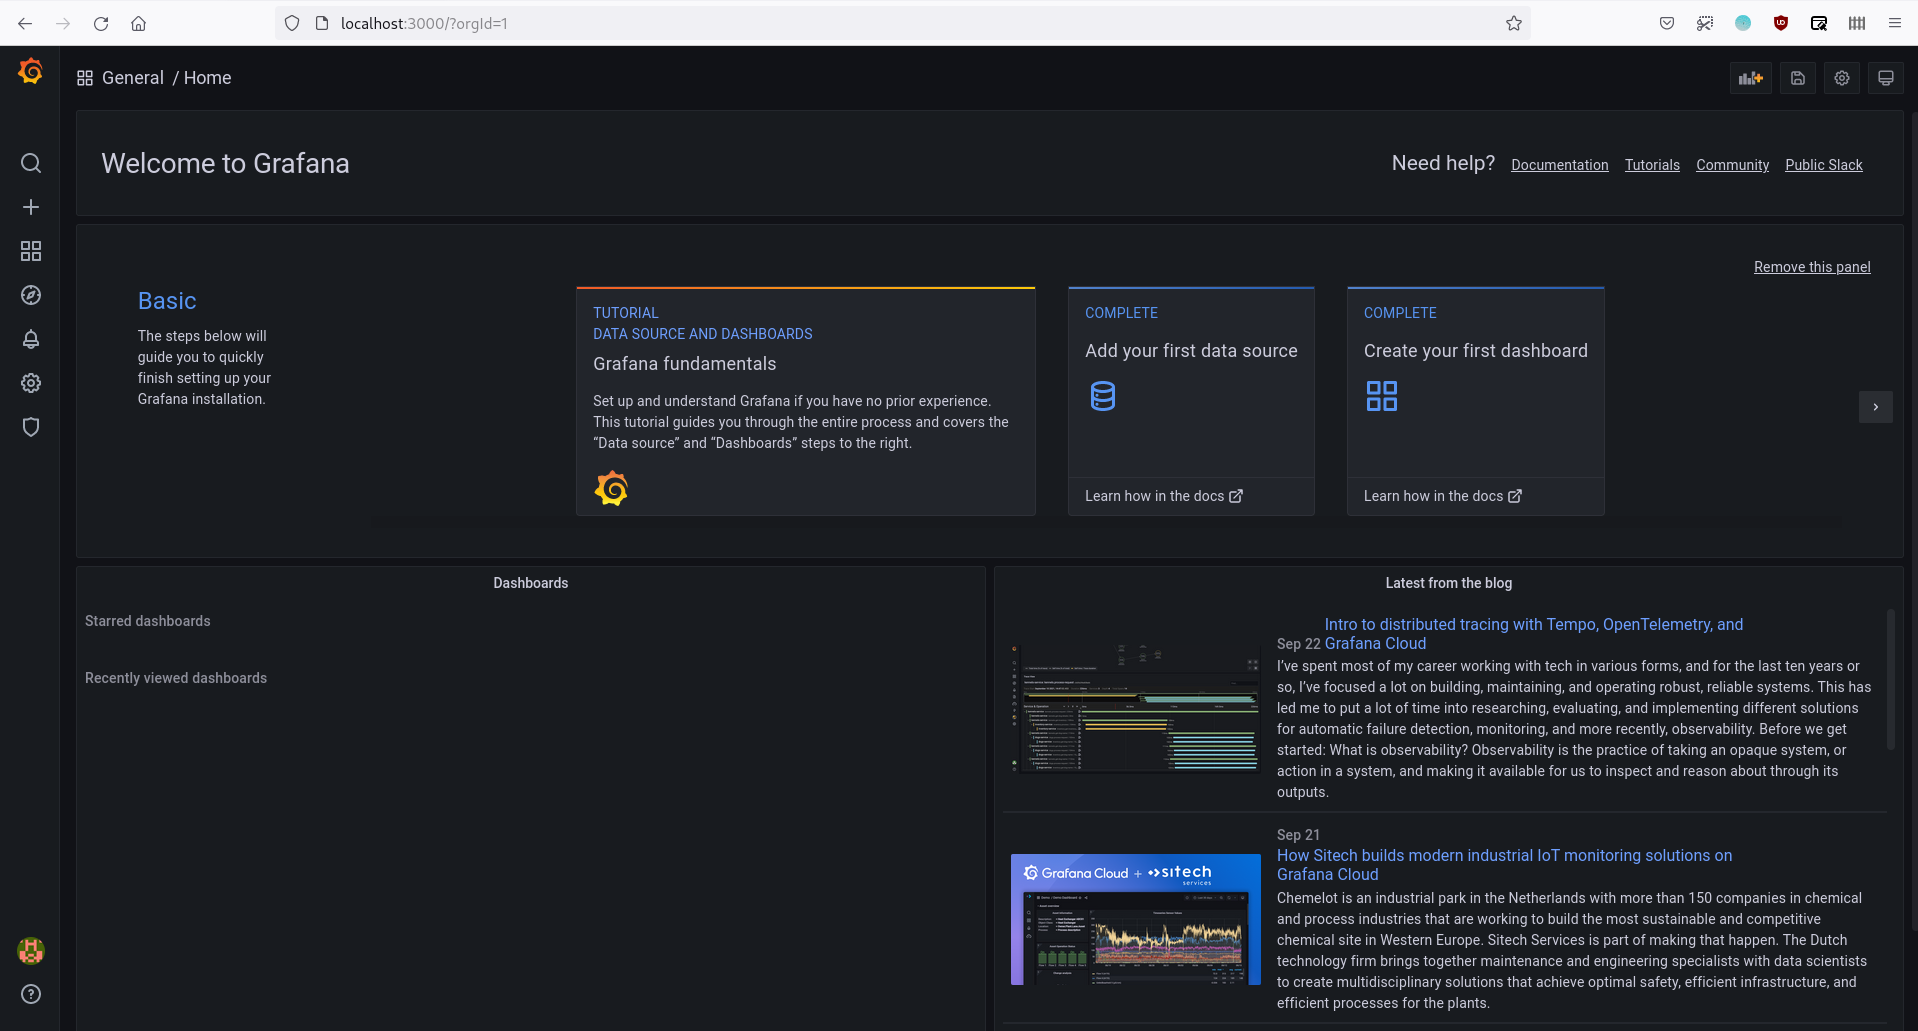
- Setup the Jaeger and Prometheus source
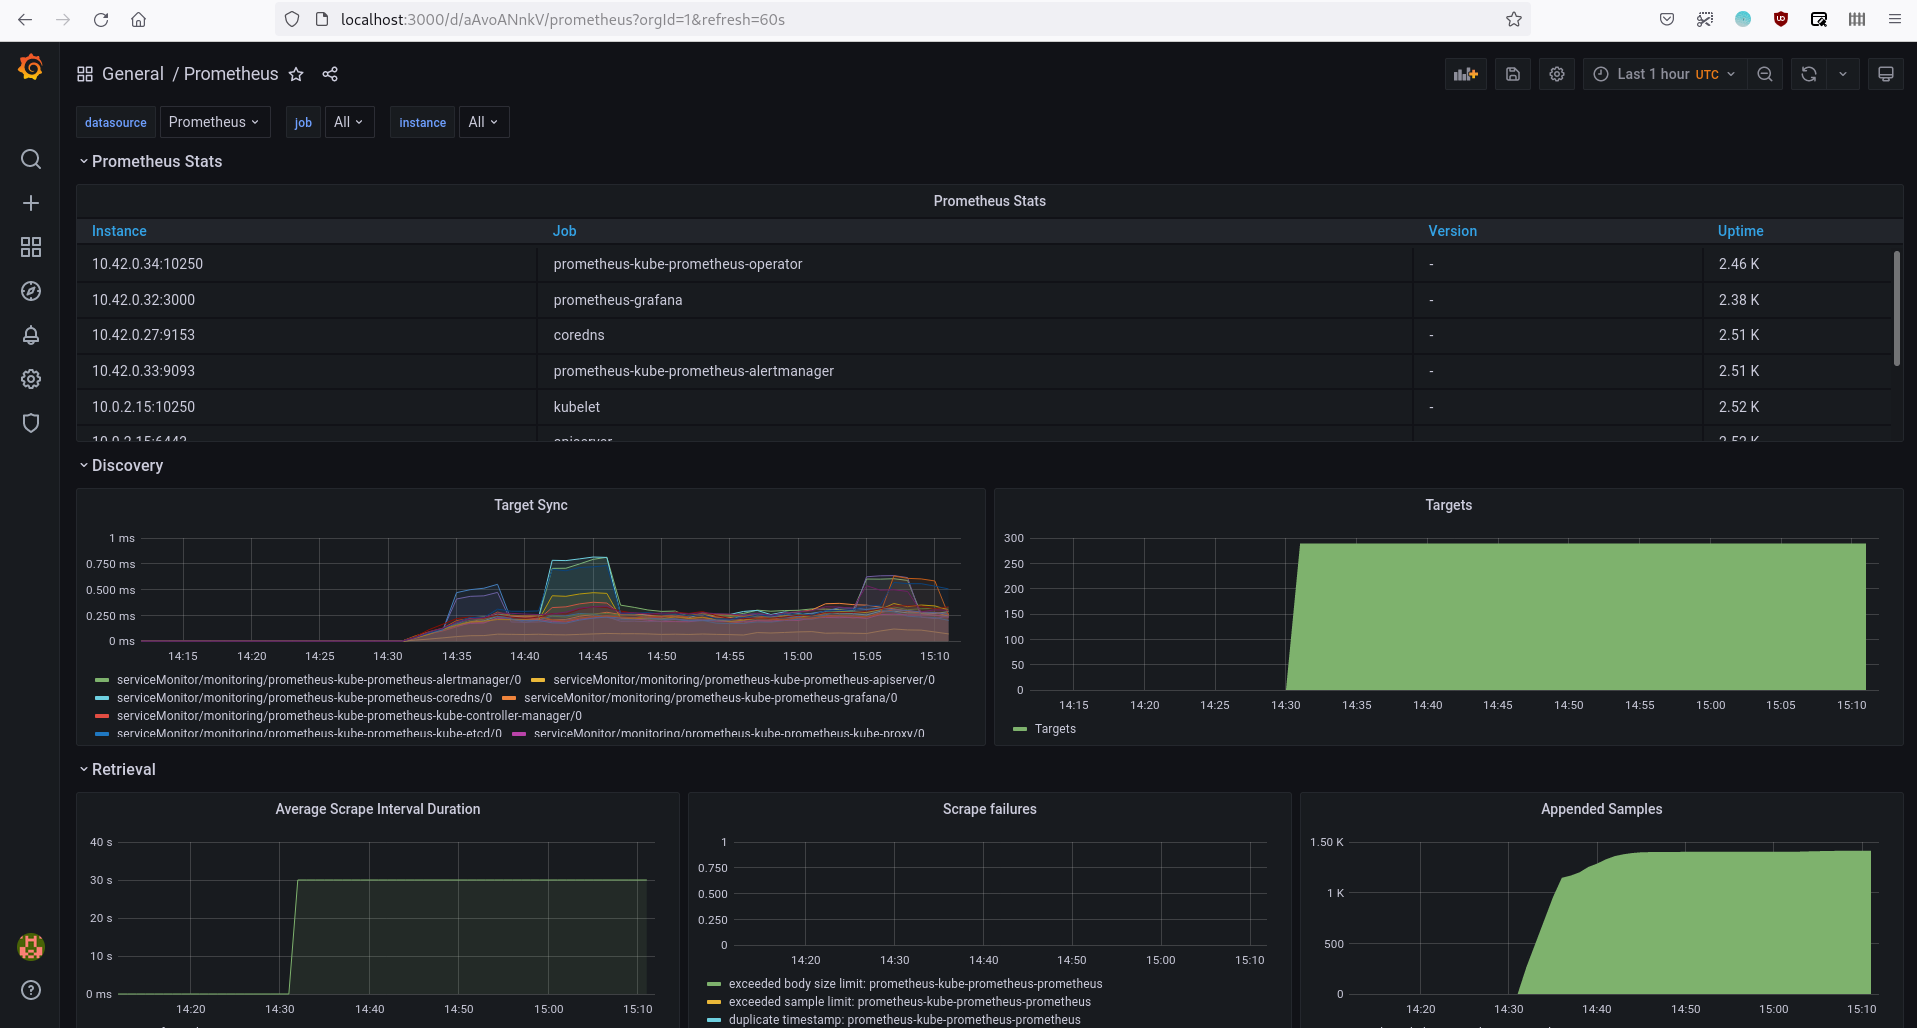
- Create a basic dashboard
- Describe SLO/SLI
- Creating SLI metrics
- Create a dashboard to measure our SLIs
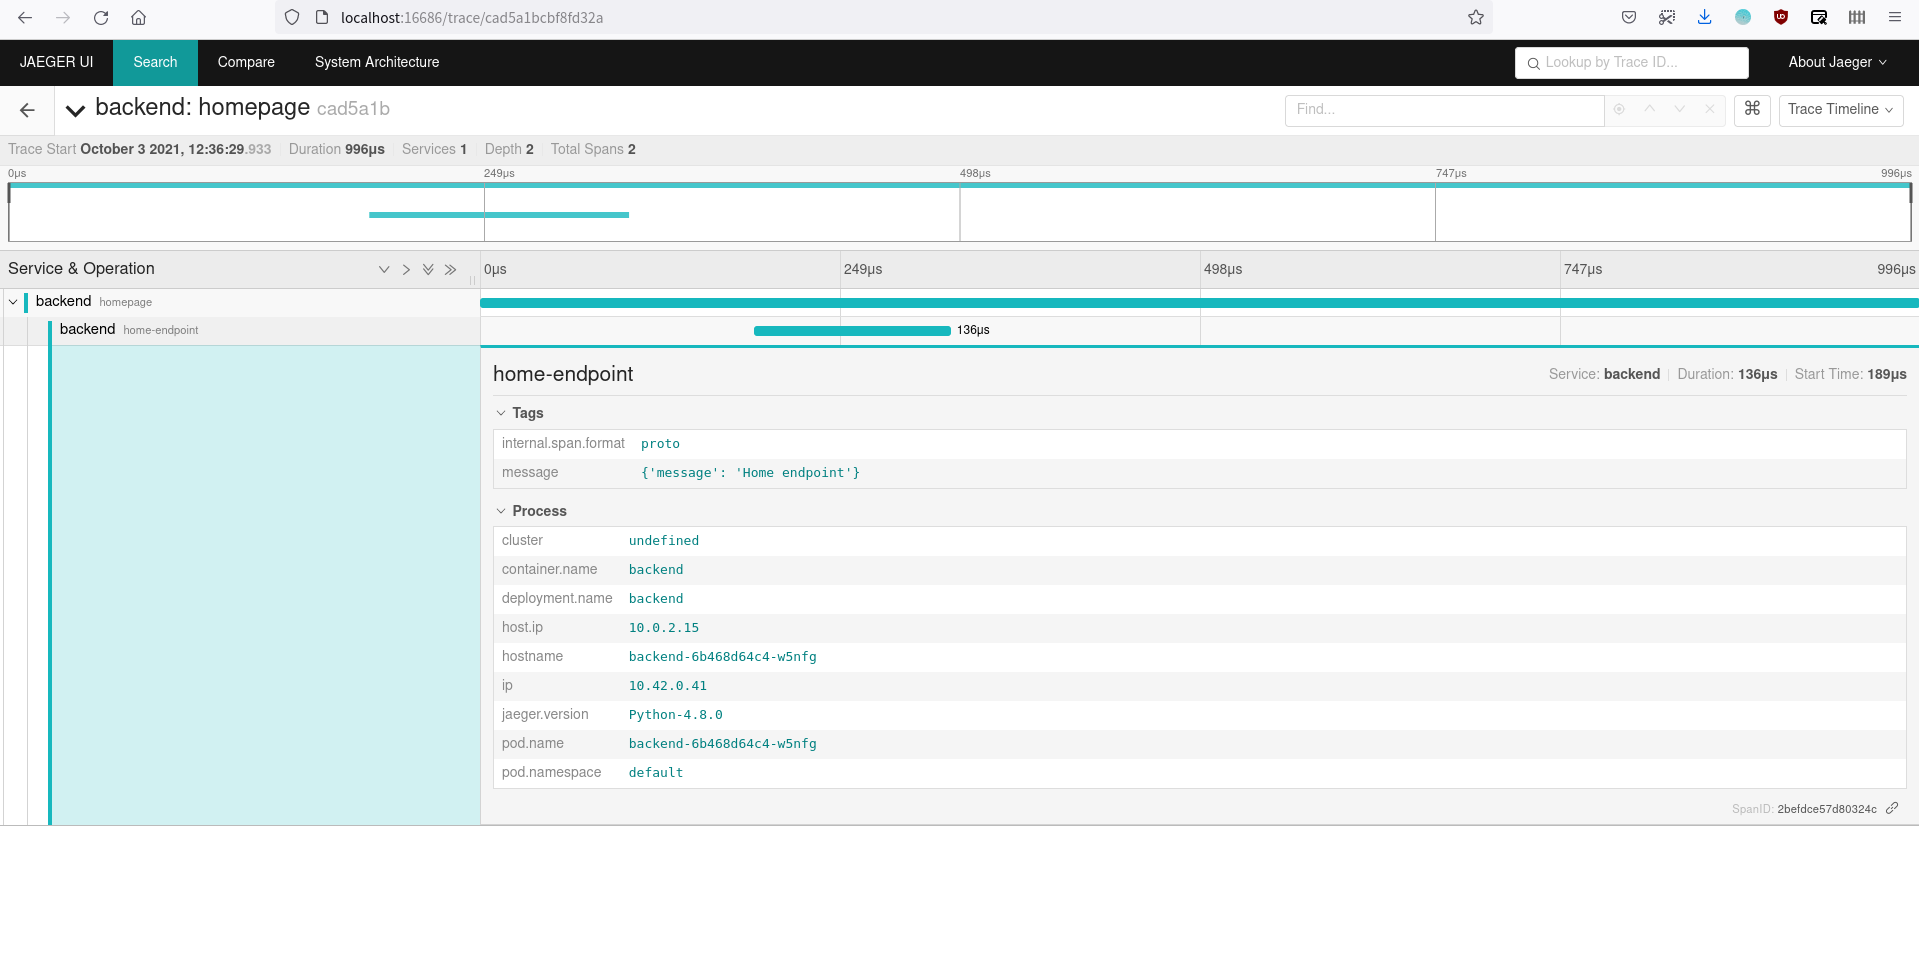
- Tracing our Flask app
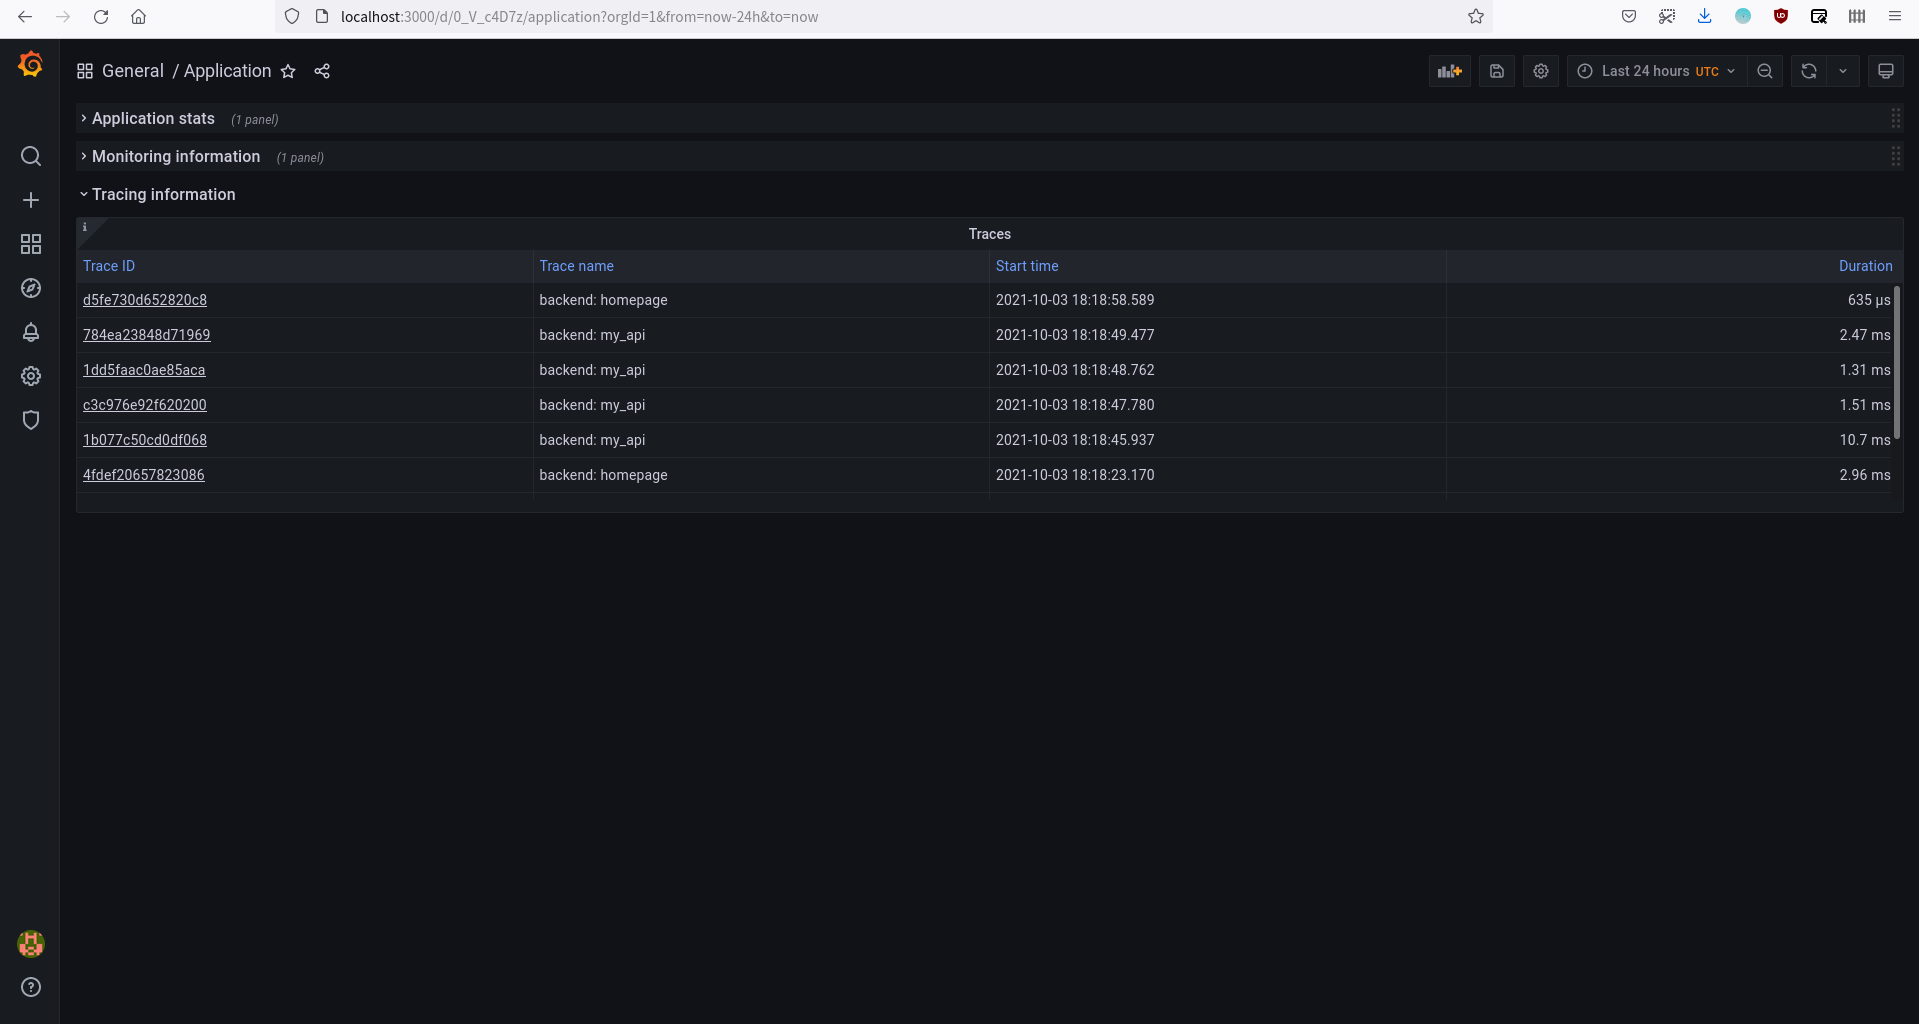
- Jaeger in dashboards
- Report error
- Creating SLIs and SLOs
- Building KPIs for our plan
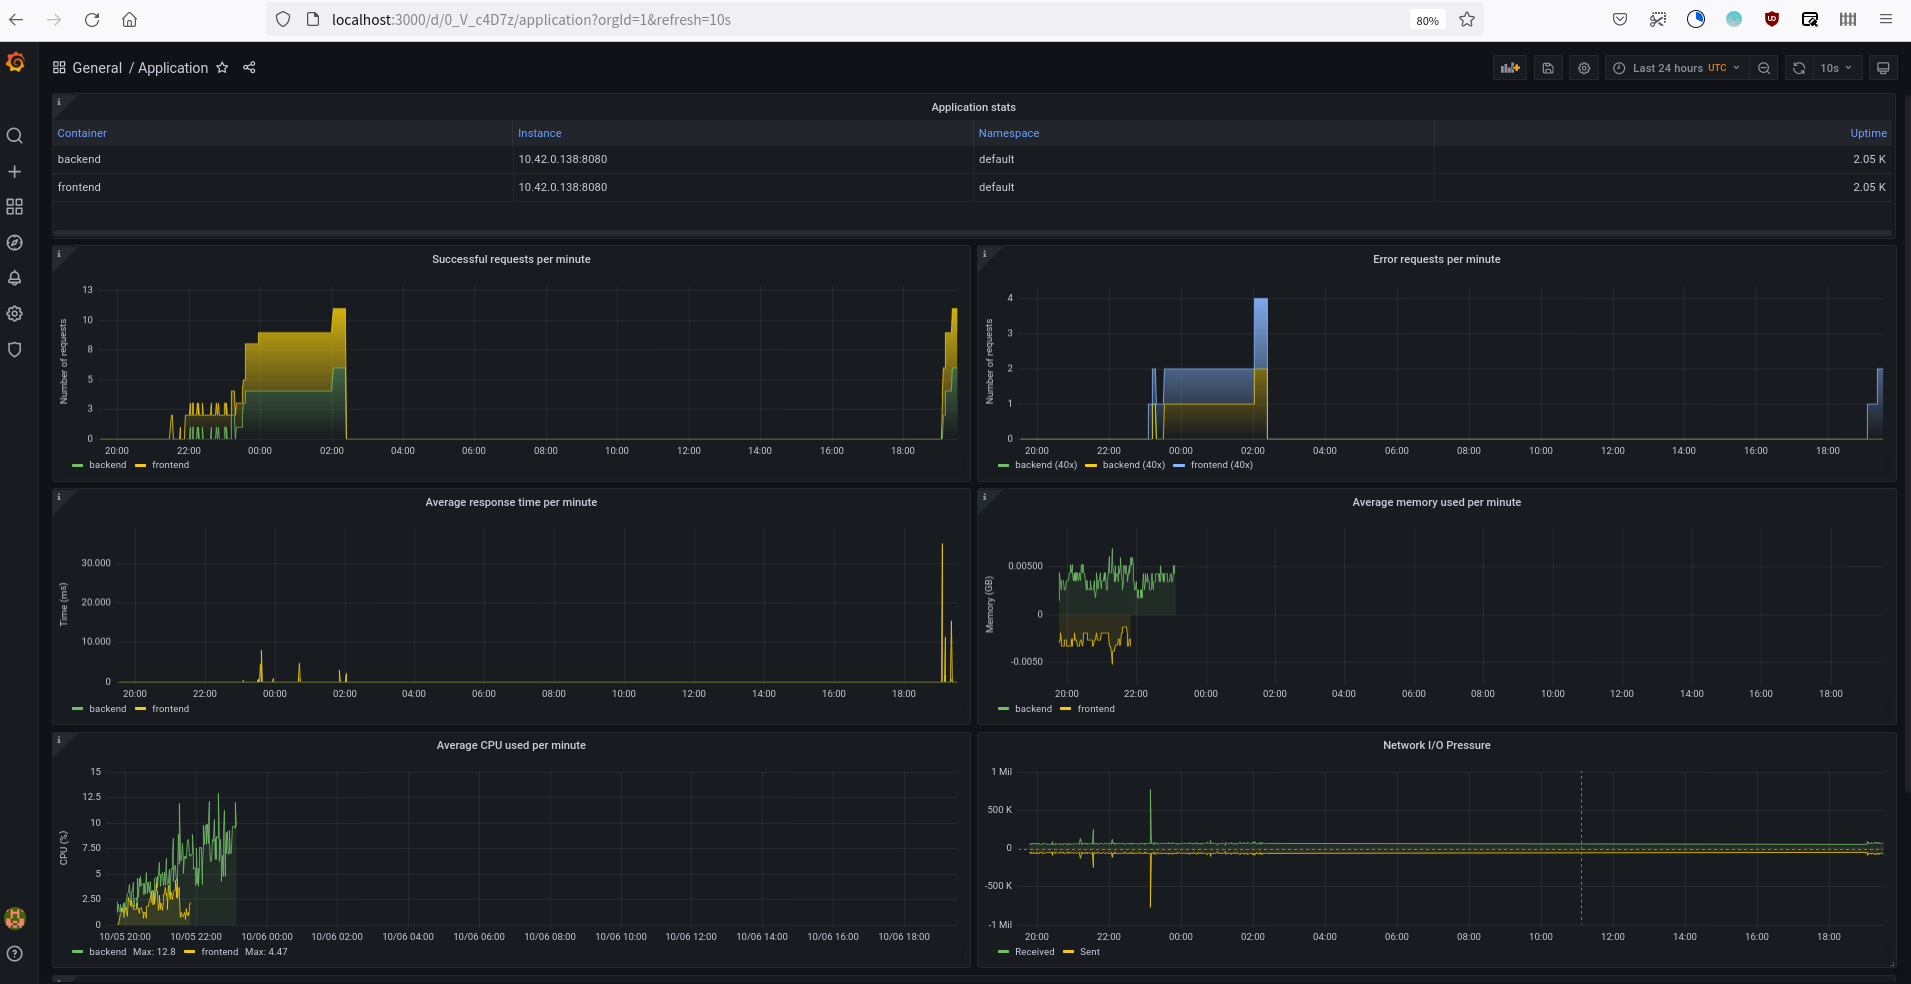
- Final dashboard
- Deploy a sample application in your Kubernetes cluster.
- Use Prometheus to monitor the various metrics of the application.
- Use Jaeger to perform traces on the application.
- Use Grafana in order to visualize these metrics in a series of graphs that can be shared with other members on your team.
- Document the project in a README.
Suppose that these are our SLOs for monthly uptime and request response time:
- 99.99% uptime in the year.
- 95% of requests completed in < 100 ms.
We can describe SLIs as:
- We got 99.98% uptime in the current year.
- 94% of the requests were completed in < 100 ms.
- Number of error responses in a period of time - This metric could help us to identify possible bootlenecks and bugs.
- The average time taken to return a response - This metric could help us to identify opportunities to tune our services performance.
- The average time taken recover a service if it goes down - This metric could help us to measure our capacity to recover possible failovers.
- Total uptime in a period of time - This metric could help us to measure the health of our services.
- Average percentage of memory or CPU used by a service in a period of time - This metric could help us to measure the impact of our services in the costs of maintaining a system and look for efficient services.
**TROUBLE TICKET**

**Name**: Franky River
**Date**: 09/27/2021 5:15:10 PM
**Subject**: Front-end service is creating many 40x and 50x errors
**Affected Area**: API requests
**Severity**: High

**Description**:
The `static/js/click.js` file is not handling clicks correctly and requests can not be processed because the
fetch url are not right.SLIs:
- We got less than 10 error responses in the last 24 hours.
- We got an average response time of < 2000ms per minute.
- We got 75% more successful responses than errors.
- 99% of our responses had the right data format.
SLO:
- 99.9% uptime per month.
- 99.9% of responses to our front-service will return 2xx, 3xx or 4xx HTTP code within 2000 ms.
- 99.99% of transaction requests will succeed over any calendar month.
- 99.9% of backend service requests will succeed on their first attempt.
- We got less than 10 error responses in the last 24 hours.
- Successful requests per minute: this KPI indicates how well is performed our system.
- Error requests per minute: this KPI is an analogous of this SLI.
- Uptime - this KPI indicates if errors are comming from downtime or not.
- We got an average response time of < 2000ms in the las 24 hours.
- Average response time: this KPI is an analogous of this SLI.
- Uptime - this KPI will help us to determine if response time is affected by downtime of a service.
- We got 75% more successful responses than errors.
- Successful requests per minute: this KPI indicates the number of successful request.
- Error requests per minute: this KPI indicates the number of error requests.
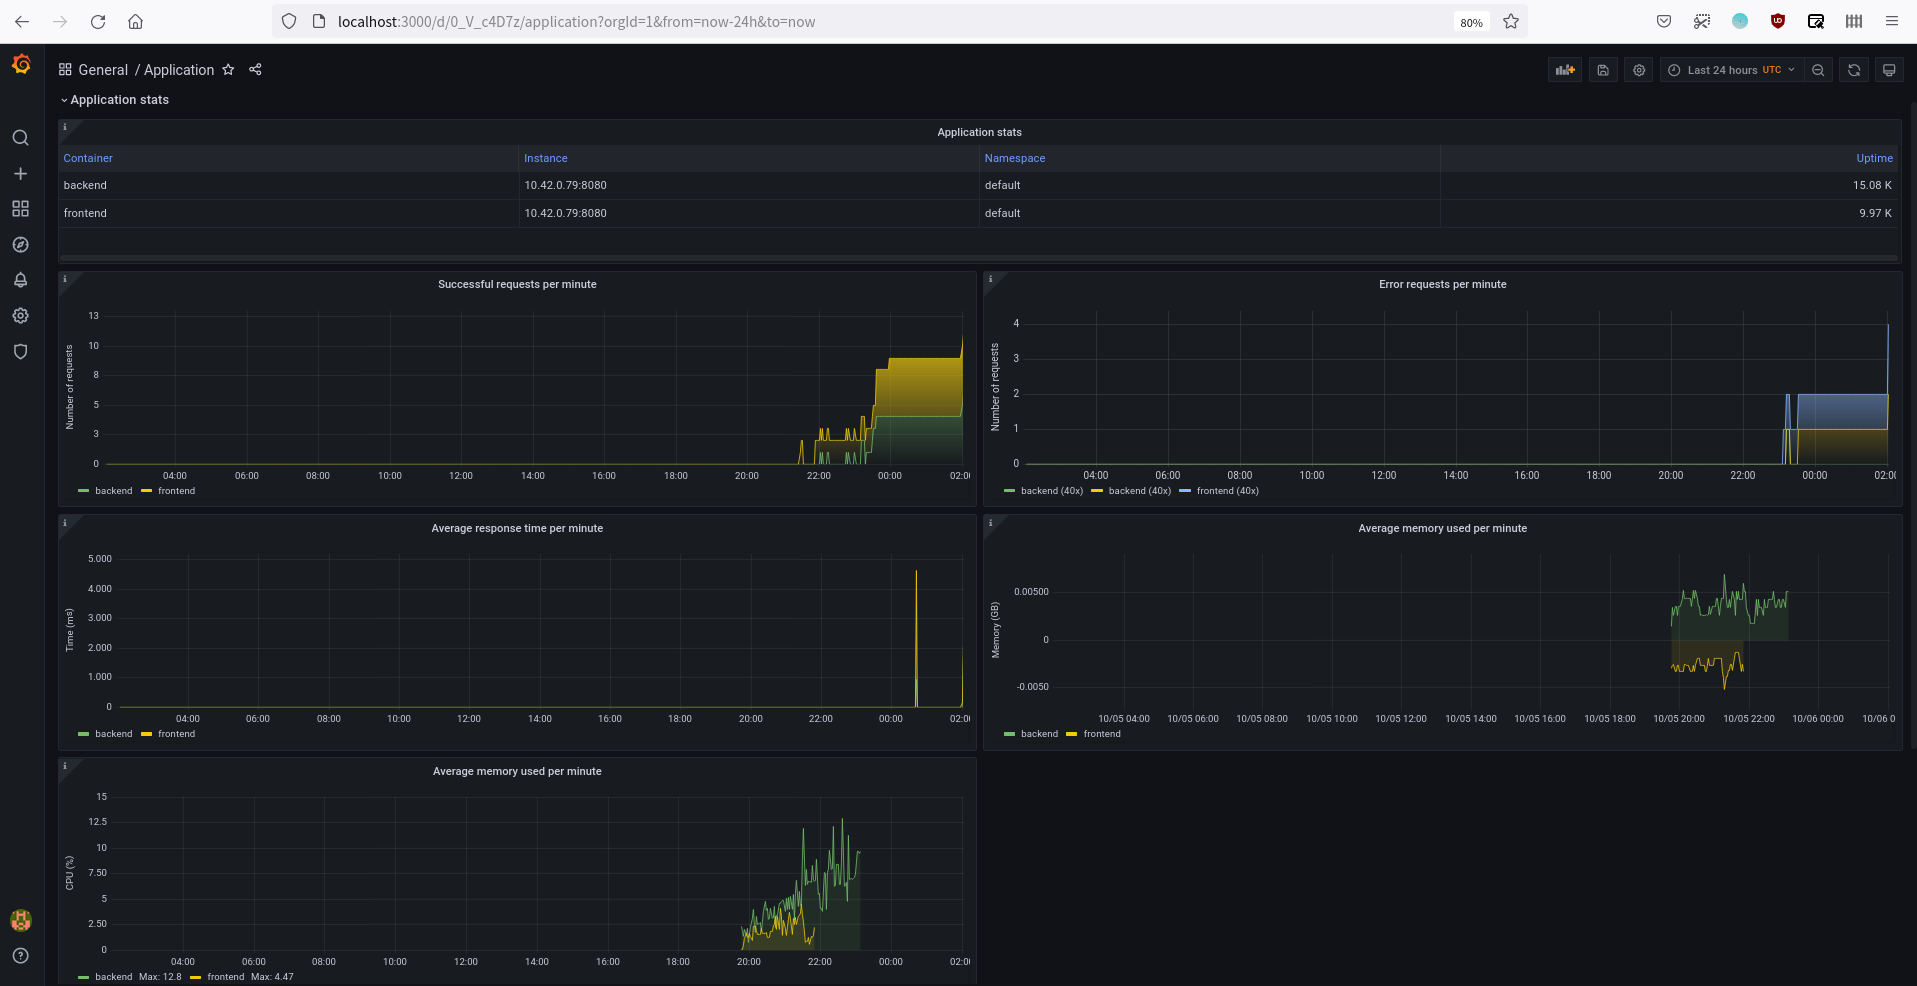
- Application stats panel - This panel shows information about the application services.
- Successful requests per minute - This panel shows the total number of successful requests per service.
- Error requests per minute - This panel shows the total number of 40x and 50x error requests per service.
- Average response time per minute - This panel shows the average response time successful requests (status 200) per service.
- Average memory used per minute - This panel shows the average memory used by each service.
- Average CPU used per minute - This panel shows the average CPU used by each service.
- Network I/O Pressure - This panel shows the amount of I/O operations per minute in the node.
