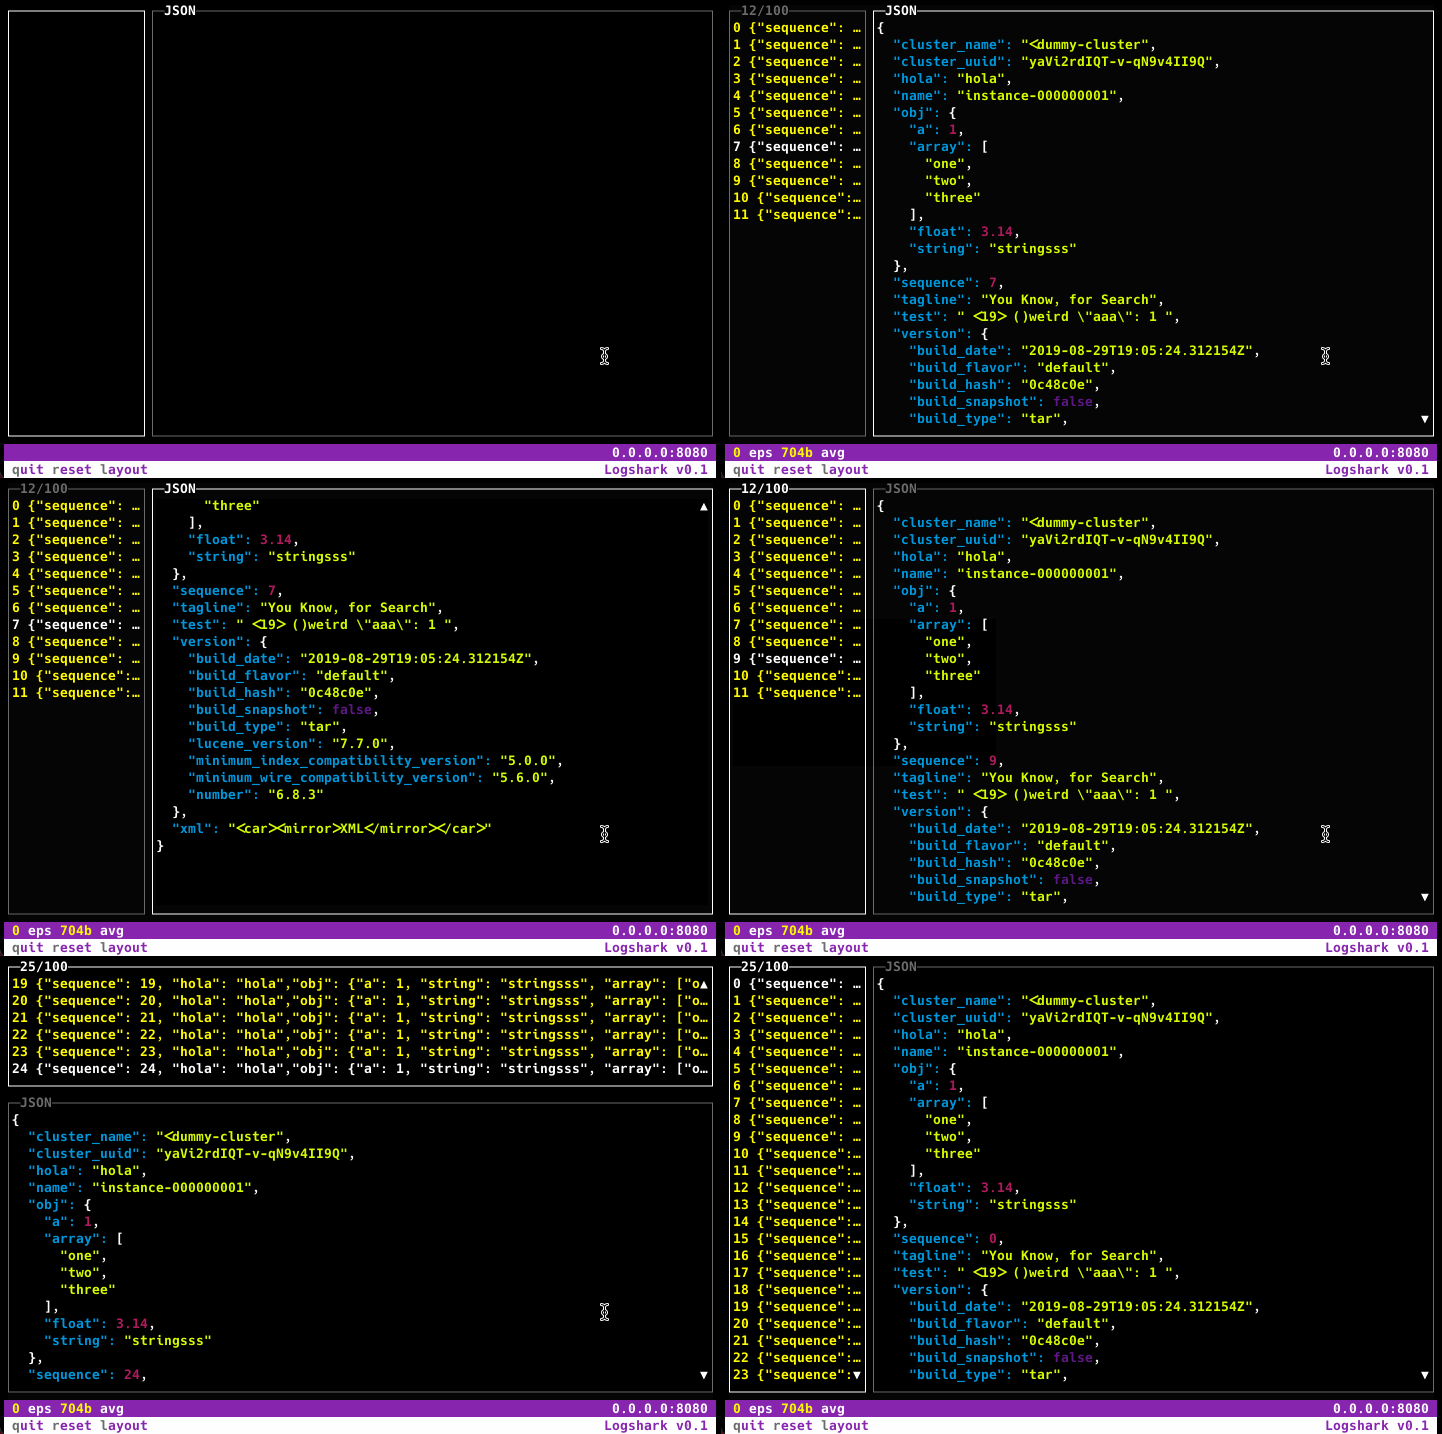
Logshark is a debugger for JSON logs.
Logshark works by listening for logs on an HTTP port, it mimicks the Elasticsearch protocol so as to receive data from Beats (Filebeat, Metricbeat, Heartbeat, etc.) and Logstash using the standard elasticsearch output.
Features:
- Terminal UI
- Navigable list of logs
- Highlightable, pretty printed JSON
- 🎨 Colorful
- Beats/Logstash integration
- Stats such as Events per second and Average size in bytes per event - useful for calculating bulk/batch size
Releases here
./logshark --host 0.0.0.0 --port 9200 --max 1000docker run -p 9200:9200 -it ugosan/logshark -host 0.0.0.0 -port 9200You can reach the logshark container from another container using host.docker.internal like docker run --rm byrnedo/alpine-curl -v -XPOST -d '{"hello":"test"}' http://host.docker.internal:9200
docker-compose run -p 9200:9200 logshark -port 9200
version: "3.2"
services:

  #note you should not use "docker-compose up" but instead "docker-compose run logshark sh" since docker-compose doesnt attach to containers with "up". e.g. docker-compose run -p 9200:9200 logshark -port 9200
  logshark:
    image: ugosan/logshark
    tty: true
stdin_open: trueJust like a normal elasticsearch output:
input {}

filter {}

output {
  elasticsearch {
    hosts => ["http://host.docker.internal:9200"]
  }

} 