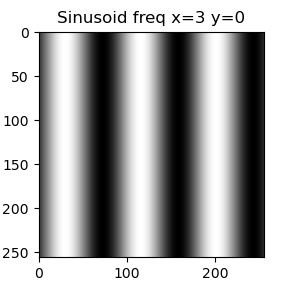
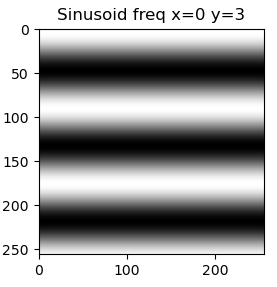
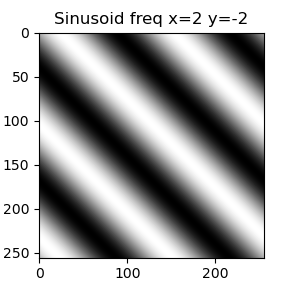
This project visualises how a two-dimensional discrete Fourier transform works on images. It shows how an image can be decomposed and reconstructed using superposition of two-dimensional sinusoids and how these sinusoids relate to the resulting frequency spectrum.
This project can help improve your intuition on the way a two-dimensional FFT works, illustrate what a 2D FFT even means, and how you can interpret the amplitude spectrum.
This app was written in Python using numpy for computation, OpenCV for reading images and matplotlib for visualisation. It was tested with Python 3.9 on MacOS and a project file has been generated so that the installation of all needed packages can be done with
# to create a virtual environment use
python -m venv .venv

# then activate the environment
# For Windows use
.venv\Scripts\Activate.ps1
# For Linux and Mac OS
source .venv/bin/activate

# install all needed modules with
pip install .
The whole application is implemented in one file app.py. At the top of the app.py file there are multiple constants that you can change in order to customise the visualisation.
To select the input image, edit the INPUT_IMAGE_PATH variable. The target image should ideally be square, otherwise it will be distorted when resizing to the desired resolution (IMAGE_SIZE).
After setting the input path you can simply execute the app. By pressing the space key or the right arrow key it advances to the next step, adding another sinusoid to the image. By clicking somewhere on the FFT image, you can select a specific frequency that is illustrated below.
Tip: For larger images it can be helpful to zoom into a smaller area of the FFT spectrum using the Zoom to rectangle tool in the toolbar in the bottom of the app.
Tip: By holding the space bar or the right arrow key down, the app will automatically advance through the animation of adding sinusoids.
For the one-dimensional case a signal can be represented as a sum of sine waves of different frequencies, amplitudes and phases.
The same underlying idea is also true for a two-dimensional Fourier transform: It represents the 2D signal, i.e. the image, as a sum of 2D sinusoids. These too have amplitude, frequency and phase. However, unlike a simple sine wave, the 2D sinusoids have 2 frequency components: one in the x-direction and one in the y-direction. A combination of these two essentially results in a rotation of the sinusoid, therefore allowing for diagonal "waves".
 |
 |
 |
|---|
By overlapping many 2D sinusoids, as visualised in the app, you finally receive the original image. To know which amplitude and phase is required for each sinusoidal component, you can compute the FFT of the image. The resulting amplitude spectrum is shown in the top right corner of the app. Although phase information is essential, this app chooses to only show the amplitude spectrum to help build an intuitive foundation.
This app has been developed by GitHub user inspiaaa and only extended for interactive choice of frequencies by me (Uwe Hahne). I also changed the code to use PyQt5 as aggregator for matplotlib.

