Export Tesla vehicle metrics to Prometheus.
To get started, generate the OAuth 2.0 credentials. Container images are pushed to the GitHub container registry, and tagged by release version. See the latest release.
The OAuth 2.0 config and token must be provided, which can be configured with
--oauth2-config-path and --oauth-token-path.
docker run \
  -v "$(pwd)/oauth2_config.json":/etc/secret/oauth2_config.json \
  -v "$(pwd)/oauth2_token.json":/etc/secret/oauth2_token.json \
  ghcr.io/uhthomas/tesla_exporter \
  --oauth2-config-path=/etc/secret/oauth2_config.json \
--oauth2-token-path=/etc/secret/oauth2_token.jsonClone uhthomas/tesla and login with the cmd/login tool.
git clone git@github.com:uhthomas/tesla
cd "$(basename \"$_\")"
bazel run //cmd/login -- --username=hello@tesla.com --passcode=123456
The tool will ask for a password and print the JSON encoded
oauth2 config and
oauth2 token upon successful
authentication. Save the oauth2 config and token to new files named
oauth_config.json and oauth2_token.json respectively.
All metrics are labelled using the car's VIN. These are currently non-exhaustive, as many more are planned to be added.
| Metric | API reference |
|---|---|
| tesla_vehicle_info | id, vehicle_id |
| tesla_vehicle_name | display_name |
| tesla_vehicle_state | state |
| tesla_vehicle_software_version | vehicle_state.car_version |
| tesla_vehicle_odometer_miles_total | vehicle_state.odometer |
| tesla_vehicle_inside_temp_celsius | climate_state.inside_temp |
| tesla_vehicle_outside_temp_celsius | climate_state.outside_temp |
| tesla_vehicle_battery_ratio | charge_state.battery_level |
| tesla_vehicle_battery_usable_ratio | charge_state.usable_battery_level |
| tesla_vehicle_battery_ideal_miles | charge_state.battery_range |
| tesla_vehicle_battery_estimated_miles | charge_state.est_battery_range |
| tesla_vehicle_charge_volts | charge_state.charger_voltage |
| tesla_vehicle_charge_amps | charge_state.charger_actual_current |
| tesla_vehicle_charge_amps_available | charge_state.charger_pilot_current |
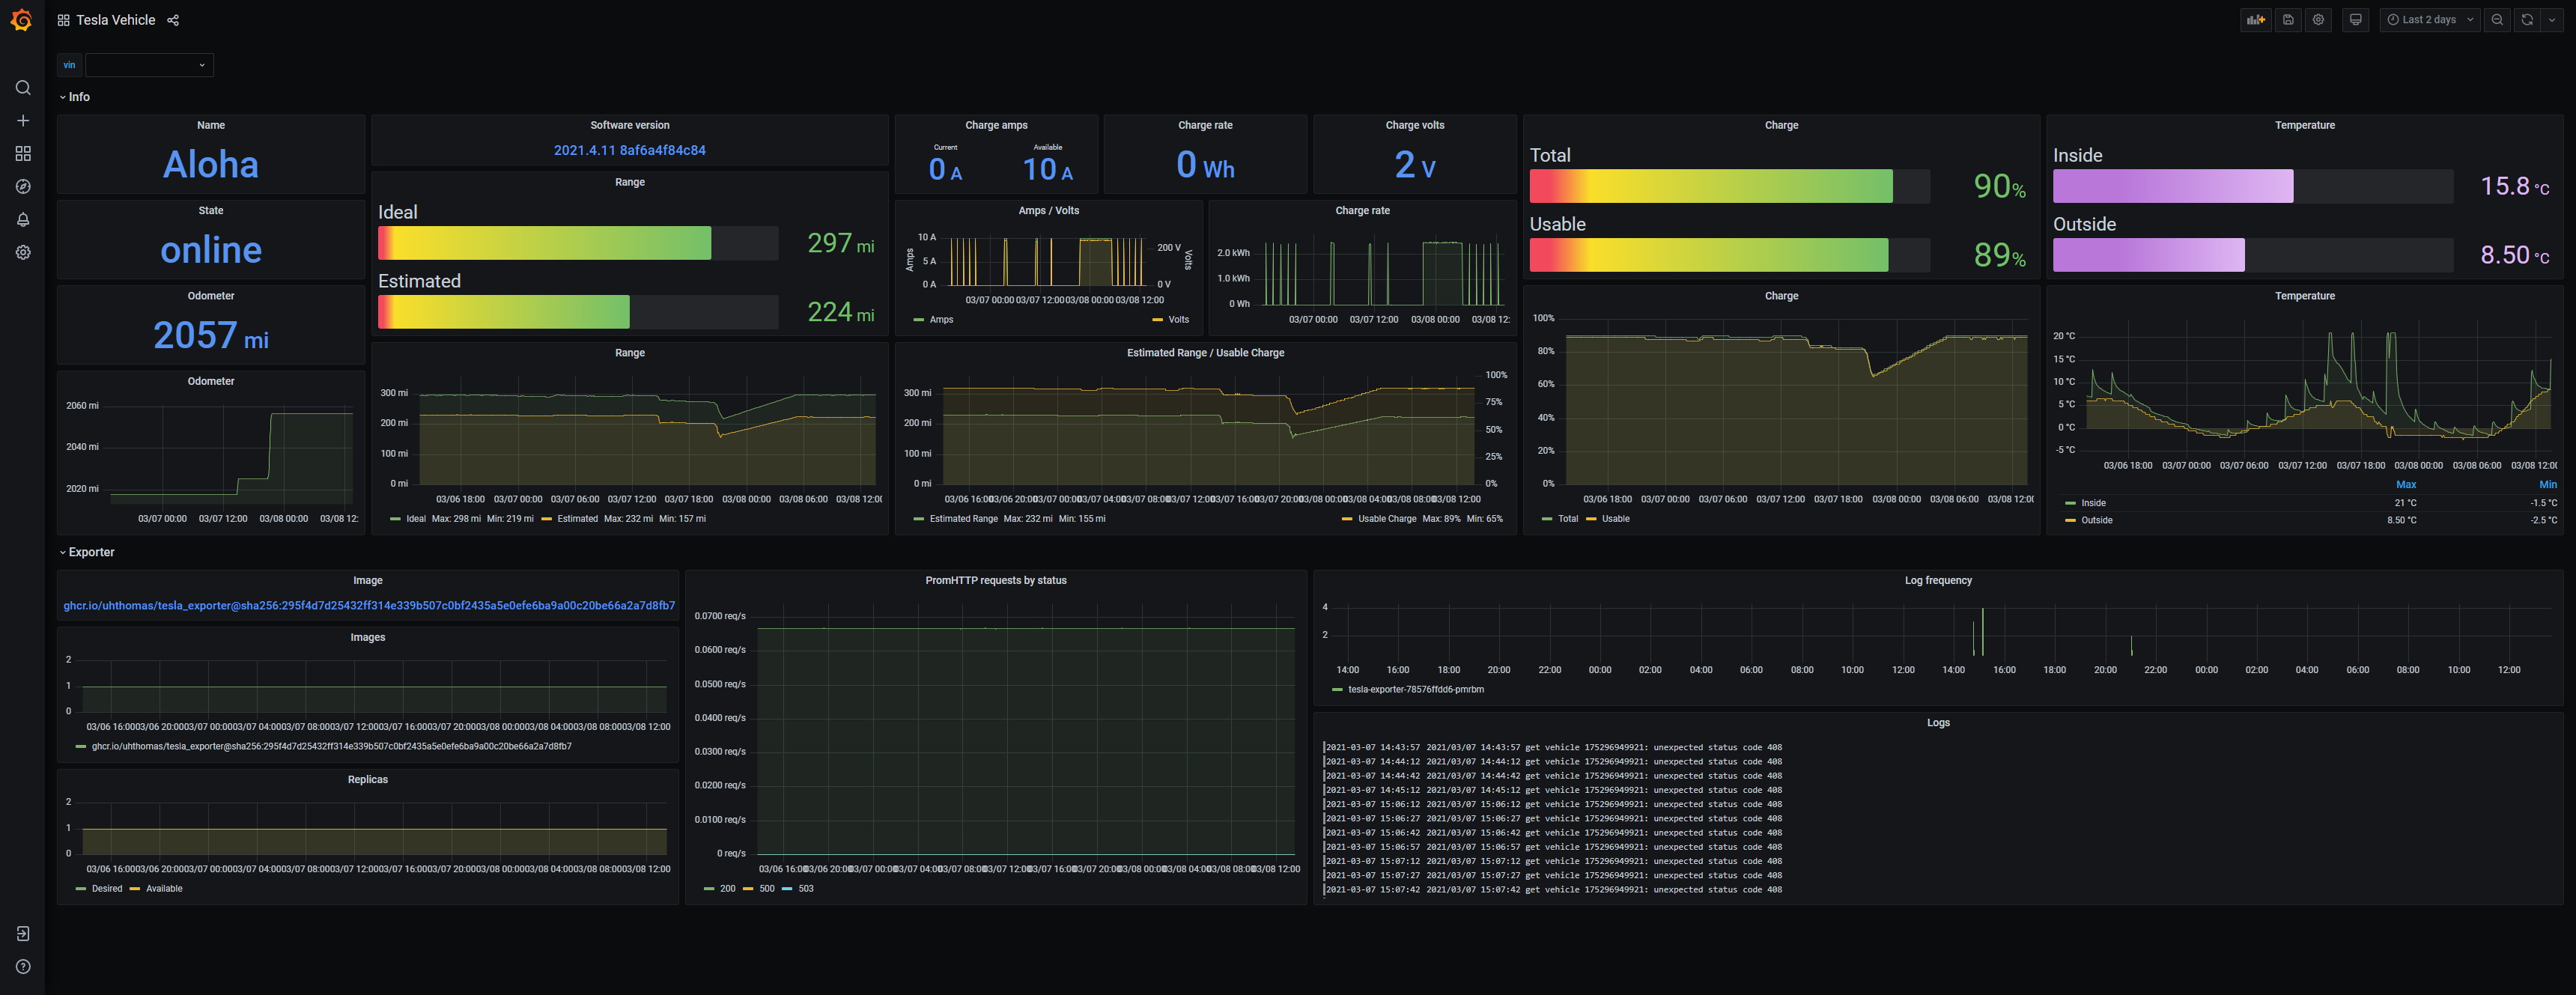
The metrics collected by Prometheus can be visualized through Grafana, and can look something like the following.
