- What is WhaleWatch?
- WhaleWatch Features
- Installation and Setup
- Navigating and Using WhaleWatch
- Meet the Team
WhaleWatch is a lightweight, open-source monitoring tool for Docker. WhaleWatch enables developers to monitor Docker containers through a dashboard that delivers real-time metrics backed by intuitive data visualizations. Developers will be able to keep an eye on the containers that are critical for smooth technical and business operations and also proactively take action before troubles arise.
- The ability to collect and display Docker metrics
- Monitor containers and identify trends through data visualizations
- Connect to Docker Daemon
- Drag and drop functionality to stop, start, and restart containers
WhaleWatch can be installed and set up with the following steps:
- Fork and clone the repo
- Run
npm install - Create a
.envfile in your top level folder and add a Postgres URI as a variable labeledDB_URI - Run the following command in your Postgres instance:
CREATE TABLE IF NOT EXISTS users (
  id SERIAL PRIMARY KEY,
  username varchar(50) UNIQUE NOT NULL,
  email varchar(100) UNIQUE NOT NULL,
  password varchar(100) NOT NULL
);

CREATE TABLE IF NOT EXISTS containers (
  id SERIAL PRIMARY KEY,
  dockerId varchar(100) NOT NULL,
  name varchar(100) NOT NULL,
  size varchar(50),
  status varchar(50),
  state varchar(50),
  owner integer REFERENCES users(id) NOT NULL
);

CREATE TABLE IF NOT EXISTS stats (
  id SERIAL PRIMARY KEY,
  container integer REFERENCES containers(id) NOT NULL,
  timestamp date NOT NULL,
  cpuUsage decimal NOT NULL,
  memUsage decimal NOT NULL,
  netIo varchar(50) NOT NULL,
  blockIo varchar(50) NOT NULL,
  pids integer NOT NULL,
  reqPerMin integer
)
- Ensure Docker Daemon is running on your computer.
- Run
npm run dev
WhaleWatch is a tool that developers will be able to utilize through their browsers as a web application.
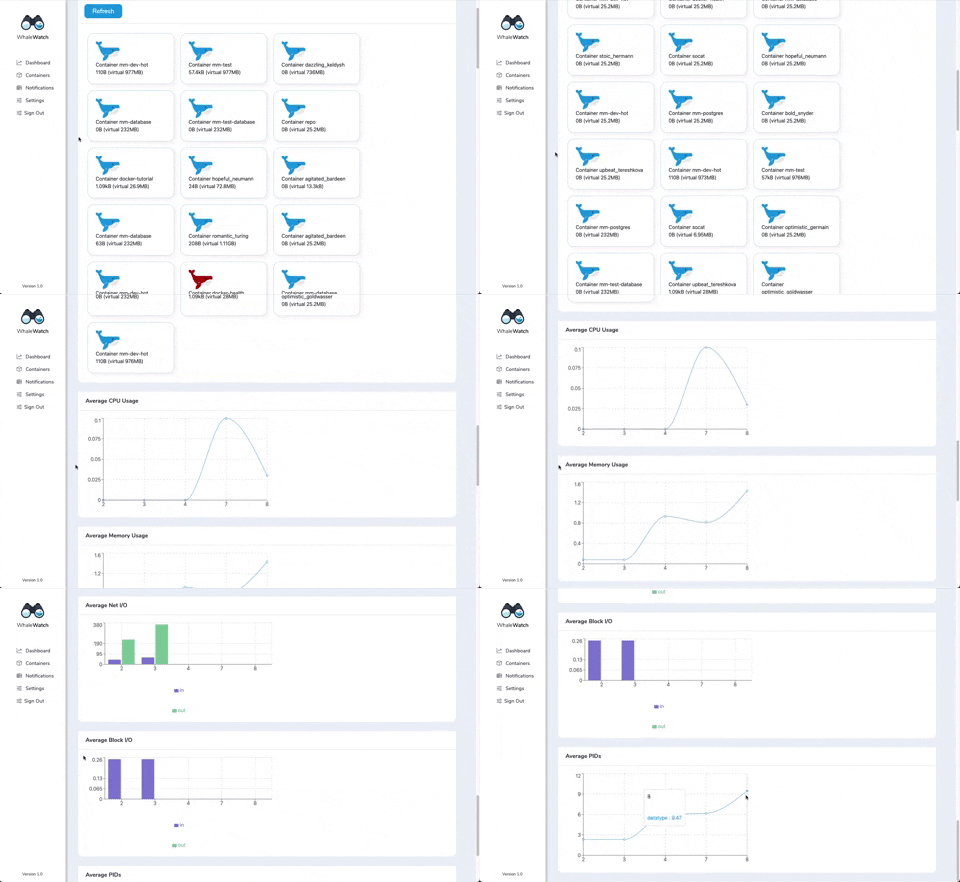
Upon launching the application, the user will be asked to sign up or provide login credentials. Once the sign-up or login step has been completed, the user will be redirected to the main WhaleWatch dashboard. This dashboard will contain key data and metrics such as:
- Average CPU Usage
- Average Memory Usage
- Average Net I/O
- Average Block I/O
- Average PIDs
Furthermore, in the Container Health Overview section, developers will be able to quickly glean insights into which containers are healthy (blue whales) and which containers require attention (red whales).
Within the Containers component, developers have the ability to easily start, stop and restart containers with ease through intuitive drag and drop functionality. The containers are displayed and organized categorically by “Active” and “Inactive” containers.


