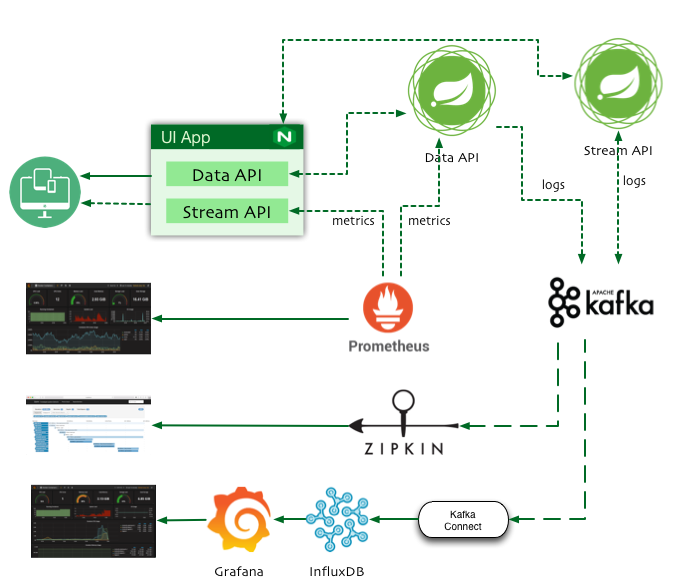
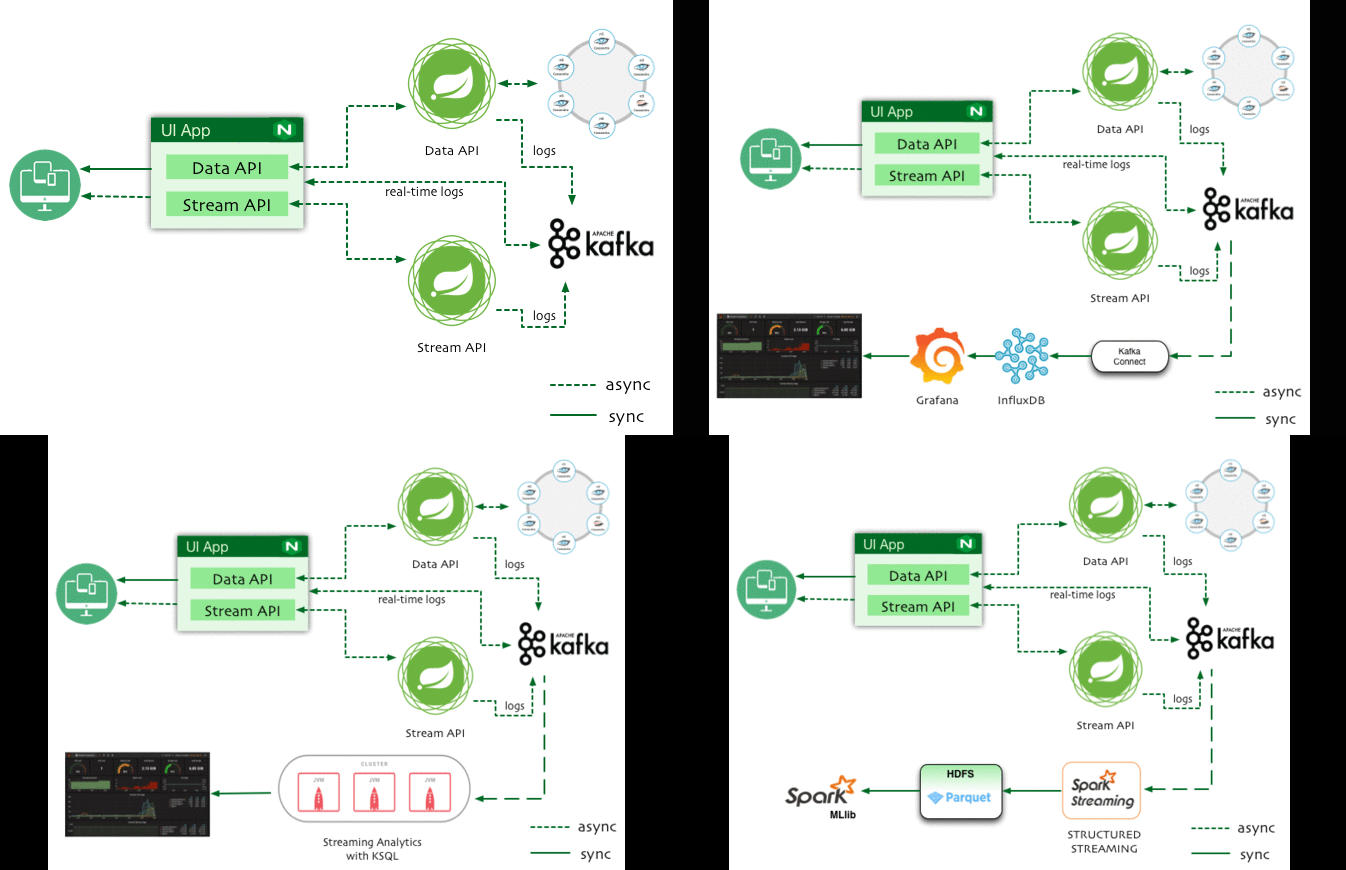
As Developers are migrating from Monolithic architecture to distributed microservices and Service Mesh, troubleshooting production issues become difficult.
This sample application showcases patterns to implement better Observability at web scale.
- Ready to go docker configuration for set up GILK logging stack in a minutes.
- GILK - Grafana , InfluxDB, Logstash json format, Kafka
- Monitoring solution for docker hosts and containers with Prometheus, Grafana, cAdvisor, NodeExporter and alerting with AlertManager.
- Vendor-neutral instrumentation
- Log Aggregation - SLF4J
- Distributed Tracking - OpenTracing
- Application Metrics - MicroMeter
- end-to-end
Functional Reactive Programming (FRP)with Spring 5. - Multi-project builds with Gradle Kotlin Script.
- Spring Kotlin Support
- Docker deployment
- Gradle 4.4 (Install via sdkman)
- Docker for Mac Setup Instructions
# build all 3 executable jars
gradle build
# continuous build with `-t`.
# this shoud be started before any run tasks i.e., `gradle ui-app:bootRun`, for spring's devtools to work.
gradle build -x test -t
# build all 3 apps
gradle build -x test
# build all 3 docker images
gradle docker -x testgradle test# start infra services
docker-compose -f docker-compose-infra.yml up cassandra
docker-compose -f docker-compose-infra.yml up kafka
docker-compose -f docker-compose-infra.yml up influxdbStart all 4 apps with gradle xyz:bootRun : cassandra-data-service, stream-service, ui-app , kafka-influxdb-service
If you want to debug the app, add --debug-jvm parameter to Gradle command line
You can also build Docker images and run all via Docker Compose
# start containers in the background
docker-compose up -d
# start containers in the foreground
docker-compose up
# show runnning containers
docker-compose ps
# scaling containers and load balancing
docker-compose scale stream=2
# 1. stop the running containers using
docker-compose stop
# 2. remove the stopped containers using
docker-compose rm -f
# just start only infra services
docker-compose  -f docker-compose-infra.yml up
# connect(ssh) to a service and run a command
docker-compose exec cassandra cqlsh
# see logs of a service
docker-compose logs -f stream
# restart single service
docker-compose restart stream
# start single service
docker-compose -f docker-compose-infra.yml up cassandra
docker-compose -f docker-compose-infra.yml up kafka
docker-compose -f docker-compose-infra.yml up influxdb
# check health for a service
docker inspect --format "{{json .State.Health.Status }}" microservicesobservability_app_1
docker ps
docker-compose -f docker-compose-fluentd.yml up
Access UI App at http://localhost:8080
Prometheus http://localhost:9090/graph
InfluxDB http://localhost:8083
Grafana http://localhost:1634
# upgrade project gradle version
gradle wrapper --gradle-version 4.4.1 --distribution-type all
# gradle daemon status
gradle --status
gradle --stop
# refresh dependencies
gradle build -x test --refresh-dependencies - Reactive Spring and Kotlin-based Application


