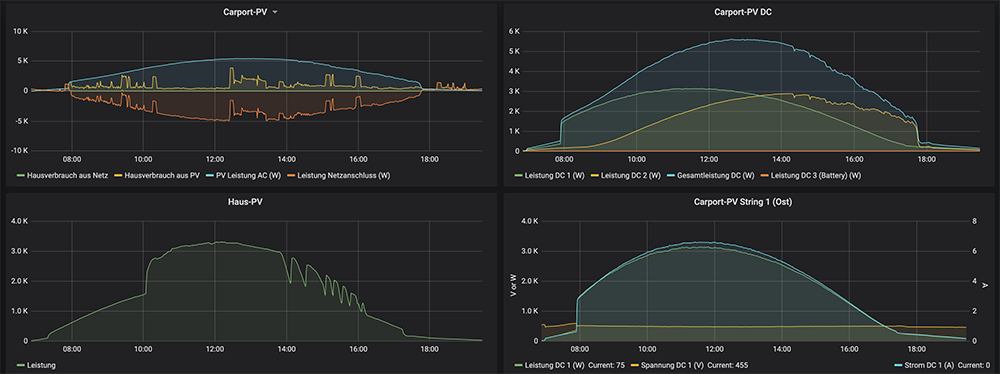
Monitor and visualize energy and resource consumption using influx, telegraf and grafana on a raspberry pi.

The TIG-stack consisting of Telegraf, InfluxDB and Grafana provides the basis for this home monitoring solution. They are running together on a raspberry pi 4. Ubuntu is used as operating system.
Telegraf is used to gather the measurements from the following sources
- FritzBox via TR-094 / Universal PnP
- Kostal power inverter type Piko 3.6 (installed 2008)
- Kostal Plenticore 8.5 power inverter (installed 2020)
The following values need adjustment when setting up another instance:
raspi4ubuntu: hostname of the raspi ubuntu servertelegrafpassword: the password for the telegraf user within the influx DB
-
Flash Ubuntu on a SD Card
- Download Ubuntu Pi image
- Current Version: ubuntu 20.04 LTS.
- For the Raspberyy Pi 4 the 64 bit edition is recommended.
- Follow the tutorial for flashing the image Hint: Writing to /dev/rdiskX instead of /dev/diskX will be 2-3 times faster.
- Eject sd card and put it into the Raspberry
-
connect raspi to lan and power, no keyboard / mouse / monitor is required
-
use router / dhcp server / arp cache to determine IP address:
My Raspberry Pi 4 uses the OUI DC-A6-32, so I can query the arp cache:
$ arp -a | grep dc:a6:32
? (192.168.178.71) at dc:a6:32:50:9a:f9 on en0 ifscope [ethernet]
-
ssh into the remote raspi as user
ubuntuwith passwordubuntu- changing the initial passworde is automatically requested right after login.$ ssh ubuntu@192.168.178.71 The authenticity of host '192.168.178.71 (192.168.178.71)' can't be established. ECDSA key fingerprint is ... Are you sure you want to continue connecting (yes/no/[fingerprint])? yes ubuntu@192.168.178.71's password: ... You are required to change your password immediately (administrator enforced) ....
-
(optional) add public key as authorized ssh key
# from within your workstation terminal
ssh-copy-id -i ~/.ssh/id_rsa.pub ubuntu@raspi4ubuntu
-
# within ubuntu shell
sudo apt-mark hold flash-kernel
sudo apt-get update && sudo apt-get upgrade
sudo dpkg-reconfigure tzdata
sudo hostnamectl set-hostname raspi4ubuntu
see also: complete tutorial
-
InfluxDB
sudo curl -sL https://repos.influxdata.com/influxdb.key | sudo apt-key add -
source /etc/lsb-release
echo "deb https://repos.influxdata.com/${DISTRIB_ID,,} ${DISTRIB_CODENAME} stable" | sudo tee /etc/apt/sources.list.d/influxdb.list
sudo apt update
sudo apt install influxdb -y
sudo systemctl start influxdb
sudo systemctl enable influxdb
# check that ports 8088 and 8086 are in LISTEN state
netstat -plntu
Create Database and User using the
influxshellubuntu@ubuntu:~$ influx Connected to http://localhost:8086 version 1.7.10 InfluxDB shell version: 1.7.10 > create database telegraf > create user telegraf with password 'telegrafpassword' > exit ubuntu@ubuntu:~$
-
Telegraf Agent
sudo apt install telegraf -y
sudo systemctl start telegraf
sudo systemctl enable telegraf
sudo systemctl status telegraf
Create /etc/telegraf/telegraf.conf
cd /etc/telegraf/
sudo mv telegraf.conf telegraf.conf.default
Provide new config (eg using
sudo vi telegraf.conf):# Global Agent Configuration [agent] hostname = "raspi4ubuntu" flush_interval = "15s" interval = "15s" # Input Plugins [[inputs.cpu]] percpu = true totalcpu = true collect_cpu_time = false report_active = false [[inputs.disk]] ignore_fs = ["tmpfs", "devtmpfs", "devfs"] [[inputs.io]] [[inputs.mem]] [[inputs.net]] [[inputs.system]] [[inputs.swap]] [[inputs.netstat]] [[inputs.processes]] [[inputs.kernel]] # Output Plugin InfluxDB [[outputs.influxdb]] database = "telegraf" urls = [ "http://127.0.0.1:8086" ] username = "telegraf" password = "telegrafpassword"restart telegraf agent
sudo systemctl restart telegraf
-
Grafana
official install documentation recommends to use the enterprise editionsudo apt-get install -y apt-transport-https sudo apt-get install -y software-properties-common wget wget -q -O - https://packages.grafana.com/gpg.key | sudo apt-key add - sudo add-apt-repository "deb https://packages.grafana.com/enterprise/deb stable main" sudo apt-get install grafana-enterprise sudo systemctl start grafana-server sudo systemctl enable grafana-server netstat -plntu # check that grafana listens on port 3000
Finish Grafana setup in the GUI:
- open grafana in your browser (http at port 3000 served by raspi)
- login to grafana using default credentials admin/admin
- change default password
- add InfluxDB datasource on http://localhost:8086/ using telegraf db and telegraf user credentials
- import grafana dashboard e.g. system metrics "https://grafana.com/dashboards/5955"
TIG stack is now ready. But the only measurements are the system metrics of the raspi host system itself.
Current power inverter from kostal have a modbus TCP interface. The modbus interface definition describes the available registers in chapter "3. MODBUS Register table".
The modbus interface has to be enabled within the inverter webgui and the port to be used may be changed there.
There is also a modbus input plugin available for telegraf.
The tricky part is to use the correct byte ordering and datatype, which is not specified in the kostal interface documentation.
All registers with type Float in the register table need to be defined with data_type=FLOAT32-IEEE and byte_order="CDAB".
I found this detail in netzkind's github project.
Furthermore, two consecutive register addresses need to be given.
Place file modbus-kostal.conf into /etc/telegraf/telegraf.d/.
The controller = "tcp://192.168.178.65:1502" parameter needs to be adjusted to the inverter's actual ip adress and the configured modbus tcp port.