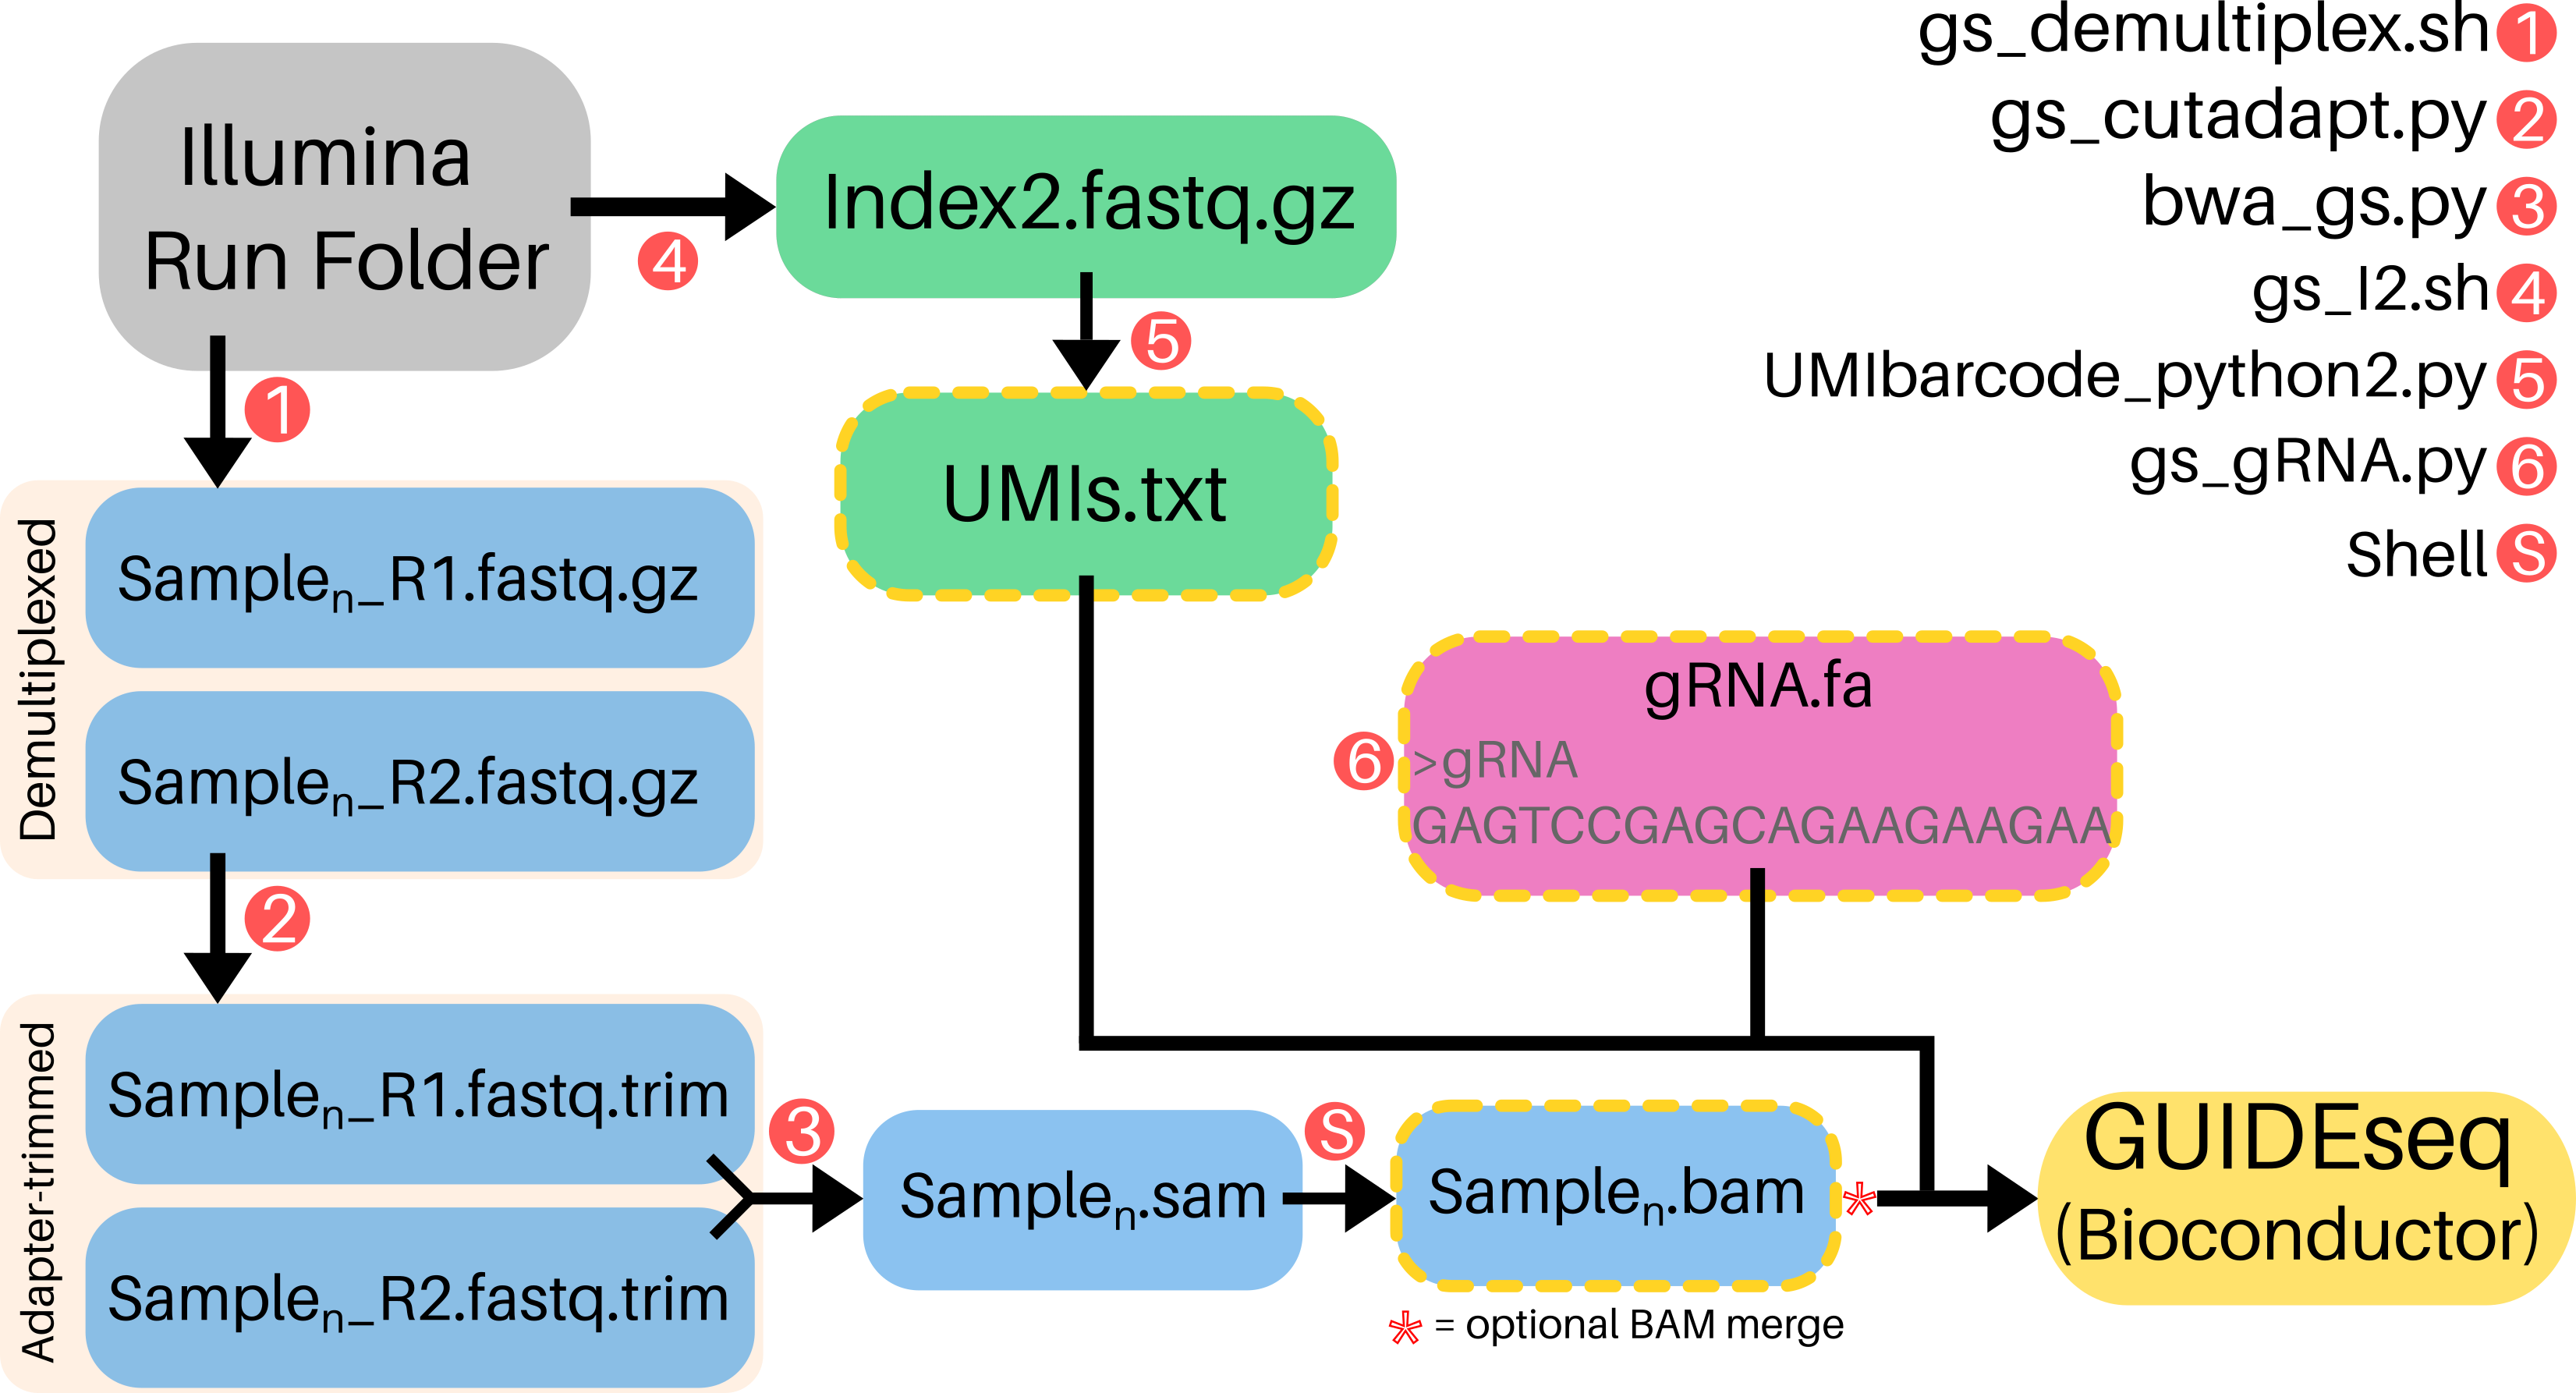
GS-Preprocess is a one-line, 6-argument pipeline that generates input data for the GUIDEseq Bioconductor package (https://doi.org/doi:10.18129/B9.bioc.GUIDEseq) from raw Illumina sequencer output. For off-target profiling, Bioconductor GUIDEseq only requires a 2-line guideRNA fasta, demultiplexed BAM files of "plus"- and "minus"-strands, and Unique Molecular Index (UMI) references for each read.
Compatible libraries are constructed according to GUIDE-seq enables genome-wide profiling of off-target cleavage by CRISPR-Cas nucleases (https://doi.org/10.1038/nbt.3117).
GS-Preprocess is available in a Docker container to users who do not have (or cannot install) the dependencies. For more information on using Docker, visit docker.io. Setup and run instructions:
Download the GS-Preprocess container
docker pull umasstr/gsp:latest
Navigate to a directory containing (i) Illumina "Data/" directory (ii) CSV SampleSheet (iii) RunInfo.xml Enter the container:
docker run -it -v "$PWD":/DATA umasstr/gsp
cd DATA/
Demultiplex, align and generate UMI reference files
gs_preprocess -t <threads> -o <output_dir> -r <directory_containing_RunInfo.xml> -s <SampleSheet.csv> -b </path/to/BWAIndex/genome.fa> -g <gRNA_sequence> -I <# UMI nt, default=8>
Open R in the container and proceed with Bioconductor GUIDEseq analysis: Sample Bioconductor GUIDEseq Input. The container has R 4.0 preloaded and GUIDEseq preinstalled.
This pipeline is compatible with ANY ILLUMINA SEQUENCER and WITHOUT PRE-CONFIGURATION. This represents a flexible alternative to https://github.com/aryeelab/guideseq#miseq which requires a pre-configured MiSeq and sample manifest YAML.
Note: Paired-end sequencing should include 8 Index1 (i7) cycles and 16 Index2 (i5) cycles:
R1 | 8 | 16 | R2
-
≥32G of RAM allocated to the GS-Preprocess pipeline
-
Illumina output folder: Download from BaseSpace or directly from any Illumina sequencer after run completion. No demultiplexing or fastq generation necessary!
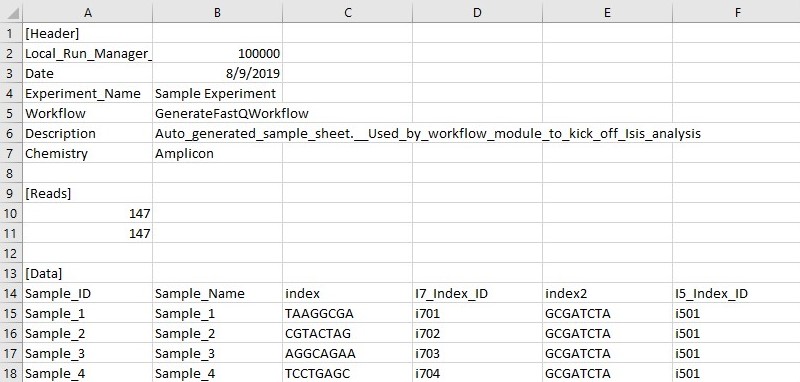
Run_output_dir_Example |-- Config |-- Data |-- Images |-- InterOp |-- Logs |-- RTAComplete.txt |-- RTAConfiguration.xml |-- RTALogs |-- RTARead1Complete.txt |-- RTARead2Complete.txt |-- RTARead3Complete.txt |-- RTARead4Complete.txt |-- Recipe |-- RunCompletionStatus.xml |-- RunInfo.xml |-- RunParameters.xml |-- Thumbnail_Images- Illumina-format SampleSheet: https://help.basespace.illumina.com/articles/descriptive/sample-sheet/ This sheet is in .csv format and is commonly used to demultiplex illumina .bcl files (raw sequencer output). A0# and i70# Index must be listed as its REVERSE COMPLIMENT on the Sample Sheet! This is a consequence of the way in which the indexing primers are used in the Tsai et al. library prep method. See my premade "SampleSheet.csv" and "Indexes.csv", or use https://github.com/LJI-Bioinformatics/Excel-Reverse-Complement.

- RunInfo.xml: Contains high-level run information,such as the number of Reads and cycles in the sequencing run. This file is standard output from any illumina sequencer and will automatically populate in any run output folder. RunInfo.xml is found in the top-level output folder of any sequencing run
- Illumina-format SampleSheet: https://help.basespace.illumina.com/articles/descriptive/sample-sheet/ This sheet is in .csv format and is commonly used to demultiplex illumina .bcl files (raw sequencer output). A0# and i70# Index must be listed as its REVERSE COMPLIMENT on the Sample Sheet! This is a consequence of the way in which the indexing primers are used in the Tsai et al. library prep method. See my premade "SampleSheet.csv" and "Indexes.csv", or use https://github.com/LJI-Bioinformatics/Excel-Reverse-Complement.
-
BWA Index Download: https://support.illumina.com/sequencing/sequencing_software/igenome.html
Add the below dependencies:
bcl2fastq2/2.20.0
python2
R/3.6.0
bwa
cutadapt/1.9
gcc/8.1.0 #may not be necessary, depending on OS
samtools
Example:
module add bcl2fastq2/2.20.0
In cluster working directory
git clone https://github.com/umasstr/GS-Preprocess.git
Move into src directory
cd GS-Preprocess/src
Make all files executable
chmod +x *
./gs_preprocess.sh -t <number_of_threads> -o </absolute/path/to/output_directory> -r <directory_containing_RunInfo.xml> -s </path/to/SampleSheet.csv> -b </path/to/BWAIndex/genome.fa> -g <gRNA_sequence> -I <# UMI nt, default>
To avoid errors, use absolute paths.
Completion of gs_preprocess.sh generates all 3 inputs needed for Bioconductor GUIDEseq and stores them in working directory (GS-Preprocess/src/)
- plus- and minus-strand BAMs
- UMIs.txt
- guideRNA.fa
Benchmarks for a 10 million read run with 40 uniquely barcoded samples (20 plus and minus strand):
-
8 cores, 48G RAM
Total Runtime: 130 min CPU time: 23578.08 sec Max Memory: 12673 MB Average Memory: 4451.26 MB -
24 cores, 48G RAM
Total Runtime: 22 min CPU time: 11066.98 sec Max Memory: 12798 MB Average Memory: 2595.86 MB -
32 cores, 48G RAM
  Total Runtime: 19 min
  CPU time: 11373.65 sec
  Max Memory: 12854 MB
  Average Memory: 2524.71 MB
If you're using a cluster or server, consider running the docker image in Singularity. Generally, docker images can be pulled from your home directory, but check with your local admins if using Singularity for the first time.
singularity shell docker://umasstr/gsp:latest
Once in the container, set environment variables not carried over:
export PATH=/share/pkg/conda/cutadapt/4.1/bin:$PATH
Run the pipeline as directed above, calling the gs_preprocess command.
Note: Loading a docker image through Singularity does not completely recapitulate the containerized environment offered by docker. For example, my server does not allow me to run the GUIDEseq R package due to library conflicts. In this case, I transfer the pre-processed files to my local machine where I can run the container with docker.
Certain situations will require user to merge BAM files:
- A sequencer with multiple lanes (NEXTseq e.g.) will generate 4 fastq.gz files per sample labeled L001-L004.
- Replicate samples with distinct i5 and/or i7 barcodes. Different UMIs do not count as distinct barcodes for this purpose.
To merge technical replicates, consider:
samtools merge -@ <threads> <merged_sample_name.bam> <sample_1.bam> <sample_2.bam> ... <sample_n.bam>
To merge Lane 1-4 BAMs, consider:
for i in *L001.bam;do samtools merge -@ <threads> ${i%_S*}.bam ${i%_S*}*.bam;done
	library(hash)
	library(GUIDEseq)
	library(BSgenome.Hsapiens.UCSC.hg38)
	library(TxDb.Hsapiens.UCSC.hg38.knownGene)
	library(org.Hs.eg.db)

	guideSeqResults <- GUIDEseqAnalysis(
	alignment.inputfile = c("POS_STRAND.bam","NEG_STRAND.BAM"),
	umi.inputfile=c("UMIs.txt","UMIs.txt"),
	gRNA.file = "gRNA_FILE.fa",
	max.mismatch = 10,
	BSgenomeName = Hsapiens,
	txdb = TxDb.Hsapiens.UCSC.hg38.knownGene,
	orgAnn = org.Hs.egSYMBOL,
	outputDir= "SAMPLE_NAME",
	n.cores.max = NUMBER_THREADS)
GUIDEseq Dependency R Installation (One Time Only):
	install.packages("BiocManager")
	BiocManager::install("hash")
	BiocManager::install("BSgenome.Hsapiens.UCSC.hg38")
	BiocManager::install("TxDb.Hsapiens.UCSC.hg38.knownGene")
	if (!requireNamespace("BiocManager", quietly = TRUE))
			install.packages("BiocManager")
	BiocManager::install("GUIDEseq")
Please note the "hg38" genome selection. This can be changed to the assembly of your choice.
The basic output of GUIDEseqAnalysis (see above section) is offTargetsInPeakRegions.xls
To visualize the output, you can use the shell script "guideseq_plot.sh" as shown below to print a color-coded mismatch plot in your terminal.
guideseq_plot.sh Sample01_output_folder/offTargetsInPeakRegions.xls
You can pipe the output into aha and turn this into an html file that preserves the color and position of each character.
# if aha not already installed: sudo apt-get update && sudo apt-get install -y aha
guideseq_plot.sh Sample01_output_folder/offTargetsInPeakRegions.xls | aha > output.html
Alternatively, you can use our somewhat buggy web app which adapts visualizstion code directly from Tsai et al. We are thankful to the authors for making their code available and clear, and hope that you will cite their NBT article.


