Let's create website's capacity test
Run test webserver:
make testRun all experiment with 100 tests for each configuration:
make all END=100Run all experiment with 5 tests for each configuration:
make all_5Run single experiment once on single configuration:
END=1
experiment0What is a capacity test?
Capacity test is a testing measure that evaluates the speed, responsiveness and stability of a computer, network, software program or device under a workload. Organizations will run those tests in order to identify performance-related bottlenecks.
More generally, performance analysis refers to characterizing performance under several working conditions.
Performance analysis can be characterized by several indicators, in this work a web server will be studied using those indicators:
- Response Rate (Throughput)
- Elapsed Time
- Latency
A capacity test, on Apache WebServer connected with a MySQL database, will be runned in following steps:
-
Create a System Design Architecture based on container technology, those container will be runned using limited resources to elaborate differents tests
-
Define a proper experimental design to run out using common techniques in State of Art
-
Collect several observations (repetitions) for each value of design
-
Perform a performance analysis to determine a proper system configuration using allocation of variation and ANOVA techniques
-
Perform a capacity test to determinate knee and the usable capacity point of work of system defined in previuos step
All tests will be runned on MacBook Air 2020 using those specs:
- CPU: Apple M1 (Arm 64-bit)
- RAM: 8GB
Docker will run on this specs:
- Docker cores: 4
- Docker RAM: 4 GB
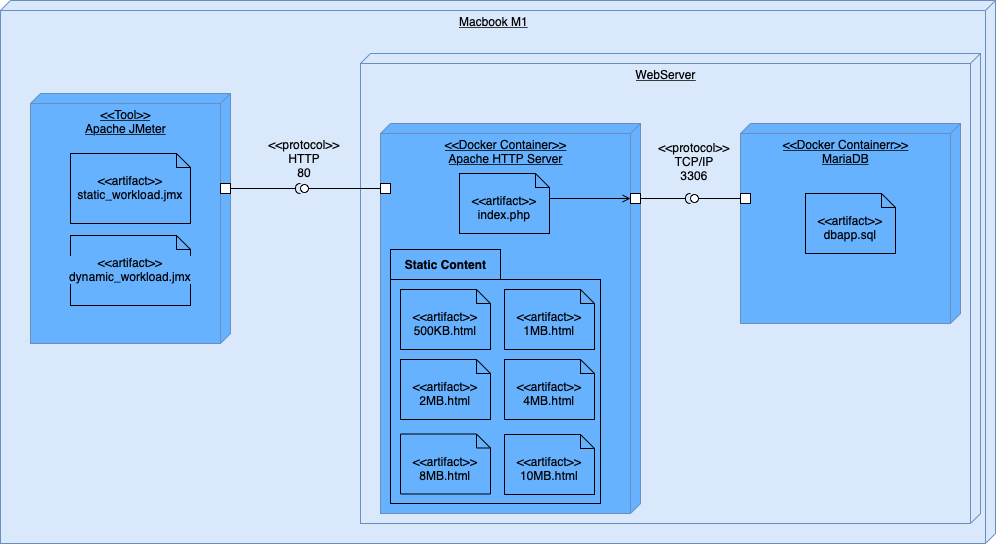
WebServer is built on simple 3-tier architecture, using 2 different Docker container described using this deployment diagram:
Tested environment has different components, which include artefacts and interfaces in order to comunicate each other.
Apache HTTP Server is a docker container with prebuilded image, that contains Apache WebServer configured with php module, in listening on port 80. Futhermore, MySQL connector is installed to communicate with MariaDB component.
There are differents files uploaded in container, those artefacts are usefull to create 2 type of different workload:
- Static Workload: include only html static pages to download
- Dynamic Workload: dynamic pages are generated using operations on database
MariaDB Server is a docker continer with prebuilded image with preconfigured MySQL service in listening on port 3306.
dbapp.sql file is preloaded in /docker-entrypoint-initdb.d path to init e populate database.
Clients are simulated using a load tester: Apache JMeter is an application designed to measure performance and load test applications.
For each workload a JMeter test will be replicated more times in order to collect data for case study.
An experiment is a test in which changes are made to the input variables of a system or process with the aim of observing and identifying the reasons of changes in the output.
Some of contrallable input are identified to study the response:
- Apache HTTP Server CPU
- Apache HTTP Server RAM
- MariaDB Server CPU
- MariaDB Server RAM
- Workload
For each factor a minimun and maximum level will be evaluated:
| Level | 1 | 2 |
|---|---|---|
| Apache CPU | 0.125 vCPU | 0.5 vCPU |
| MariaDB CPU | 0.125 vCPU | 0.5 vCPU |
| Apache RAM | 256 MB | 1 GB |
| MariaDB RAM | 256 MB | 1 GB |
| Workload | Static | Dynamic |
The response to be evuluted is the mean throughput of system.
A full factor design
Using following association:
| Factor | Name |
|---|---|
| Apache CPU | A |
| MariaDB CPU | B |
| Apache RAM | C |
| MariaDB RAM | D |
| Workload | E |
A decision needs to be taken about factor counfouding, in particular designer decided to confuse:
- A = CE
- B = DE
This choices were dicted by the possible relationship between workload and memory RAM of same component.
Sign table will be generated simply using itertools:
import itertools
import pandas as pd

C = [-1, +1]
D = [-1 , +1]
E = [-1 , +1]

Table = []

for x in itertools.product(C, D, E):
  Table.append(x)

TableSign = pd.DataFrame(Table, columns=["C", "D", "E"])
TableSign["CD"] = TableSign["C"] * TableSign["D"]
TableSign["CE"] = TableSign["C"] * TableSign["E"]
TableSign["DE"] = TableSign["D"] * TableSign["E"]
TableSign["CDE"] = TableSign["C"] * TableSign["D"] * TableSign["E"]
TableSign.to_markdown()
Result:
| Experiment | C | D | E | CD | A=CE | B=DE | CDE |
|---|---|---|---|---|---|---|---|
| 0 | -1 | -1 | -1 | 1 | 1 | 1 | -1 |
| 1 | -1 | -1 | 1 | 1 | -1 | -1 | 1 |
| 2 | -1 | 1 | -1 | -1 | 1 | -1 | 1 |
| 3 | -1 | 1 | 1 | -1 | -1 | 1 | -1 |
| 4 | 1 | -1 | -1 | -1 | -1 | 1 | 1 |
| 5 | 1 | -1 | 1 | -1 | 1 | -1 | -1 |
| 6 | 1 | 1 | -1 | 1 | -1 | -1 | -1 |
| 7 | 1 | 1 | 1 | 1 | 1 | 1 | 1 |
Algebra of confunding is usefull to obtain generator polynomial and find relationship of confusions.
This relationship is usefull to find generator polynomial
Generator polynomial can be used to calculate all of confounded effects:
| Effect | Confounded 1 | Confounded 2 | Confounded 3 |
|---|---|---|---|
| C | AE | ABD | BCDE |
| D | BE | ABC | ACDE |
| E | AC | BD | ABCDE |
| CD | AB | BCE | ADE |
| CE | A | BCE | ABDE |
| DE | B | ACD | ABCE |
| CDE | AD | AC | ABE |
In order to collect usefull data, containing knee and usable capacity point of work, it is needed to stress system untils its usable point.
Preliminar tests will be conducted, on system configuration with highest level of each parameter, to individuate a load test configuration in JMeter that led to system errors. Futhermore, a particular focus is paid on JMeter exceptions, workload is tuned in order to avoid any client error.
Simulated workload will be rappresentative for a stress test on WebServer using those criterias:
- A lot of people try to connect server
- Number of user active is incremental: half of test time is used to activate all user and the other half of time is used to stress system on full load
- Each user generate a traffic with a request for each 2 seconds
- Different static pages will be loaded using a Random Order Controller in order to generate a static traffic considering 2MB as mean of generic HTML page size.
- Dynamic workload will be performed using a Random Controller in order to generate random traffic using dynamic webpages with database operations
In summary, this workload characterization has those parameters:
| Parameter | Value |
|---|---|
| Test duration | 5 minutes |
| Virtual users | 250 threads |
| Ramp-up period | 150 seconds |
| Throughput (for user) | 30 requests/minute |
| Static Workload | Static HTTP pages sized: 500KB 1MB 2MB 4MB |
| Dynamic Workload | PHP using r/w operations on MySQL Server |
During data collection phase, automatization process can be usefull to collect data from system fastly, in jmeter folder there are a subfolder for each experiment, in which is created a run_experiment.sh script that will be used to run JMeter with proper configuration.
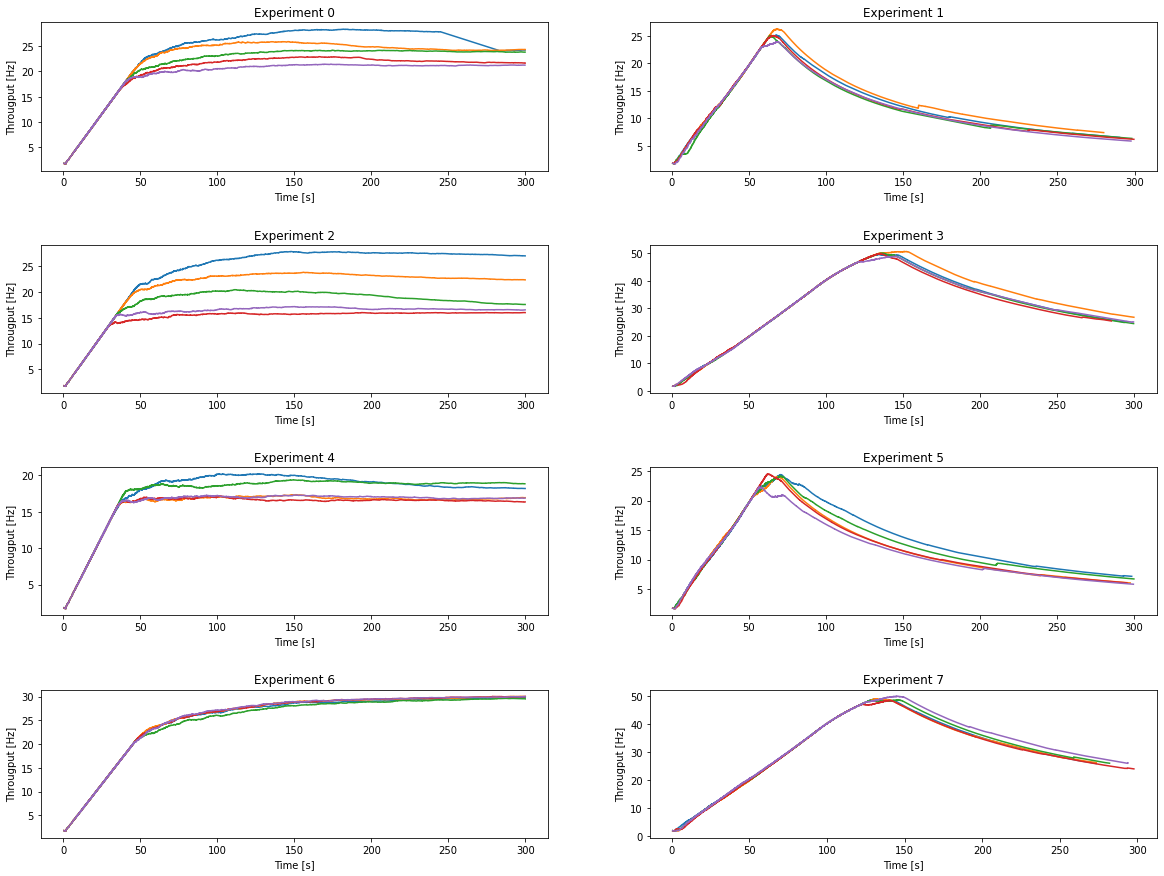
Visual analysis is performed as preliminary step to obtain usefull information and make hypothesis. As shown in sign table, experiments with even number are performed using static workload, instead of experiments with odd number using dynamic workload.
In static workload, after knee point the throughput is almost constant, while in dynamic workload the response decreases significantly due to MariaDB server's restart.
The response, evaluated in terms of mean throughput, will be significantly different for static workload and dynamic workload, so we will be expected to observe Workload factor as important effect.
Futhermore the knee and usable point distance in the throughput curve are different for static workload and dynamic workload, so we will be accurately choice the knee point in a different way for each workload.
The response is defined as the mean throughput, which is the average number of requests per second, in order to evaluate importance and significance of each effect/interaction, the response needs to be modeled.
Where:
| Variable | Description |
|---|---|
| Mean of response | |
| Factor C effect | |
| Factor D effect | |
| Factor E effect | |
| Interaction C-D effect | |
| Interaction C-E effect | |
| Interaction D-E effect | |
| Interaction C-D-E effect | |
| Sperimental error |
Using this model and some assumptions, we can obtain a linear model, which will be used to estimate the effect of each parameter.
In order to evaluate the effects of factors, we need to estimate the variance and significance of the effects. We will use the following procedure:
- Calculate variance for each factor and interaction.
- Individue the most important factors/interactions.
- Validating the results by conducting an ANOVA on interearated factors.
Variance is calculated using Sum of Squares method, remembering that sum of effect, interaction and error along axis are all equal to zero, so relationship can be simplified to:
Allocation of Variation of factor/interaction is calculated as follows:
Recording confounded effects:
- A = CE
- B = DE
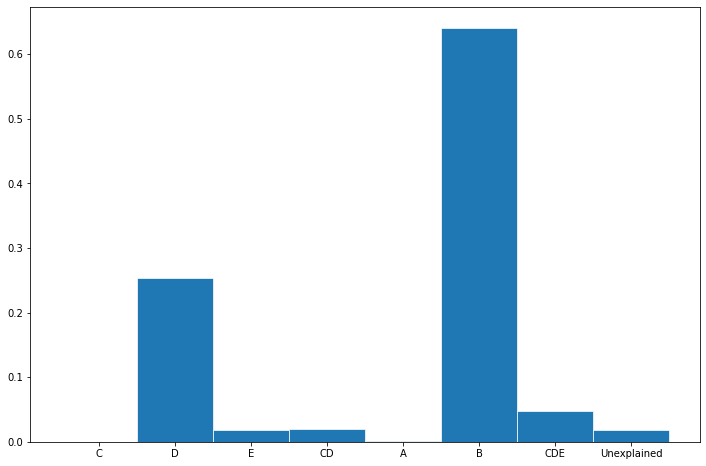
A bar chart is used to indicate the most important factor/interaction:
Results of most important factor/interaction are showed in following table:
| Effect | Confounded 1 | Confounded 2 | Confounded 3 | Importance |
|---|---|---|---|---|
| C | AE | ABD | BCDE | ~25% |
| DE | B | ACD | ABCE | ~64% |
MariaDB CPU factor results as important factor explaining 25% of total variation of the system, but MariaDB RAM factor (confused with DE interaction) is the most important factor explaining 65% of total variation.
In order to validate the results, we need to conduct an ANOVA test on important factors, so prelimanary we compute degrees of freedom of each factor:
Using a 2^k factorial design, we have only one degree of freedom for each factor and interaction, so we have only one Fisher table's value to compare (remembering that degree of error
Using a significance level of 0.05, we can calculate F-value to compare to significance of factor/interaction, this value is 4.15.
Significance of level using ANOVA classical test is calculated as follows:
Where:
-
$\nu_A$ : degree of freedom for factor A -
$\nu_e$ : degree of freedom for sperimental error -
$MSA$ : mean square of factor A -
$MSE$ : mean square of sperimental error
Both factors are significant, so the results are significant.
Nevertheless results seems biased from dynamic workload, infact MariaDB components is obviously not relevant for static workload, but they results as most important factor.
A different investigation using 2 different experiments for each workload is needed to validate the results.
Here link for complete exercise with code.
Considering previous results, capacity test will be performed on a dynamic workload's configuration. Analist decided based on the previous results, to test following configuration:
- Apache CPU: 0.125 vCPU (Level 1)
- Apache RAM: 256MB RAM (Level 1)
- MariaDB CPU: 0.125 vCPU (Level 1)
- MariaDB RAM: 1GB RAM (Level 2)
Performance analysis can be characterized by several indicators, in this case will be studied those indicators:
| Indicator | Description |
|---|---|
| Response Rate (Throughput) | The number of requests per second that the application can handle. |
| Elapsed Time | The time it takes for the server to handle a request. |
| Latency | The time it takes for the server to respond to a request. |
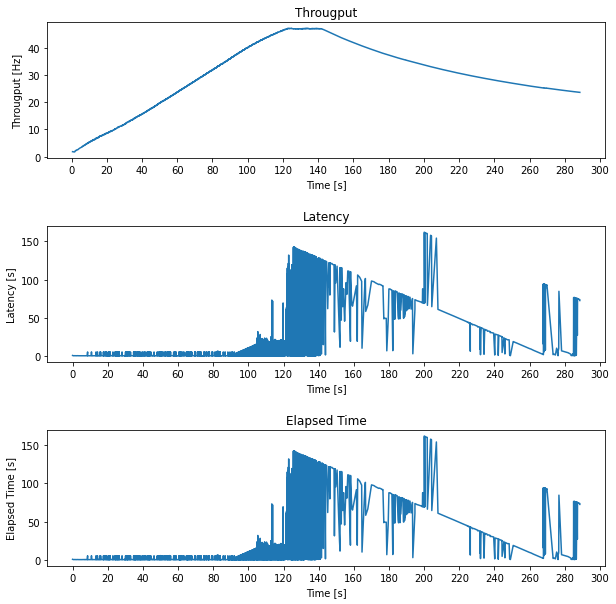
As shown in the figure, latency and elapsed have a similar behavior, that because of the nature of the workload, infact too much SQL requests led to MariaDB component to crash and recovery phase is not fast enough to handle the workload.
Knee Capacity is the point beyond which the response time increases rapidly as the load but the gain in throughput is small. Before the knee, the response time does not increase significantly but the throughput rises as the load increases.
Usable Capacity is the point of maximum throughput achievable without exceeding a prespecified response time limit.
In this case knee and usable capacity are very close, so it is a good practice to choose a smaller knee capacity to dimensionate the workload: analist decided to individuate the knee point as the point at 100 seconds of workload (about 160 virtual users online).
Usable Point is individuated when throughput stop to increase and system start to return errors due to component crash: analist decide to individuate the usable point as the point at 140 seconds of workload (about 230 virtual users online).
Here link for complete exercise with code.


