As we move to microservices based architectures, having a comprehensive observability solution is key to have highly available and reliable applications. But unfortunately self-managed observability solutions such as prometheus and grafana are difficult to operate, specially when you need longer retention period.
This repository shows how to leverage Azure Monitor Container Insights with Prometheus Integration together with Azure Managed Grafana as a complete managed observability solution for workloads running on AKS, removing the operational costs and hassle that comes from maintaining a self-managed solution.
$ cd terraform
$ az login
$ terraform init
$ terraform plan -var 'aks-observability-rg=<resource_group_name>'
$ terraform apply -var 'aks-observability-rg=<resource_group_name>'
$ az aks get-credentials --name aks-observability --resource-group <resource_group_name>
$ cd ..
$ kubectl apply -f container-azm-ms-agentconfig.yaml
$ cd apps/order-app
$ az acr build -f Dockerfile-consumer -r <acr_name> --image order-consumer:v1 .
$ az acr build -f Dockerfile-producer -r <acr_name> --image order-producer:v1 .
Edit order-consumer.yaml and order-producer.yaml to set the image registry URL from terraform's output and deploy them on AKS
$ kubectl apply -f order-consumer.yaml -f order-producer.yaml
$ cd ../..
$ az grafana folder create --title "AKS Observability" -n aks-observability -g <resource_group>
$ export LOG_ANALYTICS_WORKSPACE_ID=$(az monitor log-analytics workspace show -n aks-observability -g <resource_group> -o tsv --query id)
$ az grafana dashboard import --folder "AKS Observability" --definition "$(envsubst '$LOG_ANALYTICS_WORKSPACE_ID' < AKS-Observability-Dashboard.json.template)" -n aks-observability -g <resource_group>
$ az grafana show -n aks-observability -g <resource_group> --query properties.endpoint -o tsv
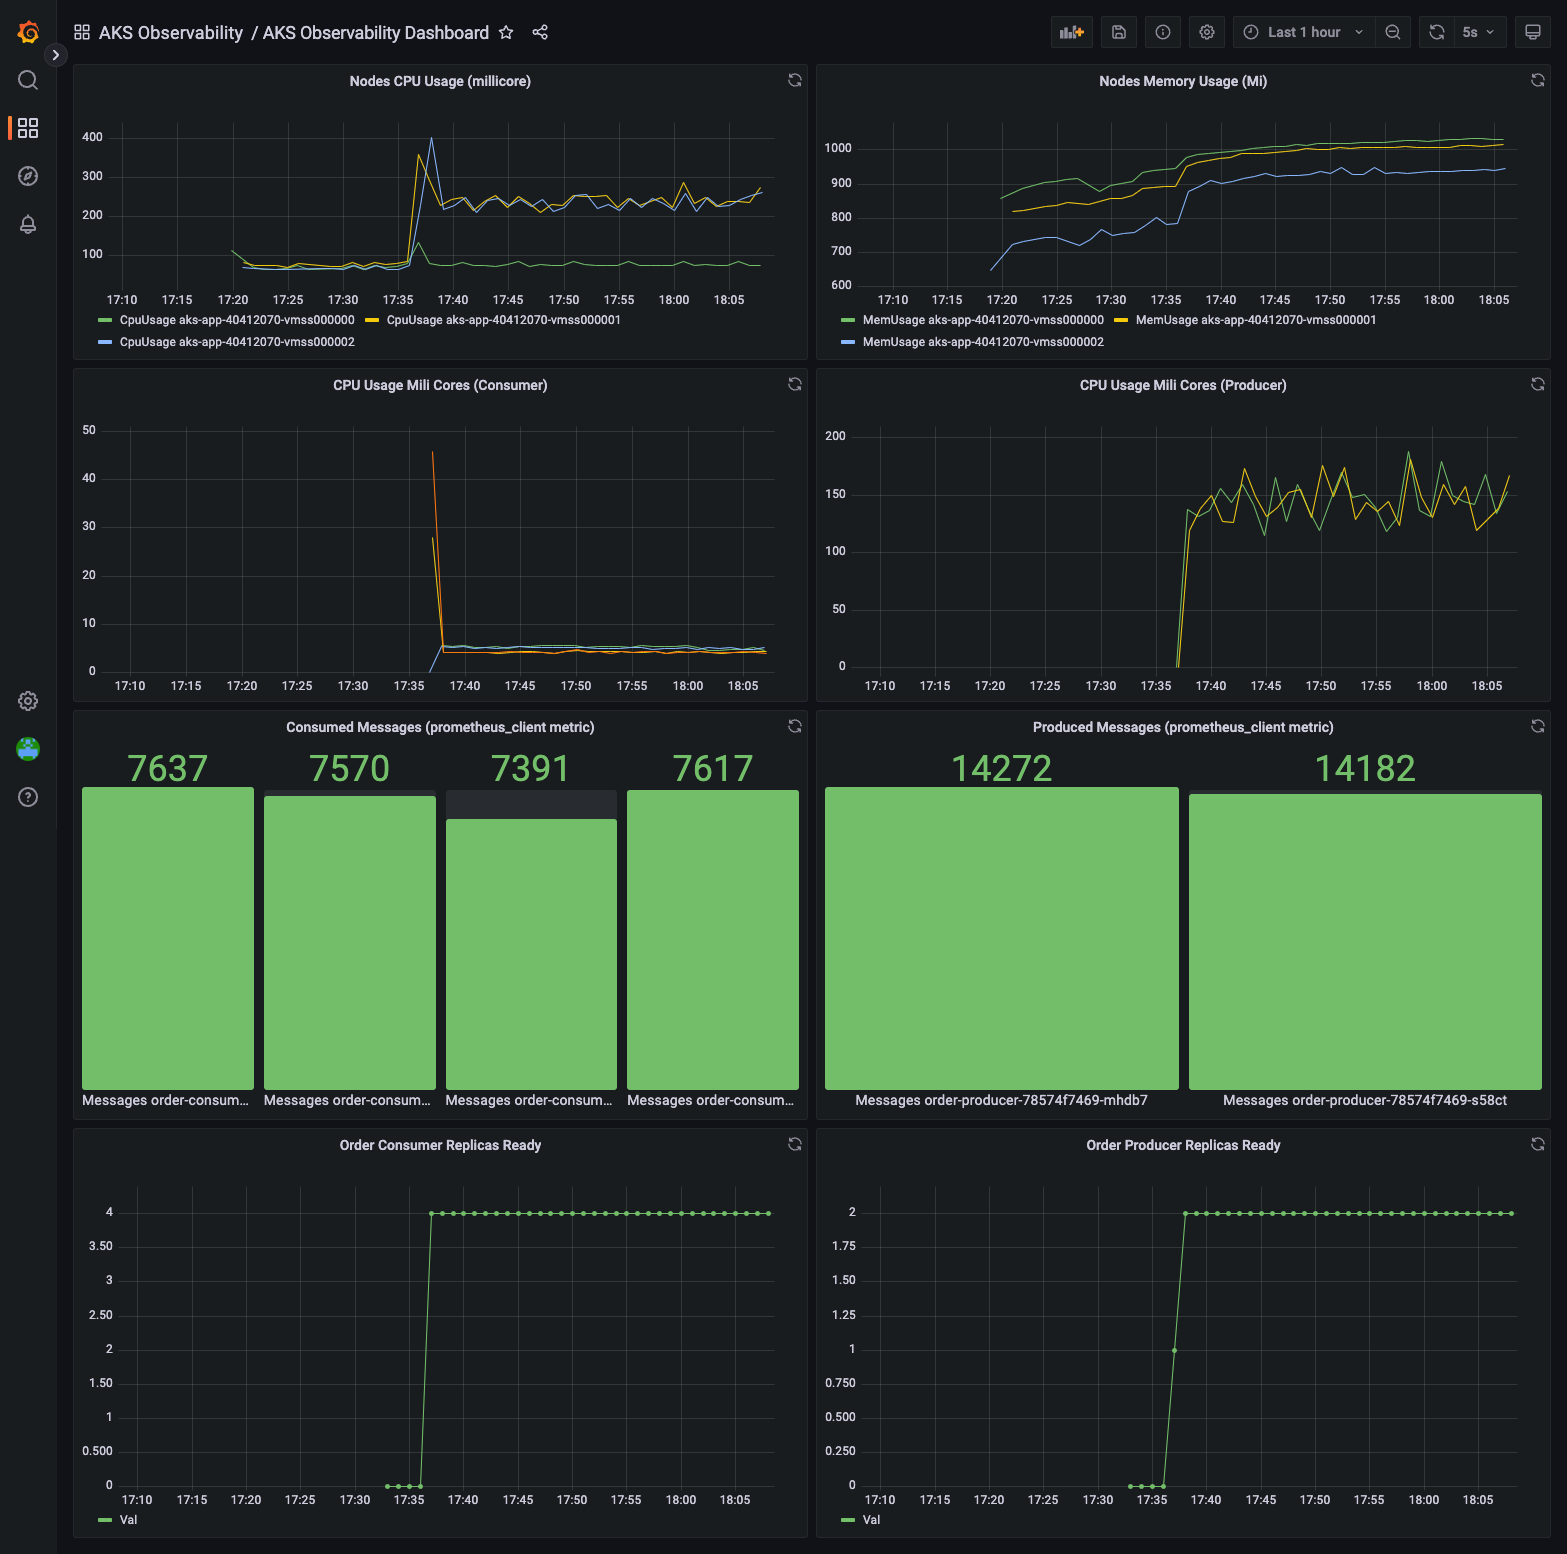
Navigate to Dashboards > AKS Observability > AKS Observability Dashboard, you should see something like this:
This dashboard shows metrics collected from Container Insights and fetched using Grafana's Azure Monitor Datasource (Monitor Logs using KQL), including prometheus metrics implemented using prometheus/client_python in app/order-app/order-consumer.py and app/order-app/order-producer.py. Feel free to explore the queries by editing each panel.
$ LOG_QUERY="KubePodInventory |
extend PodLabel = todynamic(PodLabel)
| where PodLabel[0].app == 'order-consumer'
| project ContainerID
| join kind=rightsemi (
 ContainerLog
 | project TimeGenerated, ContainerID, LogEntry
 | where TimeGenerated > ago(10m)
)
on ContainerID"
$ WORKSPACE_GUID=$(az monitor log-analytics workspace show -n aks-observability -g <resource_group> --query customerId -o tsv)
$ az monitor log-analytics query -w $WORKSPACE_GUID --analytics-query "$LOG_QUERY" -o tsv
Reference:
https://azure.microsoft.com/en-us/services/managed-grafana/
https://grafana.com/docs/grafana/latest/datasources/azuremonitor/
https://docs.microsoft.com/en-us/azure/azure-monitor/containers/container-insights-overview
