GScluster is a standalone Shiny/R package for network-weighted gene-set clustering and network visualization.
Open R program and type following commands in R console.
install.packages('devtools')
library(devtools)
install_github('unistbig/GScluster')
library(GScluster)
To run demo file, please type following R code.
GScluster()
To run user's own data, please modify following example R codes.
- Read gene-set analysis result table.
GSAresult=read.delim('https://github.com/unistbig/GScluster/raw/master/sample_geneset.txt', stringsAsFactors=FALSE)
- Read gene score table.
GeneScores=read.delim('https://github.com/unistbig/GScluster/raw/master/sample_genescore.txt', header=F)
- Run GScluster
GScluster(GSAresult = GSAresult, GeneScores = GeneScores, Species = 'H', alpha = 1, GsQCutoff = 0.25, GQCutoff = 0.05)
User's manual is available here.
-
Type 2 Diabetes Mellitus Data (DIAGRAM)
Gene-set analysis result file (q-value cutoff: 0.25)
Genescore file (q-value cutoff: 0.01) -
Colon Cancer Data
Gene-set ananlysis result file (q-value cutoff: 0.01)
Genescore file (q-value cutoff: 0.01) -
Acute Myeloid Leukemia (AML) Data
Gene-set ananlysis result file (q-value cutoff: 0.01)
Genescore file (q-value cutoff: 0.01)
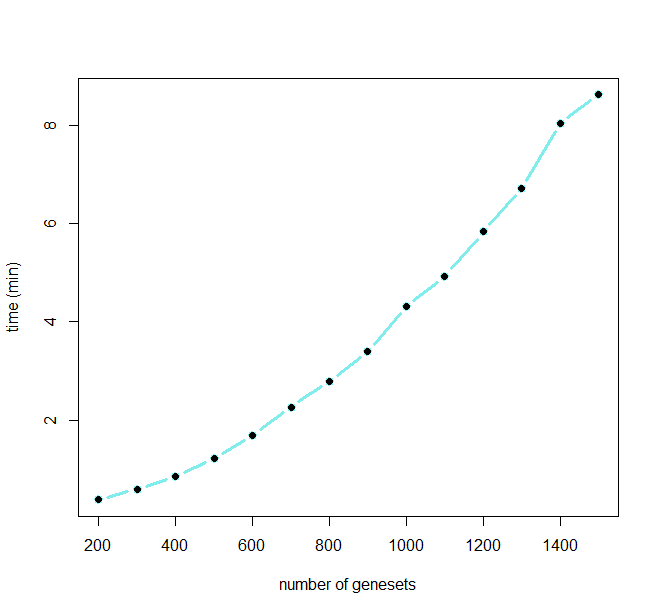
Running time of GScluster is shown below for different numbers of input gene-sets.

Contact: Dougu Nam (dougnam@unist.ac.kr)
Any feedback or comments are greatly appreciated!!