https://github.com/unixunion/solace-metrics-to-influxdb
realtime metrics dashboards for Solace Messaging Appliances
solace-dashboard server periodically polls SEMP and pushes the results over websocket to the HTML client dashboard application.
- custom metrics and config for handlers and view_formatting
- websocket based HTML client
- eventbus server responding to metrics requests
- graphs feature highly discernible colour schema
- individual vpn dashboards
- overview dashboard
- MaterializeCSS UI
- CanvasJS for graphing
- some degree of historical data persistence
- redundancy and events view
- custom javascript rendering into webapp template
- add top queues within a VPN to per-VPN dashboards
- add a solace JMS subscriber for appliance generated events
configuration is done on a per-verticle level. to pass config to the MonitorVerticle in the com.deblox.solacemonitor package, add a object like:
  ....
  ....
  "com.deblox.solacemonitor.MonitorVerticle": {
    "config": {
      "host": "solace",
      "username": "read_only_user",
      "password": "password",
      "uri": "/SEMP",
      "method": "GET",
      "convert_xml_response_to_json": true,
      ....
      ....
all configuring is done through conf.json, basically a metric is something you want to read from solace and put onto the eventbus. the HTML client subscribes to the eventbus on topics like "vpns", "stats", "queues" and "Some VPN Name"
a typical metric configuration contains:
| Name | Description |
|---|---|
| request | request to POST to the appliance, omit to disable |
| interval | the interval in ms to repeat requests and publish responses, omit to disable |
| config | specific metric's config |
the config options are:
| Name | Description |
|---|---|
| data_path | path hinting to aid the client javascript to extract the neccesary data points. |
| view | the name of the view |
| handler | the javascript function in the client that can handle the data and view |
the request is a string which is put into the request body.
e.g. <rpc semp-version=\"soltr/6_0\"><show><alarm></alarm></show></rpc>
millisecond interval to set the repeating timer for.
general config for the metric
the data_path is a "." separated string of object keys within the JSON response to the client. the client uses the data_path to reach the object which hold the keys and values of the desired object to graph. it is also used by the various view handlers which call shift_data javascript function in the client.
e.g. "rpc-reply.rpc.show.memory.physical-memory"
you can determin the data_path for a request by inspecting the raw responses from the queried appliance. e.g.
$> curl -d "<rpc semp-version=\"soltr/6_0\"><show><memory></memory></show></rpc>" -u "ro_user:ro_pass" "http://solace/SEMP
<rpc-reply semp-version="soltr/6_0">
  <rpc>
    <show>
      <memory>
        <physical-memory>
          <memory-info>
            <type>Memory</type>
            <total-in-kb>xxx</total-in-kb>
            <used-in-kb>xxx</used-in-kb>
            <free-in-kb>xxx</free-in-kb>
            <buffers-in-kb>xxx</buffers-in-kb>
            <cached-in-kb>xxx</cached-in-kb>
            ...
...the view is the name of a view as defined in the views section of the config.
e.g. `"generic_vpn_stats"
handler is the javascript function name in the HTML client which is capable of handling the particular response data. the javascript function needs to be imported in the scripts section of the index.html or similar mechanism.
e.g. "generic_handler"
within src/main/resources/webroot/js you can find handler javascript files, handlers take the JSON-ified responses from the MonitorVerticle and turn them into something plotable.
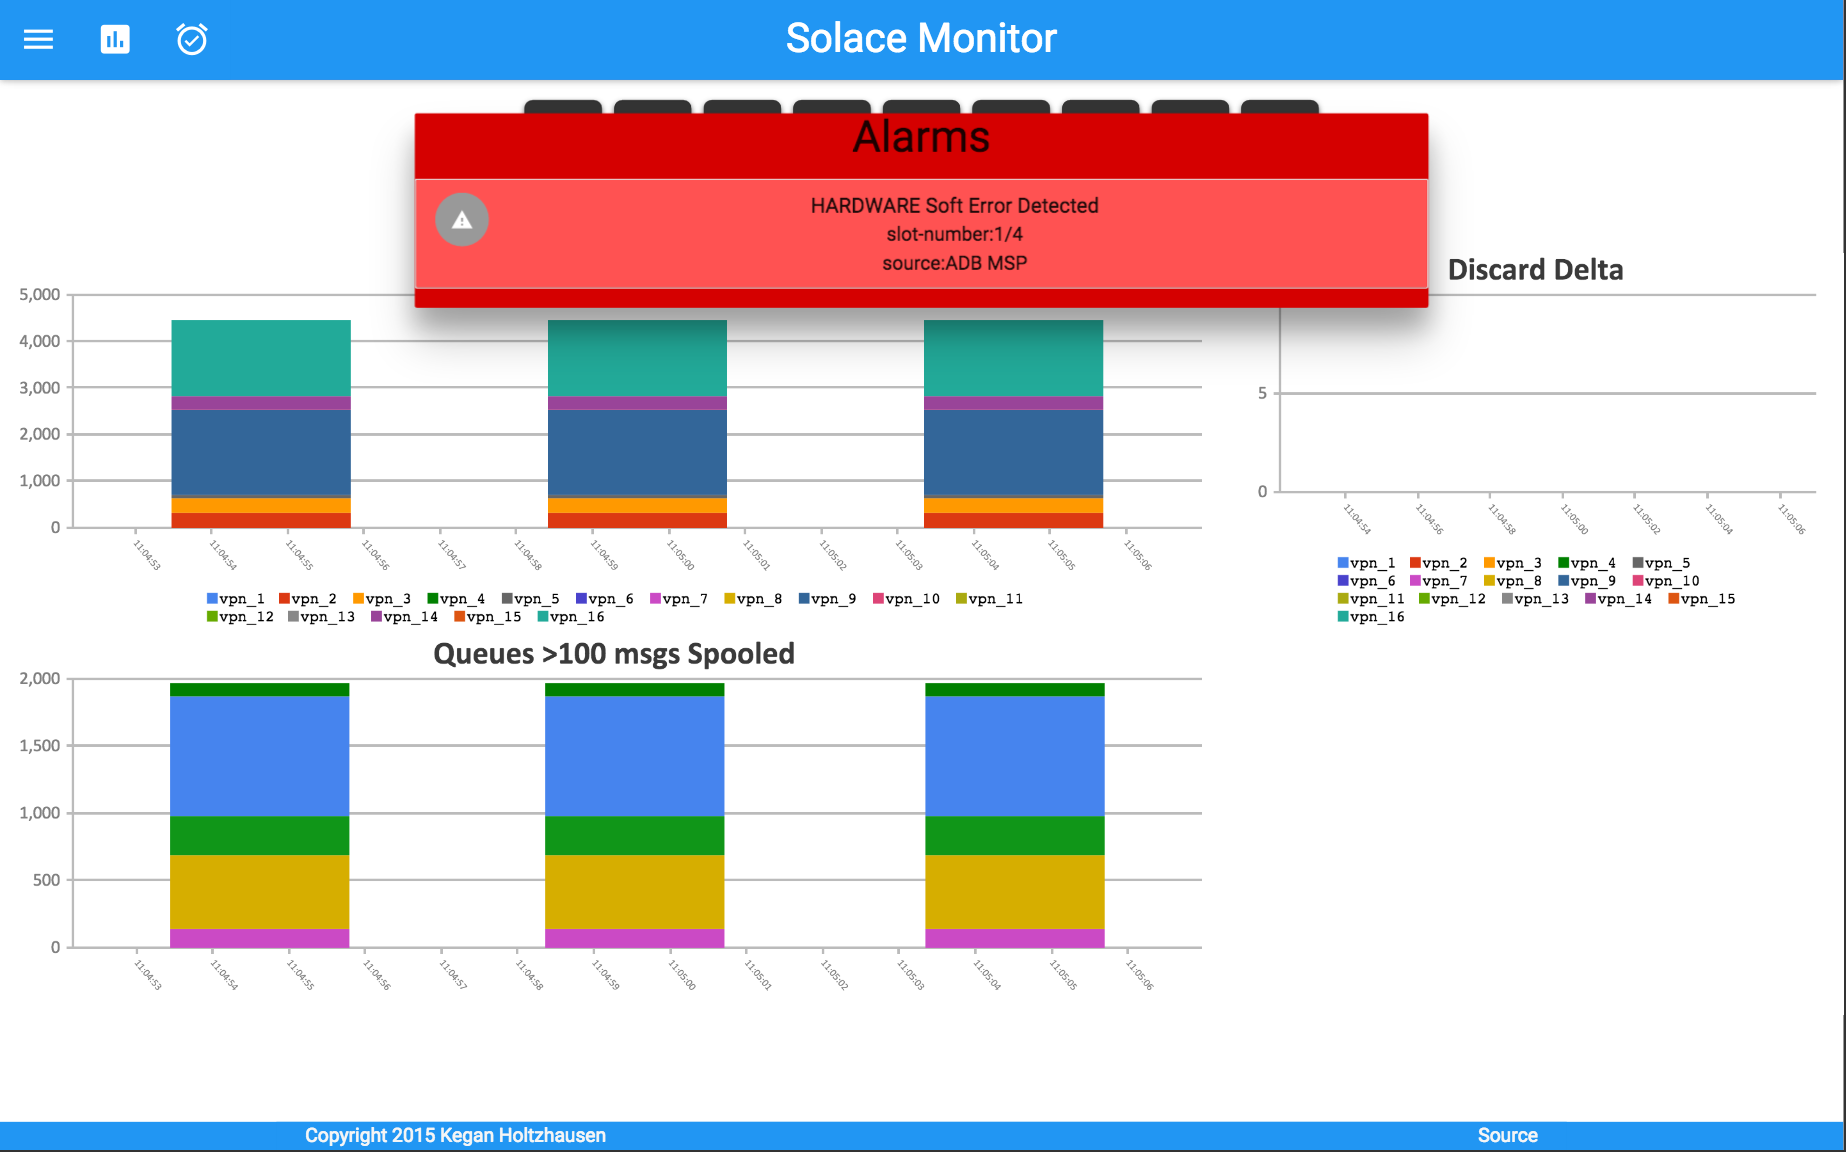
alarms handler is a special handler for reading alarm messages and triggering a MaterielizeCSS modal to display the alarms.
under development.
the generic_handler is capable of plotting a single object's keys and values. by that I mean the data_path must refer to a object with keys and values and NOT an array of objects.
example json
"memory": {
	"stats": {
		"free": 999999999,
		"used": 2132131231 ,
		"other": {
			"somekey": "somevalue"
		}
	}
}
in the case above, using the data_path memory.stats would make free, used and other available to the handler. the view specific config in the views section can also access the somekey value by specifying an addition data_path in the view's config.
under development.
currently only pulls the total msg's sent and received for use by the flipclock.
the vpns handler slightly different to the generic_handler in that it CAN handle a Array object.
core metrics named stats, queues and vpns MUST always be present since they control aspects of the default view.
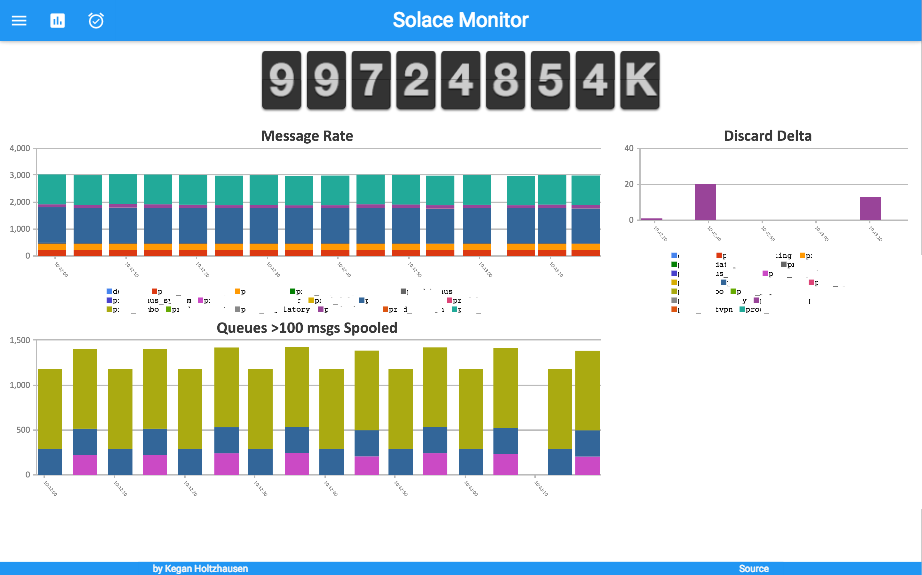
stats are total rate information for the appliance. this is currently only used by the flipclock.
vpns populates the rate-per-vpn graph on default view. these are stacked in the Message Rate graph to plot the total message rate.
queues populates the spool usage per-queue graph on the default view. the variable min_spool_plot in index.html hides queues which dont have more than N msg's in the spool.
for each vpn you want to create a dashboard for, you need to create a "metric" definition. e.g.
      "metrics" : {
        ...
        ...
        "Some Vpn": {
          "request": "<rpc semp-version=\"soltr/6_0\"><show><message-vpn><vpn-name>vpn_name_here</vpn-name><stats></stats></message-vpn></show></rpc>",
          "interval": 5000,
          "config": {
            "data_path": "rpc-reply.rpc.show.message-vpn.vpn.stats",
            "view": "generic_vpn_stats",
            "handler": "generic_handler"
          }
        },
        "Some Other VPN": {
          "request": "<rpc semp-version=\"soltr/6_0\"><show><message-vpn><vpn-name>another_vpn_name</vpn-name><stats></stats></message-vpn></show></rpc>",
          "interval": 5000,
          "config": {
            "data_path": "rpc-reply.rpc.show.message-vpn.vpn.stats",
            "view": "generic_vpn_stats",
            "handler": "generic_handler"
          }
        }
      }
views control what keys are extracted and graphed, the view describe the graphs to the javascript client which runs in the browser.
each key under show in the config element refers to a item in the JSON document at the data_path.
each view object is used by the specified handler in the metric config, so the handler's could potentially have different view configs. the generic_handler accepts the following keys:
- show
- chart_type
- div
- chart_length
- data_path
this is a JsonArray of key's whos values you want to plot. make sure that the values make sense on the same graph!
any of the supported chart_type arguments for canvasJs. examples are:
- area
- stackedColumn
- stackedColumn100
- stackedArea
- stackedArea100
- ...
the MaterializeCSS framework supports the standard 12-column system, index.html defines the following grid system.
| s12 / l8 | s12 / l4 |
|---|---|
| big | small |
| s12 / l4 | s12 / l4 | s12 / l4 |
|---|---|---|
| small-1 | small-2 | small-3 |
the number of samples to store in chart's data map. if you want a dashboard time window of the last 6 minutes, and are publishing metrics every 5 seconds, then use this formula:
(6 minutes * 60 seconds) / 5 seconds = 72 samples
data_path at this level specifies additional objects to descend into in compliment to the data_path already used at a metric level. see the example below.
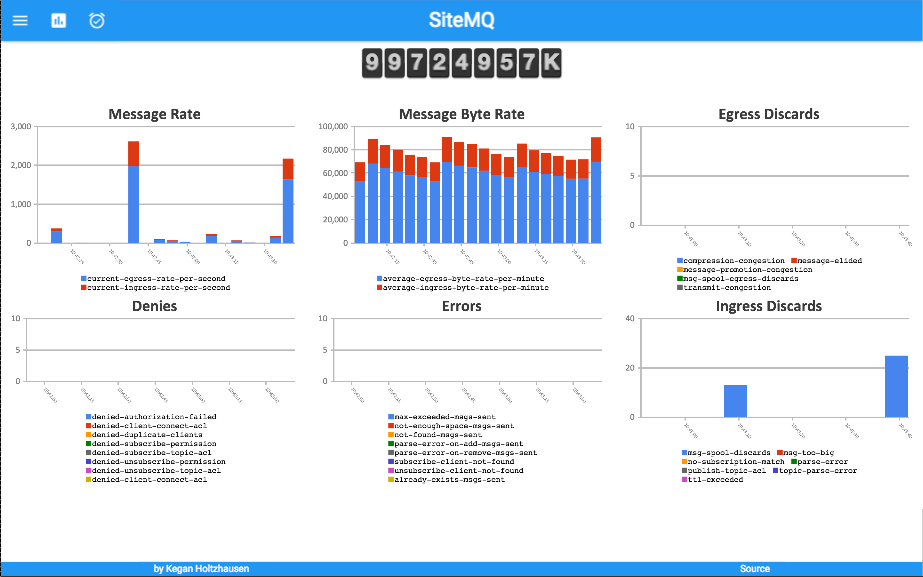
view config example showing how it all fits together.
      "views": {
        "default": {}, // a view who's handlers dont accept view config.
        "generic_vpn_stats": {
          "Message Rate": { // a human readable name for the chart
            "show": [
              "current-egress-rate-per-second",
              "current-ingress-rate-per-second"
            ],
            "chart_type": "stackedColumn", // canvasjs chartType
            "div": "charts-1", // div to place the chart in
            "chart_length": 20 // the chart length in samples
          },
          "Ingress Discards": {
            "show": [
              "msg-spool-discards",
              "ttl-exceeded"
            ],
            "counter": true, // these are counters
            "data_path": "ingress-discards", // the keys are in this sub object
            "div": "charts-3",
            "chart_length": 10
          },
	  ...
	  ...
post a JSON message to the /api/event uri, the body MUST contain:
- topic, the topic name to send the event to
- data, all the message contents should be in a 'data' key
the releaseboard can be used for displaying current release events. enable it in by turning on the following metric:
"releases": {
  "config": {
    "handler": "release_handler_v2"
  }
},
a special release_handler takes care of the processing of events. see the release_handler.js for specific documentation.
events all have codes which dictate the icon's and colorization within the UI. in general:
- 100 = blue
- 200 = green
- 300 = orange
- 500 = red
example of sending "release" events
./eventbus.py -e QA -p SomeProduct -v 1.4-123 -c 200 -s "Releasing Some Product"
./eventbus.py -e QA -p OtherProduct -v 1.0-1 -c 100 -s "Pending Approval"
the client is a HTML websocket application, which will connect to the SolaceMonitor verticle through the Server verticle and then download the configuration from the server. for each metric defined it will register a handler and a menu item.
the MonitorVerticle sends responses from to the client. the client then passes the message on to a handler as defined in the metric configuration. the handler is tasked with digging through the data and storing it in the "data" arrays.
the view configs are sent along with the response to the client to enable the client to plot the data as desired.
see the index.html for layout of MaterializeCSS divs.
metrics defined in conf.json are polled by the server and broadcast to their respective topics.
in addition to the periodic publishing of metrics, metrics can be requested from the MonitorVerticle via the eventbus, which is extended to HTML clients and other VertX.io verticles.
to make a request, send a message on the eventbus to the metrics topic e.g:
eb.send("metrics", "memory", req -> {
  // do something with the response
});
the gradle task shadowJar will build a executable jar
./gradlew shadowJar
when running as a fatJar, remember to specify the alternate logging implementation.
JAVA_OPTS="-Dvertx.logger-delegate-factory-class-name=io.vertx.core.logging.SLF4JLogDelegateFactory"
JAVA_HOME="/opt/jdk1.8.0_45"
$JAVA_HOME/bin/java $JAVA_OPTS -jar solace-dashboards-1.2.1-fat.jar -conf conf.json


