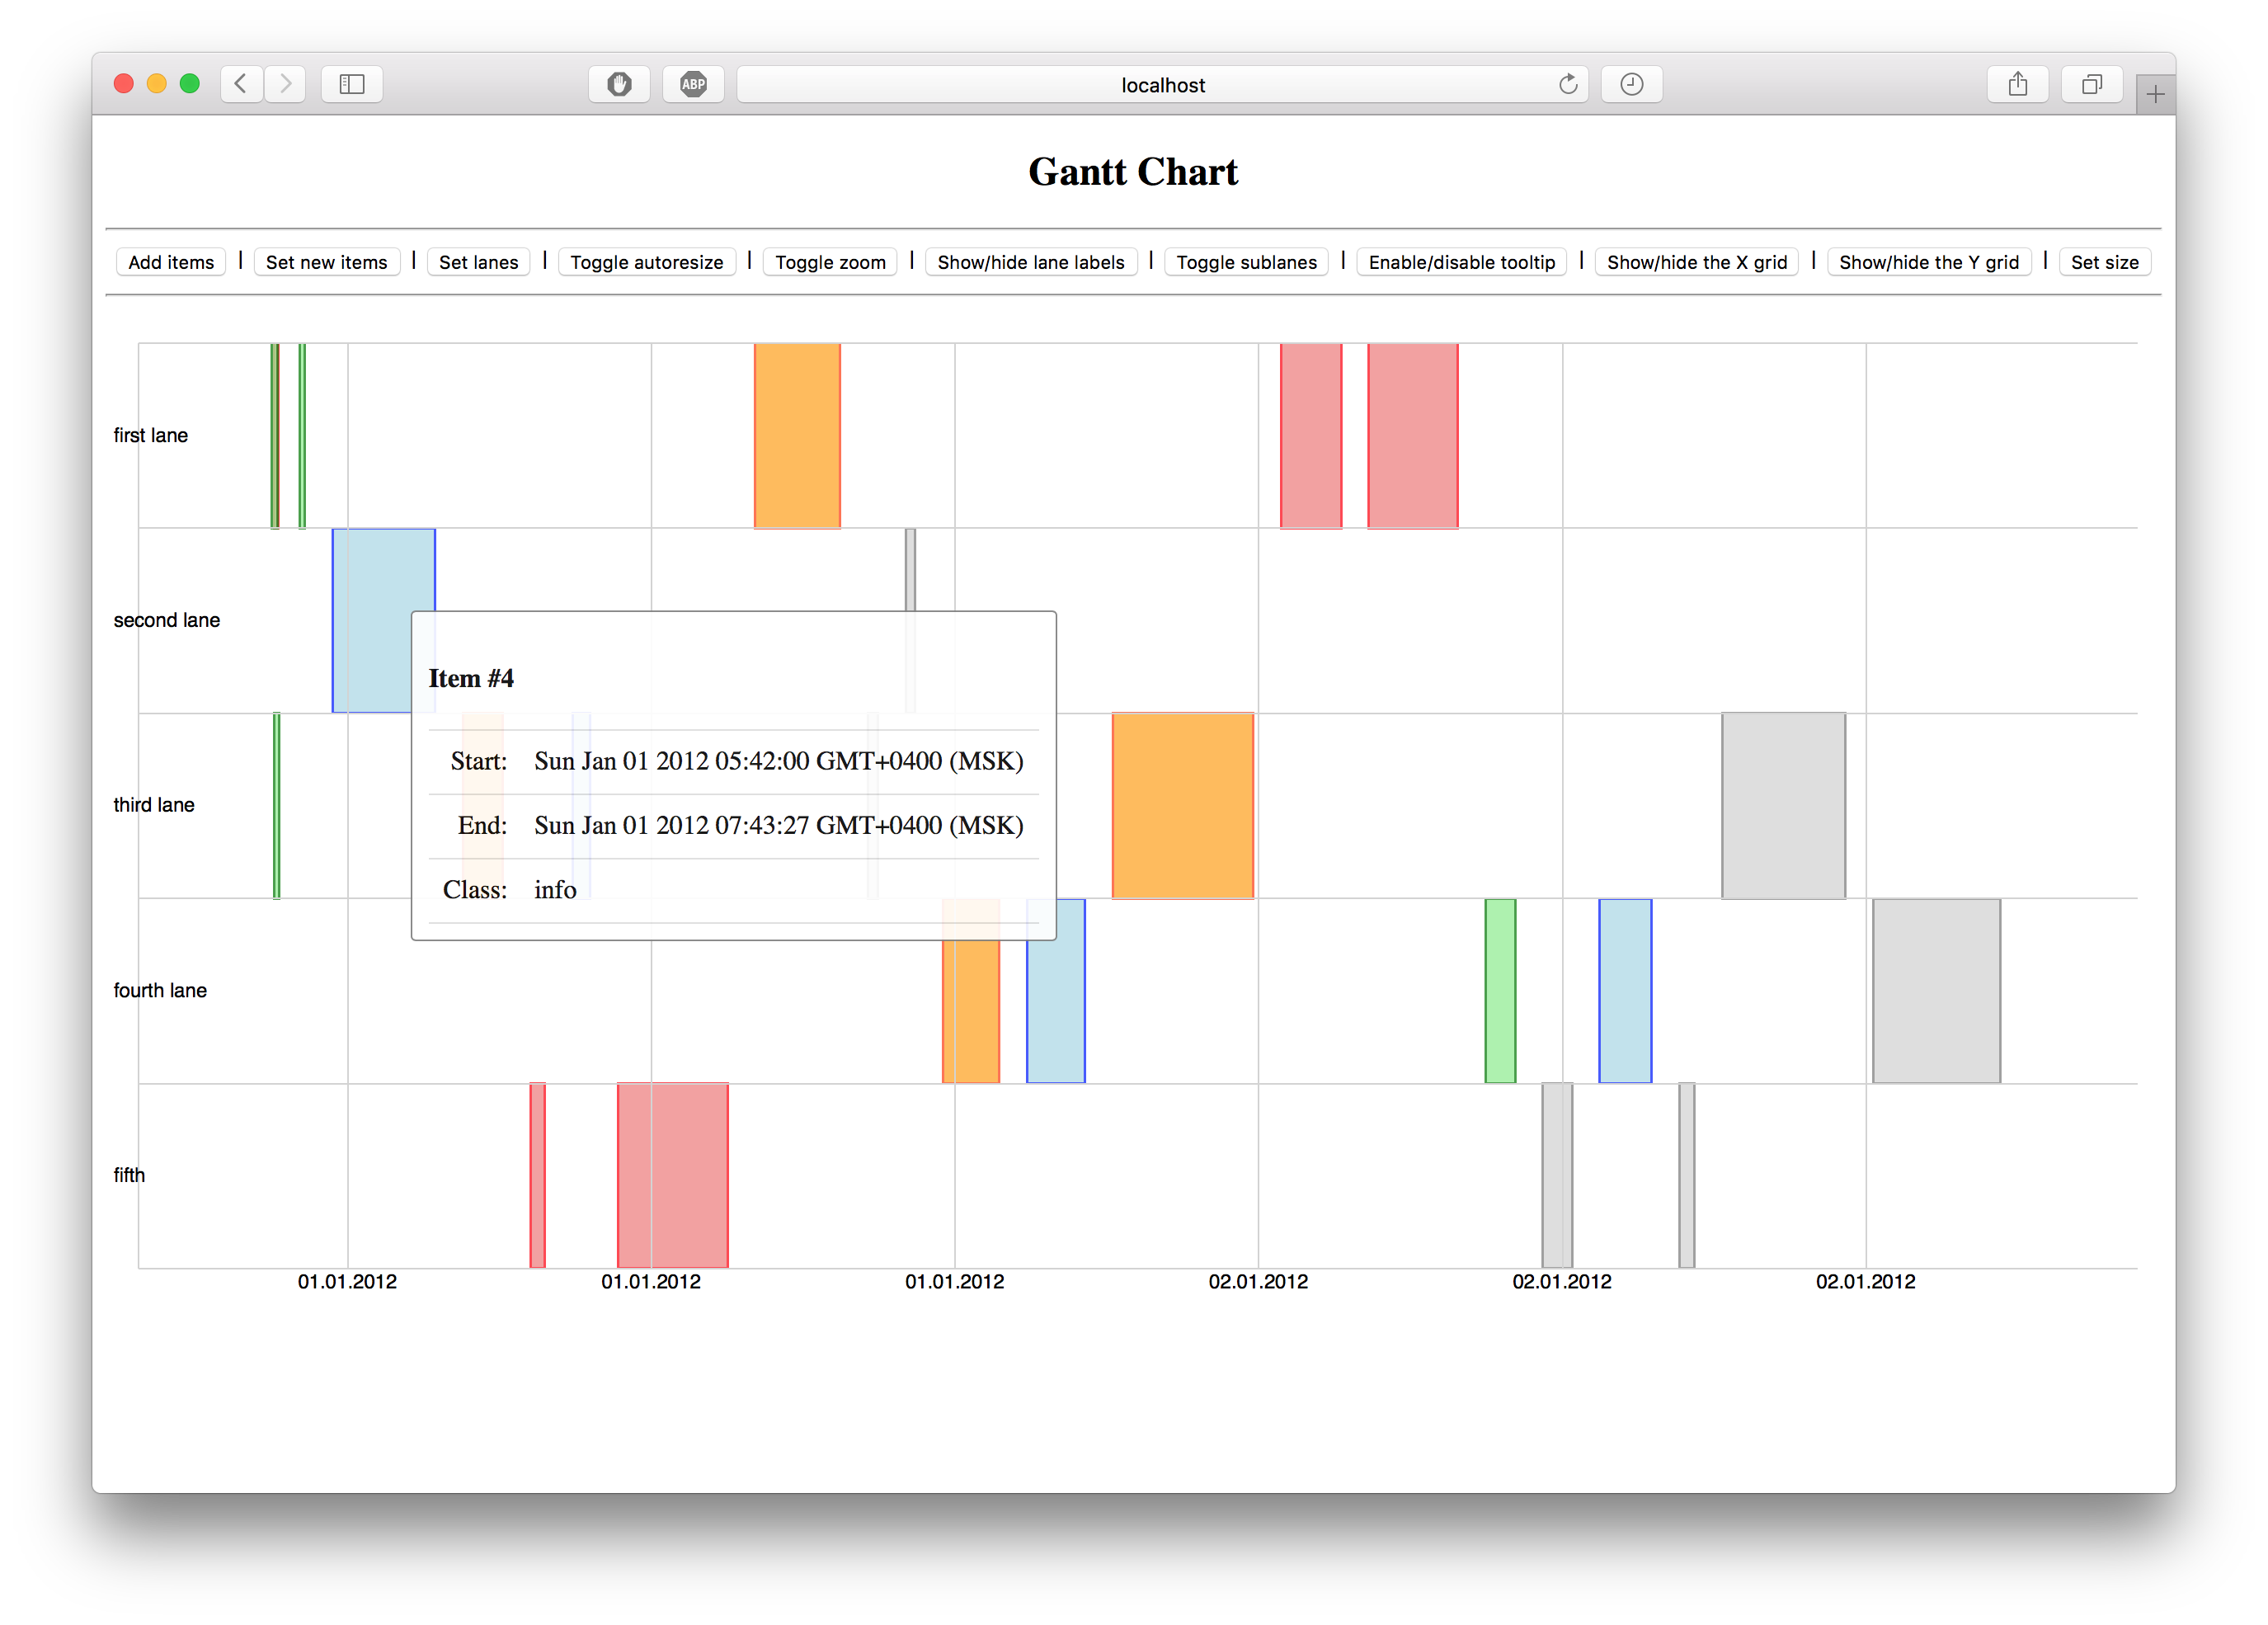
This is a simple Gantt chart based on D3.
Include files from dist folder into your html, for example:
<!-- style sheet -->
<link href="/static/gantt-chart/dist/css/gantt-chart.min.css" rel="stylesheet" type="text/css"/>
<!-- js -->
<script type="text/javascript" src="/static/gantt-chart/dist/gantt-chart.min.js"></script>To create an empty chart:
var gantt = ganttChart();By default the chart renders to the element with gantt_chart id:
<div id="gantt_chart"></div>You could use API to set the items, lanes, size, etc. For example:
gantt.autoresize(false)
     .enableTooltip(false)
     .enableZoom(false)
     .lanes(['first', 'second'])
     .margin(margin)
To create the chart with params:
var margin = {top: 0, right: 1, bottom: 2, left: 3},
    conf = {
        items: [],
        isAutoResize: false,
        isEnableDrag: false,
        isEnableTooltip: false,
        isEnableZoom: false,
        isShowXGrid: false,
        isShowYGrid: false,
        isShowLaneLabel: false,
        height: 240,
        lanes: [1, 2, 3],
        margin: margin,
        renderTo: 'body',
        width: 320,
    },
gantt = ganttChart(conf);Creates chart and returns gantt object.
Initial parameters could be provided through conf object, which has following attributes:
| Attributes | Type | Description |
|---|---|---|
items |
array |
array of items to append to the chart. |
isAutoResize |
boolean |
enables/disables autoresizing. |
isEnableDrag |
boolean |
enables/disables drag'n'drop. |
isEnableItemResize |
boolean |
enables/disables item's resize. |
isEnableTooltip |
boolean |
enables/disables showing of items tooltip. |
isShowXGrid |
boolean |
shows/hides X-axis grid. |
isShowYGrid |
boolean |
shows/hides Y-axis grid. |
isShowLaneLabel |
boolean |
show/hides lane's label. |
height |
number |
set the chart's height. |
lanes |
array |
array of lane's labels. |
margin |
object |
set the chart's margin. |
renderTo |
string |
element to render chart to. |
width |
number |
set the chart's width. |
Item object from items array has the following attributes:
| Attributes | Type | Description |
|---|---|---|
id |
number |
unique item's identificator. |
lane |
number |
number of lane where item should appear. |
start |
number |
define where item should start. number of milliseconds since 1 January 1970 00:00:00 UTC. |
end |
number |
define where item should end. number of milliseconds since 1 January 1970 00:00:00 UTC. |
tooltip |
string or function |
the tip that should be shown on item's click. |
class |
string |
item's css class. |
There is standard classes for items:
success- green color;danger- red color;info- blue color;default- gray color;warning- orange color;
Margin object has the following optional attributes:
| Attributes | Type | Description |
|---|---|---|
top |
number |
sets the top margin for the chart. |
right |
number |
sets the right margin for the chart. |
bottom |
number |
sets the bottom margin for the chart. |
left |
number |
sets the left margin for the chart. |
lanes is just array of strings.
ganttChart() returns gantt object with following API:
Adds the items to the current items and redraw the chart. Returns gantt object.
If boolean is specified, enables or disables autoresizing accordingly and returns gantt object.
By default, autoresizing is enabled.
If boolean is not specified, returns whether or not the autoresizing currently enabled.
If boolean is specified, enables or disables drag'n'drop items and returns gantt object.
By default, drag'n'drop is enabled.
If boolean is not specified, returns whether or not drag'n'drop currently enabled.
If boolean is specified, enables or disables item's resize and returns gantt object.
By default, item's resize is enabled.
If boolean is not specified, returns whether or not item's resize currently enabled.
If boolean is specified, enables or disables showing of item's tooltip accordingly and returns gantt object.
By default, tooltips is enabled.
If boolean is not specified, returns whether or not showing of item's tooltip currently enabled.
If boolean is specified, enables or disables zooming accordingly and returns gantt object.
By default, zooming is enabled.
If boolean is not specified, returns whether or not zooming currently enabled.
Shortcut for d3.select('svg.gantt-chart g.main');
If newItems is specified, sets the items, redraw the chart and returns gantt object.
If newItems is not specified, returns current items.
If newLanes is specified, sets the lanes and returns gantt object.
If newLanes is not specified, returns current lanes.
If newMargin is specified, sets the margin, resize chart and returns gantt object.
If newMargin is not specified, returns current margin.
If boolean is specified, shows or hides lane's labels accordingly and returns gantt object.
By default, lane's label is shown.
If boolean is not specified, returns whether or not lane's label currently shows.
If boolean is specified, shows or hides X-axis grid accordingly and returns gantt object.
By default, X-axis grid is shown.
If boolean is not specified, returns whether or not X-axis grid currently shows.
If boolean is specified, shows or hides Y-axis grid accordingly and returns gantt object.
By default, Y-axis grid is shown.
If boolean is not specified, returns whether or not Y-axis grid currently shows.
If width or height is specified, sets the svg size to the specified value and returns gantt object.
If width, height are not specified, returns the current svg size.
Shortcut for d3.select('svg.gantt-chart');
Redraw the chart.
Returns renderTo attribute.
Resize the chart.
Returns the X axis.
Returns the X scale.
Returns the Y axis.
Returns the Y scale.
Returns zoom behavior.
If you have an improvement, bug report or request please let me know or post a pull request.
See how to run app locally.
See how to run test.
This software is provided free of change and without restriction under the MIT License
