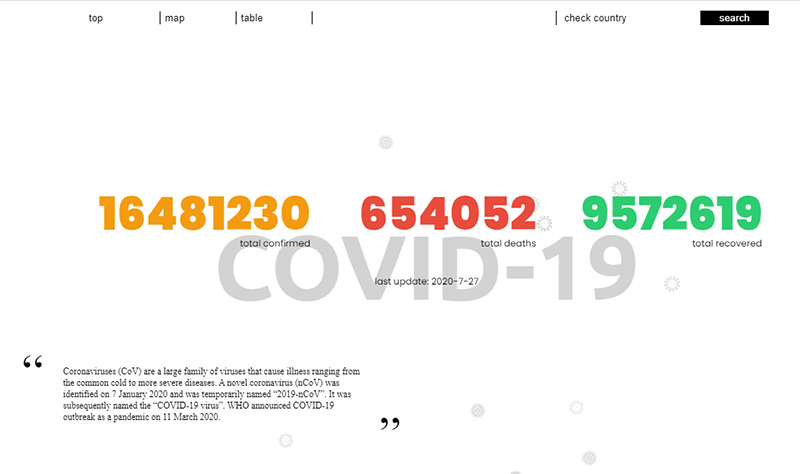
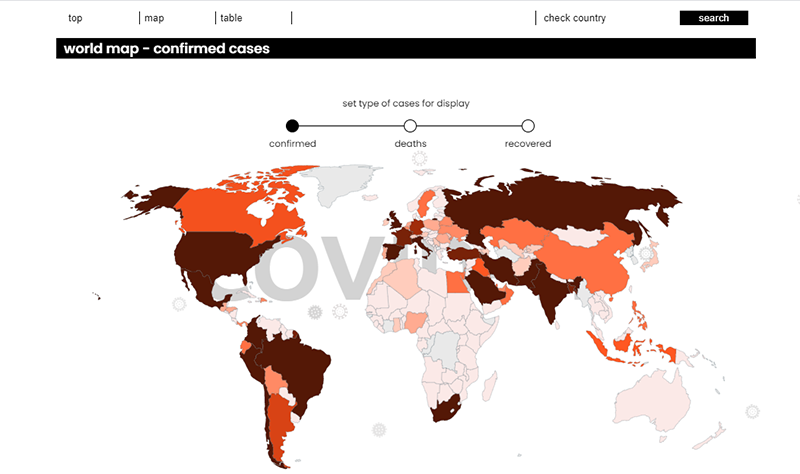
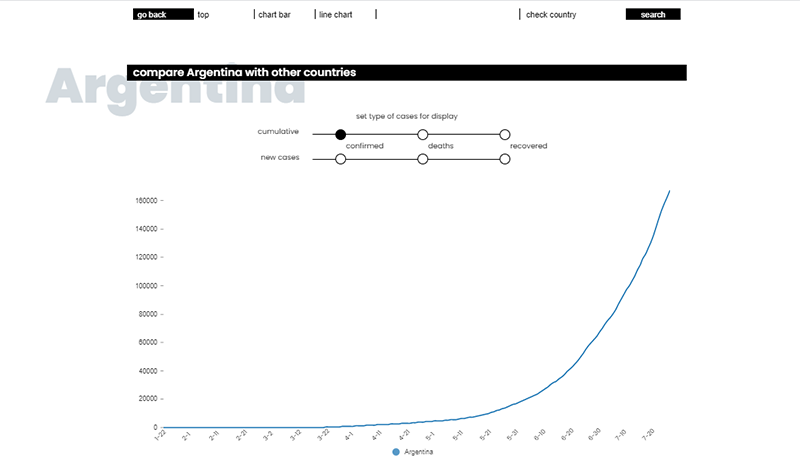
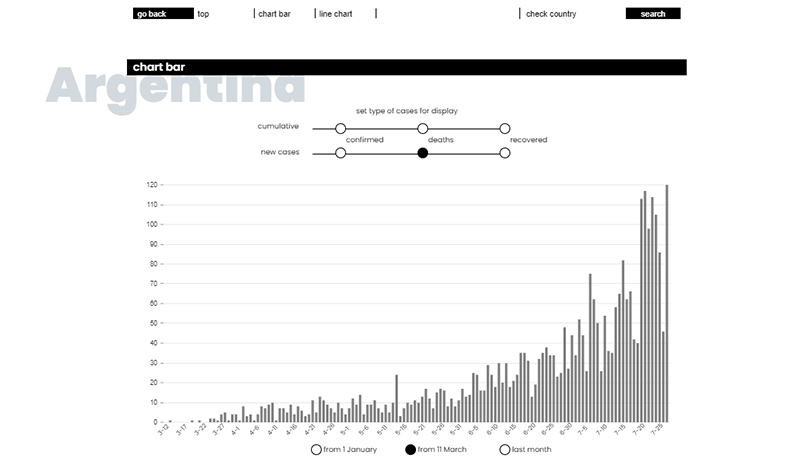
This app show statistics related with COVID-19. There are two pages:
global page- where you can find and compare data for whole world. Scroll down (or click navigation button) for map chart and table. Click on the map, or write country name inside input to go to the country page.country page- here you have statistics for selected country. Data are presented on chartbar and linechart. click buttons to change data as below: --confirmed(all confirmed cases found from beggining) --deaths(all deaths cases found from beggining) --recovered(all recovered cases found from beggining) --new confirmed(new confirmed cases for a day) --new deaths(new deaths cases for a day) --new recovered(new recovered cases for a day) On line chart you can also choose another country to compare.
All COVID data based on Covid19 GraphQL API
Animations based on GSAP library
This project uses saas and node-saas and css modules to handle styling: src/global_styles/global.scss defines the styling base for multiple components and src/global_styles/variables.scss define css variables for project.
react: version 16.13.1react-apollo: version 3.1.5react-gsap: version 2.2.1react-router-dom: version 5.2.0react-scripts: version 3.4.1typescript: version 3.2.1nivo: version 0.31.0graphql: version 15.0.0saas: version 1.3.0node-sass: version 4.14.1apollo-client: version 2.6.8moment: version 2.25.3
- Clone the repo in your terminal by clicking the green clone or download button at the top right and copyin the url
- In your terminal, type
git clone URL- replace URL with the url you copied
- hit enter
- This will copy all the files from this repo down to your computer
- In your terminal, cd into the directory you just created
- Type
npm installto install all dependencies - Last, but not least, type
npm startto run the app locally. - To look at the code, just open up the project in your favorite code editor!a


