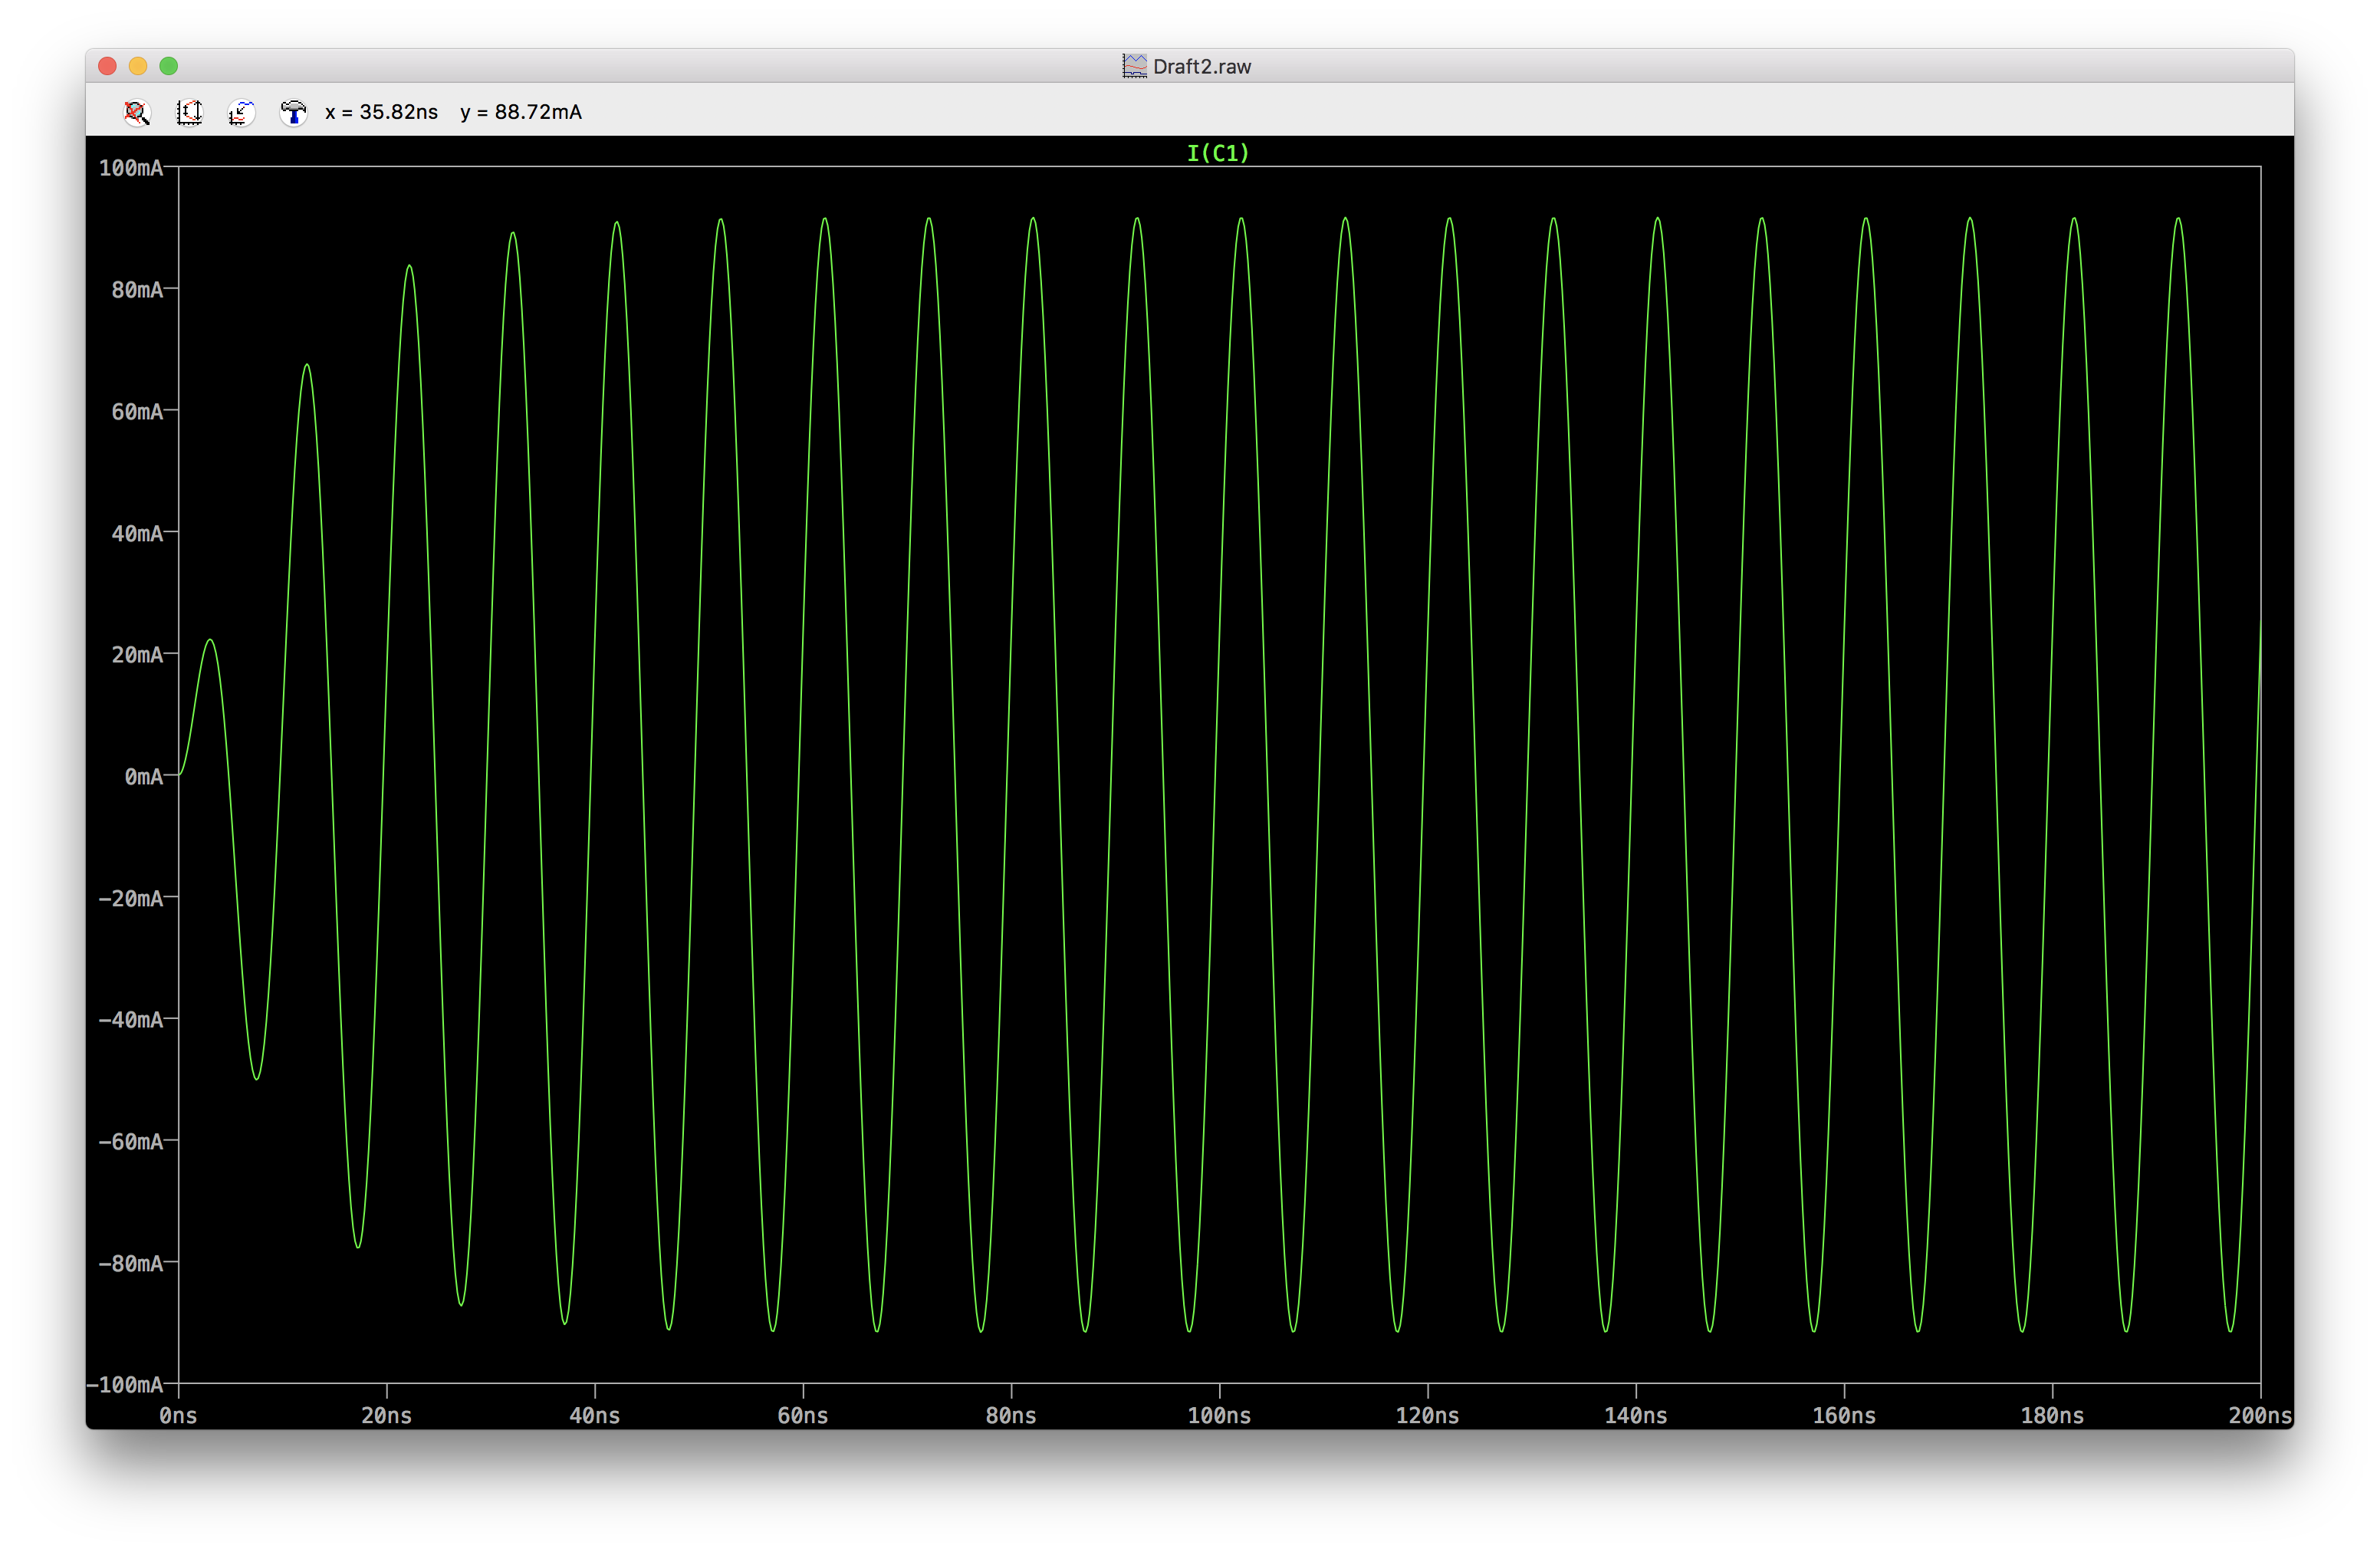
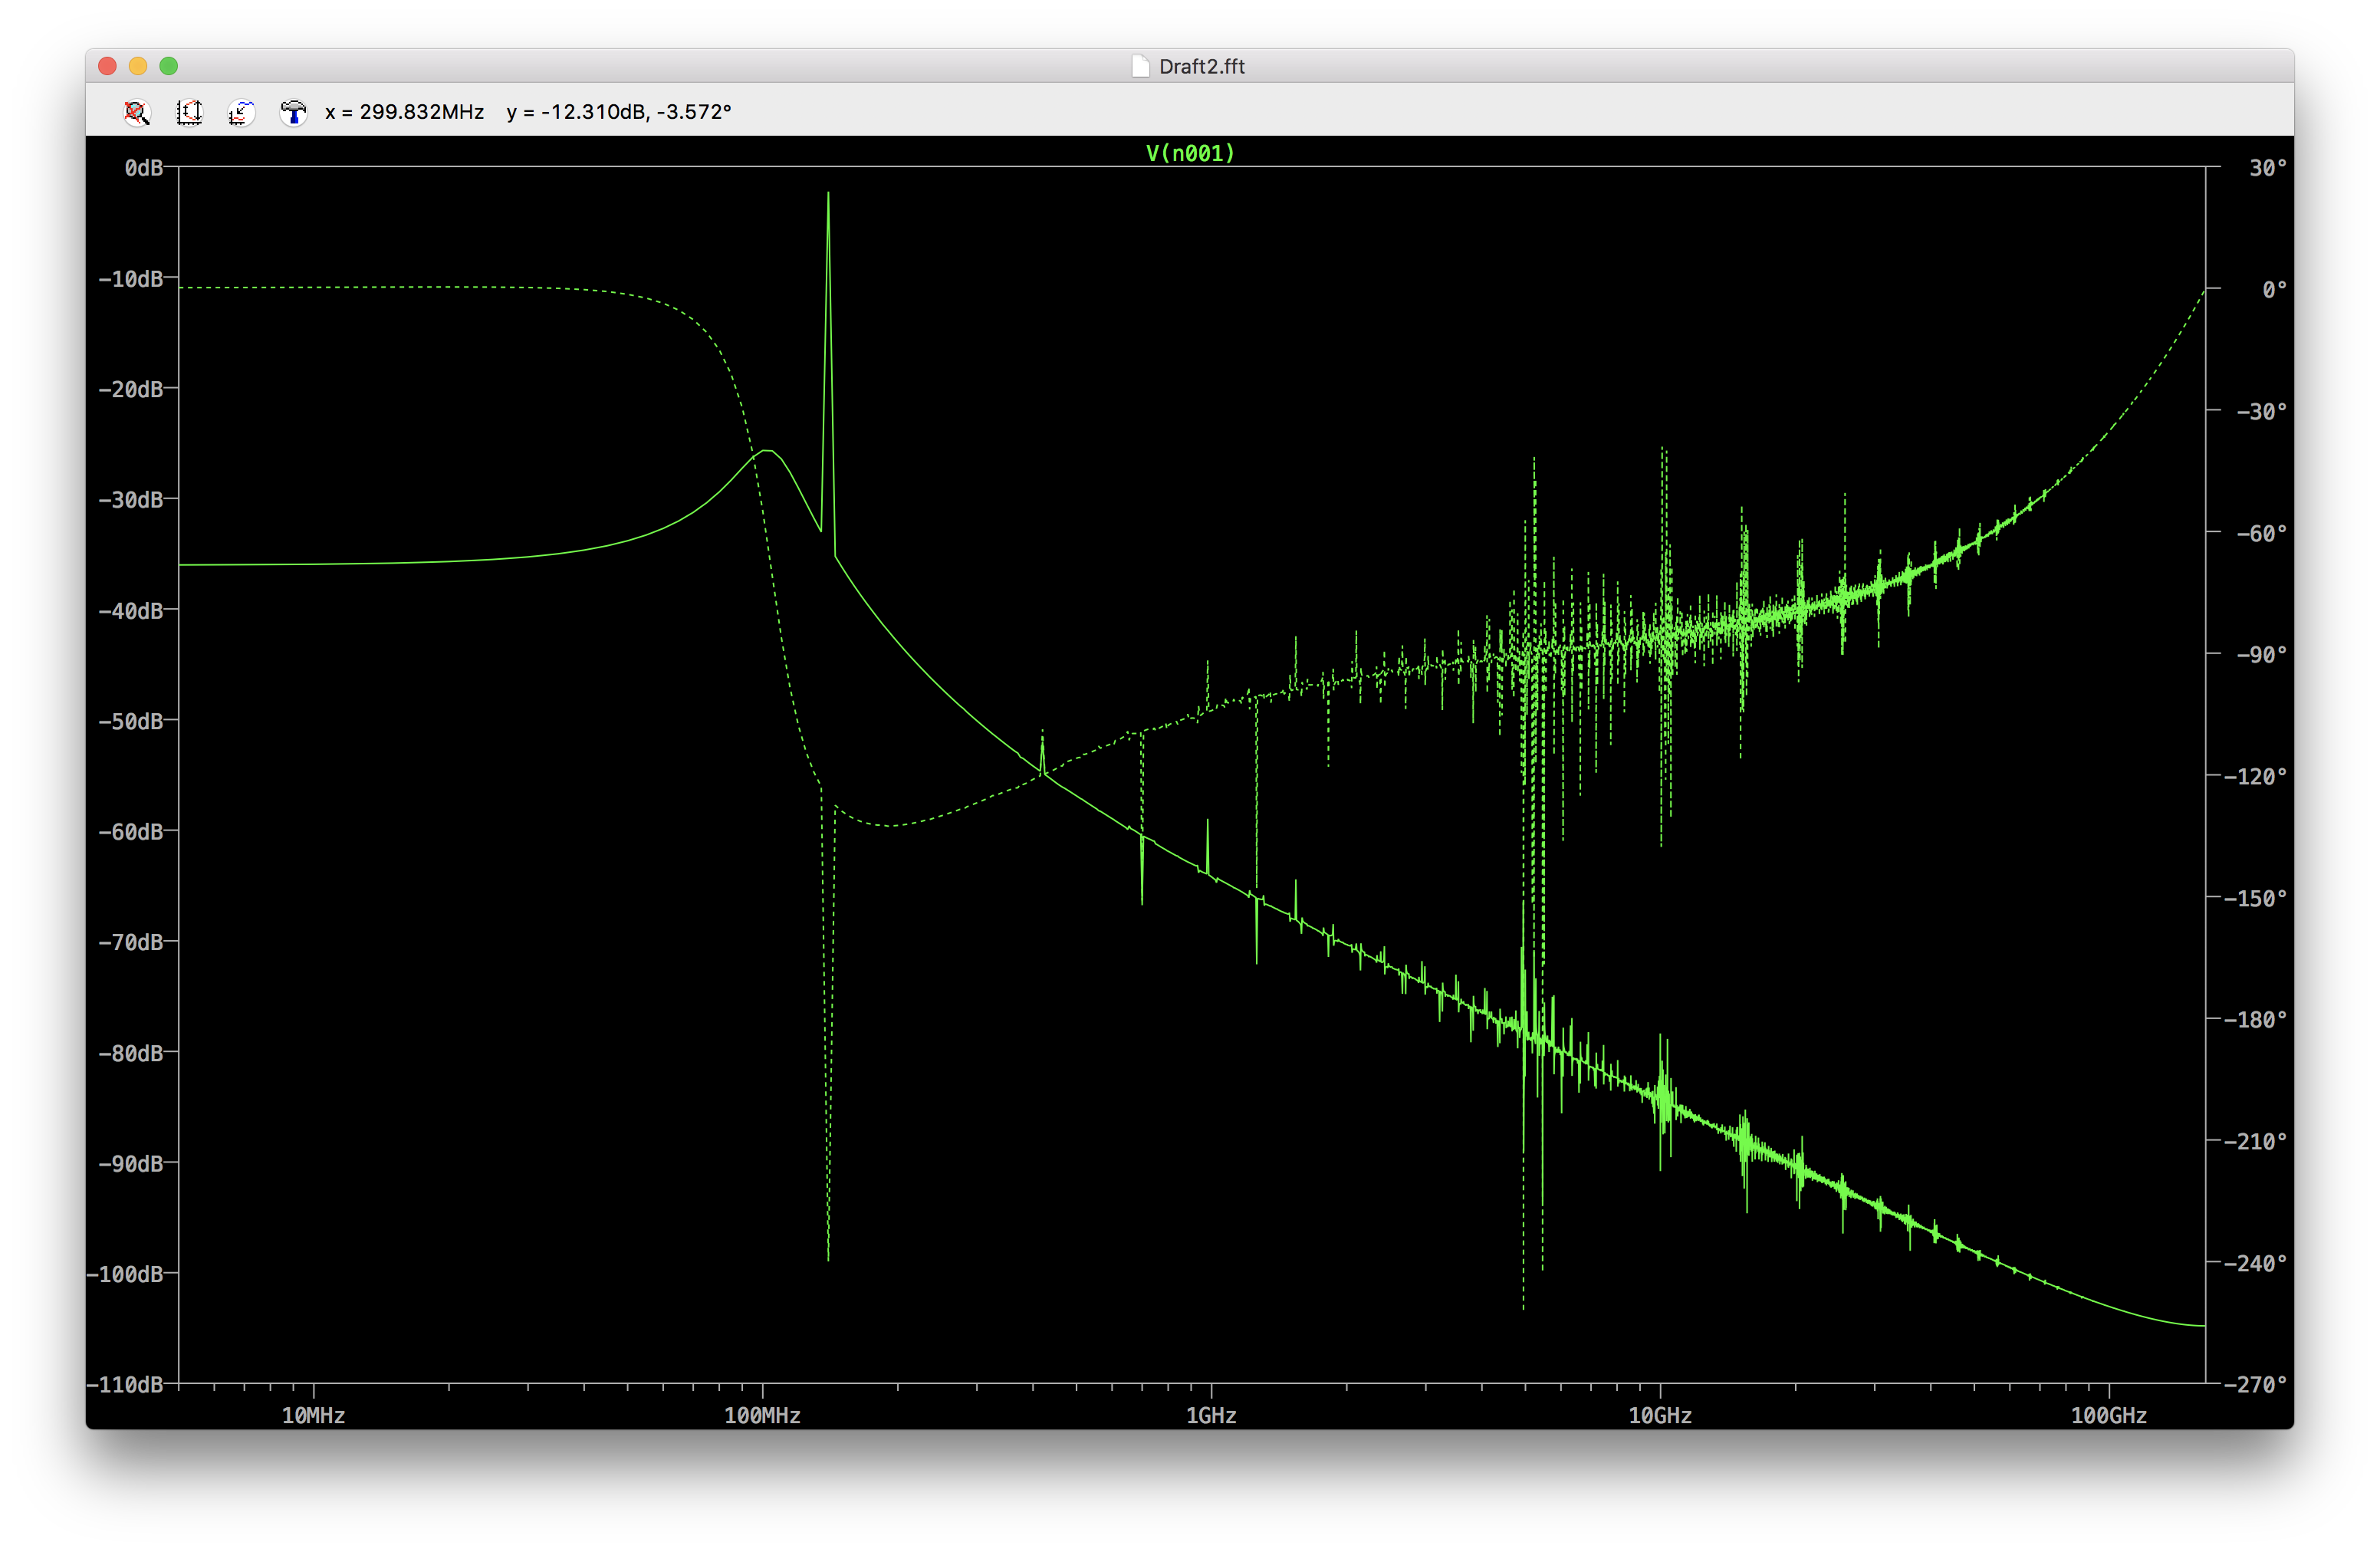
This code snippet allows exporting an LTspice plot to Python and visualize it using Matplotlib.
This transposition is useful because it allows further manipulation over the dataset, which turns out to be often intricate within LTspice itself.
Once exported the data from LTspice in a .txt file, just type:
python plot_LTspice.py dataset/dataset/Draft2.txtMake sure to export the data as (re,im) and not (mag, arg) although the final plot will be of course a polar plot. Save the dataset as a .txt file as well – (actually .fft.txt) and type:
python plot_LTspice_fft.py dataset/dataset/Draft2.fft.txtto visualize the plot.

