IFermi is a package which provides tools for plotting Fermi surfaces from DFT output. IFermi is also useful for visualisation of slices of the three-dimensional Fermi surface along a specified plane. The idea is to provide tools which allow for more tailored Fermi surface plots than what is currently offered by other packages.
The main features include:
-
Plotting of three-dimensional Fermi surfaces, with interactive plotting supported by mayavi, plotly and matplotlib (see recommended libraries below).
-
Taking a slice of a three-dimensional Fermi surface along a specified plane and plotting the resulting contour.
-
Identification and visualisation of vanishingly small Fermi surfaces
- useful in the identification of Dirac points.
- requires a DFT scf calculation on a more fine k-mesh
Notes about the use of external libraries:
- VASP calculations are imported using Pymatgen_.
- Band interpolation is carried out using BoltzTraP2_
- Plotting is supported in Mayavi_, Plotly_ and Matplotlib_.
- I reccomned using Mayavi_ or Plotly_ for three-dimensional Fermi surface visualisation, and Matplotlib_ for two plotting two-dimensional slices.
The code currently primarily supports VASP calculations, but will soon be extended to other platforms supported by Pymatgen_ (Quantum Espresso, Questaal, etc.)
IFermi is made up of a number of classes for building and plotting Fermi surfaces. This includes:
FermiSurface: stores isosurfaces at the Fermi-level for use in plotting, as well as other useful structural information.Interpolator: Takes band energies and interpolates them to a finer k-mesh.FSPlotter: Given a FermiSurface object, produces an interactive plot.
A minimal working example for plotting the 3d Fermi surface of MgB2 from a vasprun.xml file is:
from ifermi.interpolator import Interpolater
from ifermi.fermi_surface import FermiSurface
from ifermi.plotter import FSPlotter

from pymatgen.io.vasp.outputs import Vasprun
from pymatgen.electronic_structure.core import Spin

# load the vasprun and get a band structure object
vr = Vasprun("examples/MgB2/vasprun.xml")
bs = vr.get_band_structure()

# increase interpolation factor to increase density of interpolated bandstructure
interpolater = Interpolater(bs)
interp_bs, kpoints_dim = interpolater.interpolate_bands(10)

# get the fermi surface from the band structure for the Wigner-Seitz cell
# using the Spin up channel
fs = FermiSurface.from_band_structure(
    interp_bs, kpoints_dim, wigner_seitz=True, spin=Spin.up
)

plotter = FSPlotter(fs)
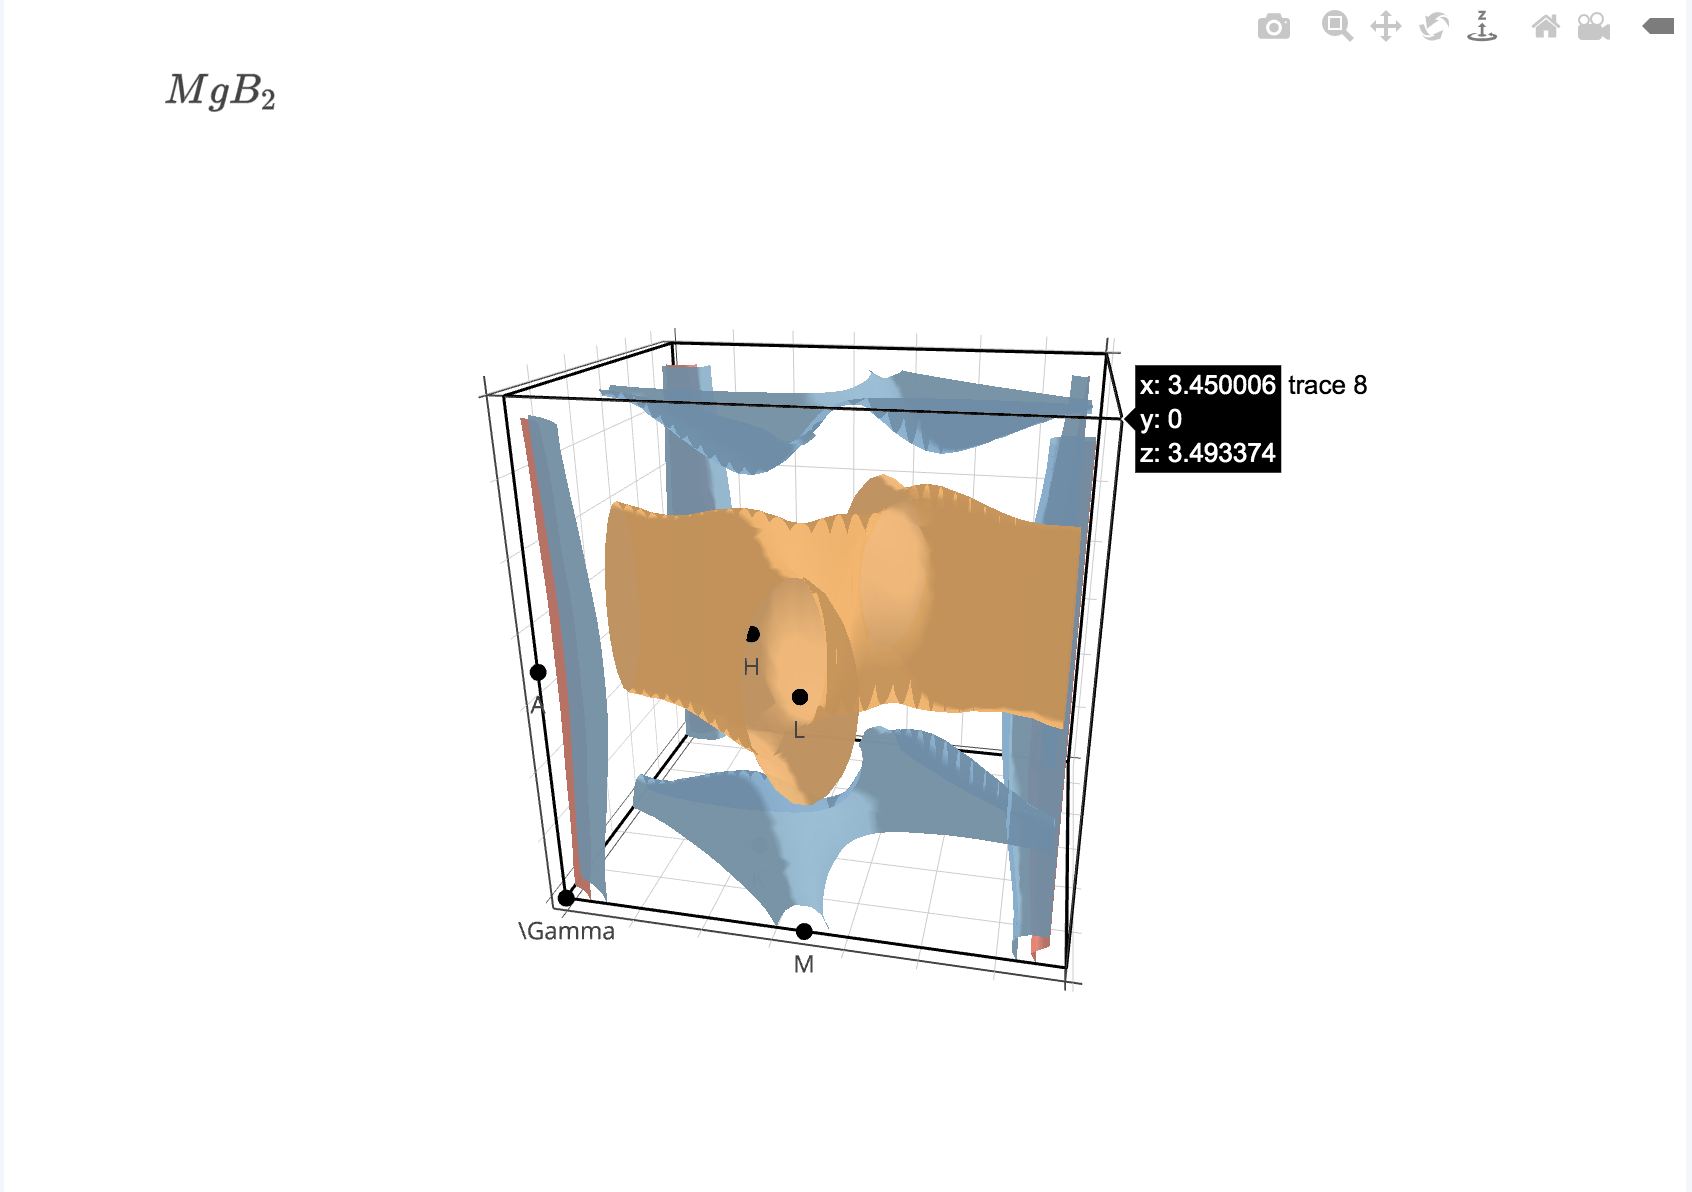
plotter.plot(plot_type='mayavi')An example of the output generated by IFermi for MgB2 is shown below:
IFermi is currently compatible with Python 3.5+ and relies on a number of open-source python packages, specifically:
If you think that the code could use some improvement or added functionality, send a push request to the GitHub page. I would greatly appreciate any contributions.
IFermi is made available under the MIT License.
Alex Ganose for help developing/improving code. Sinead Griffin for suggesting the project.
