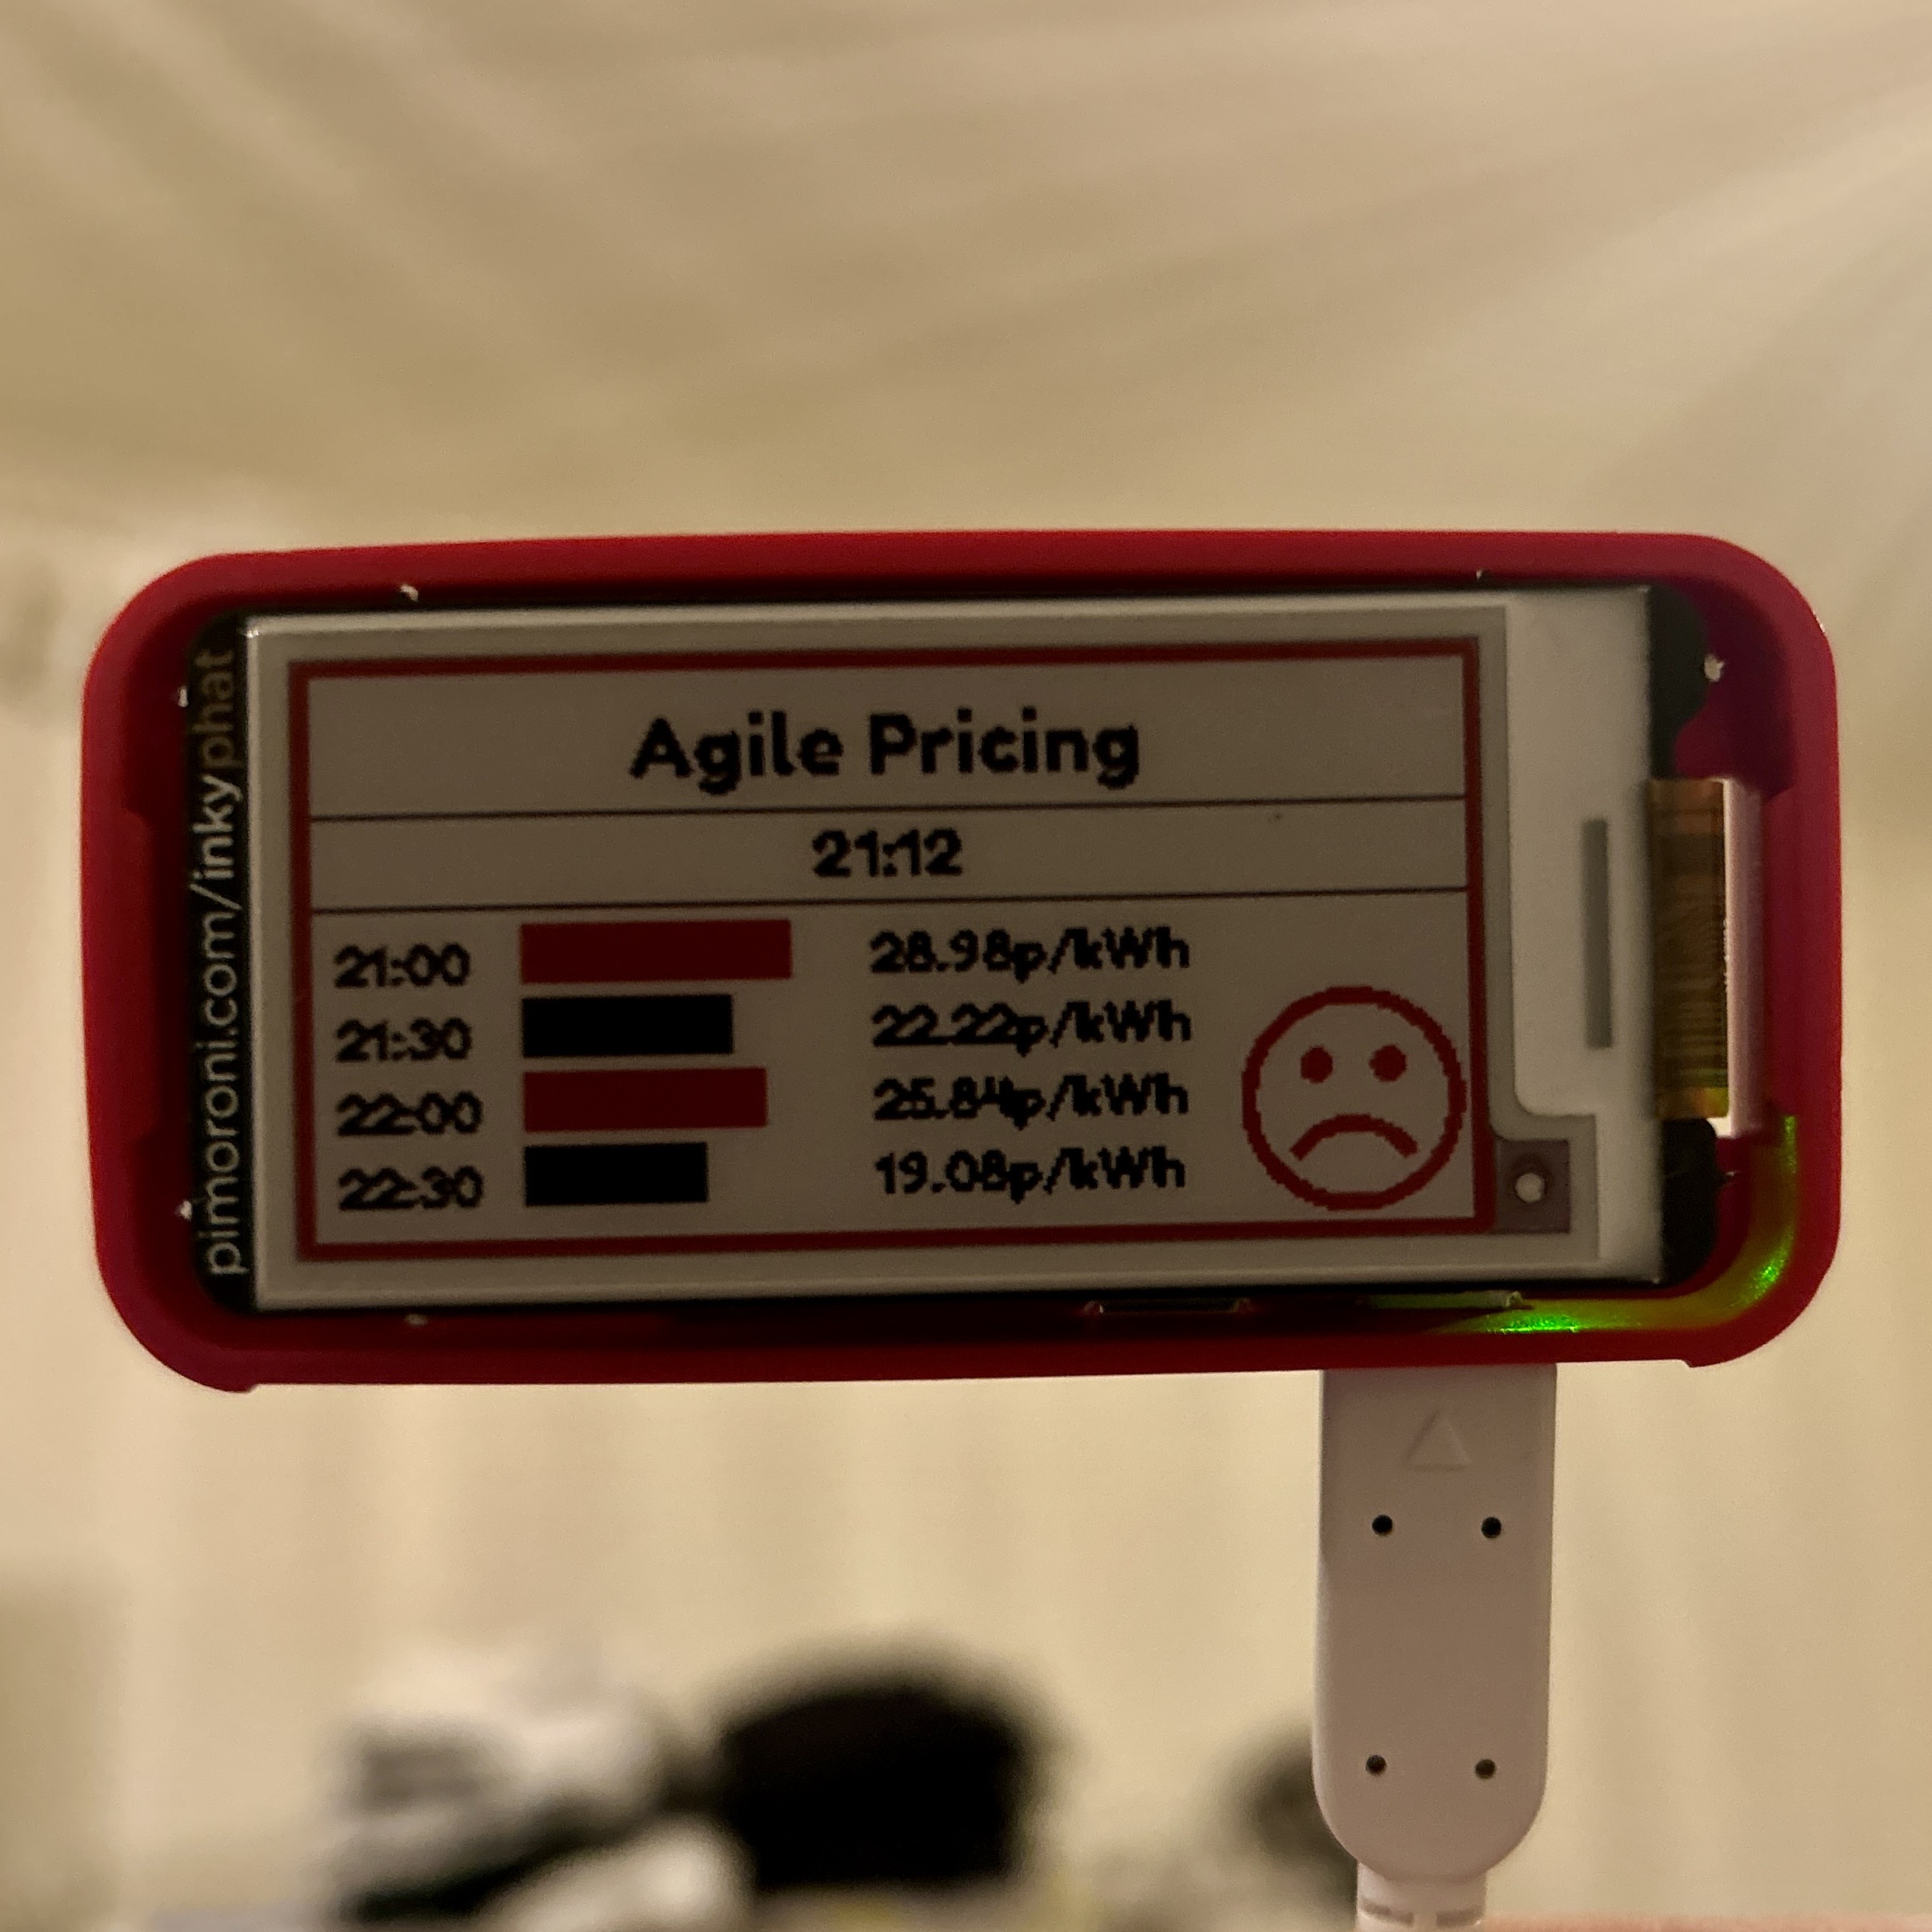
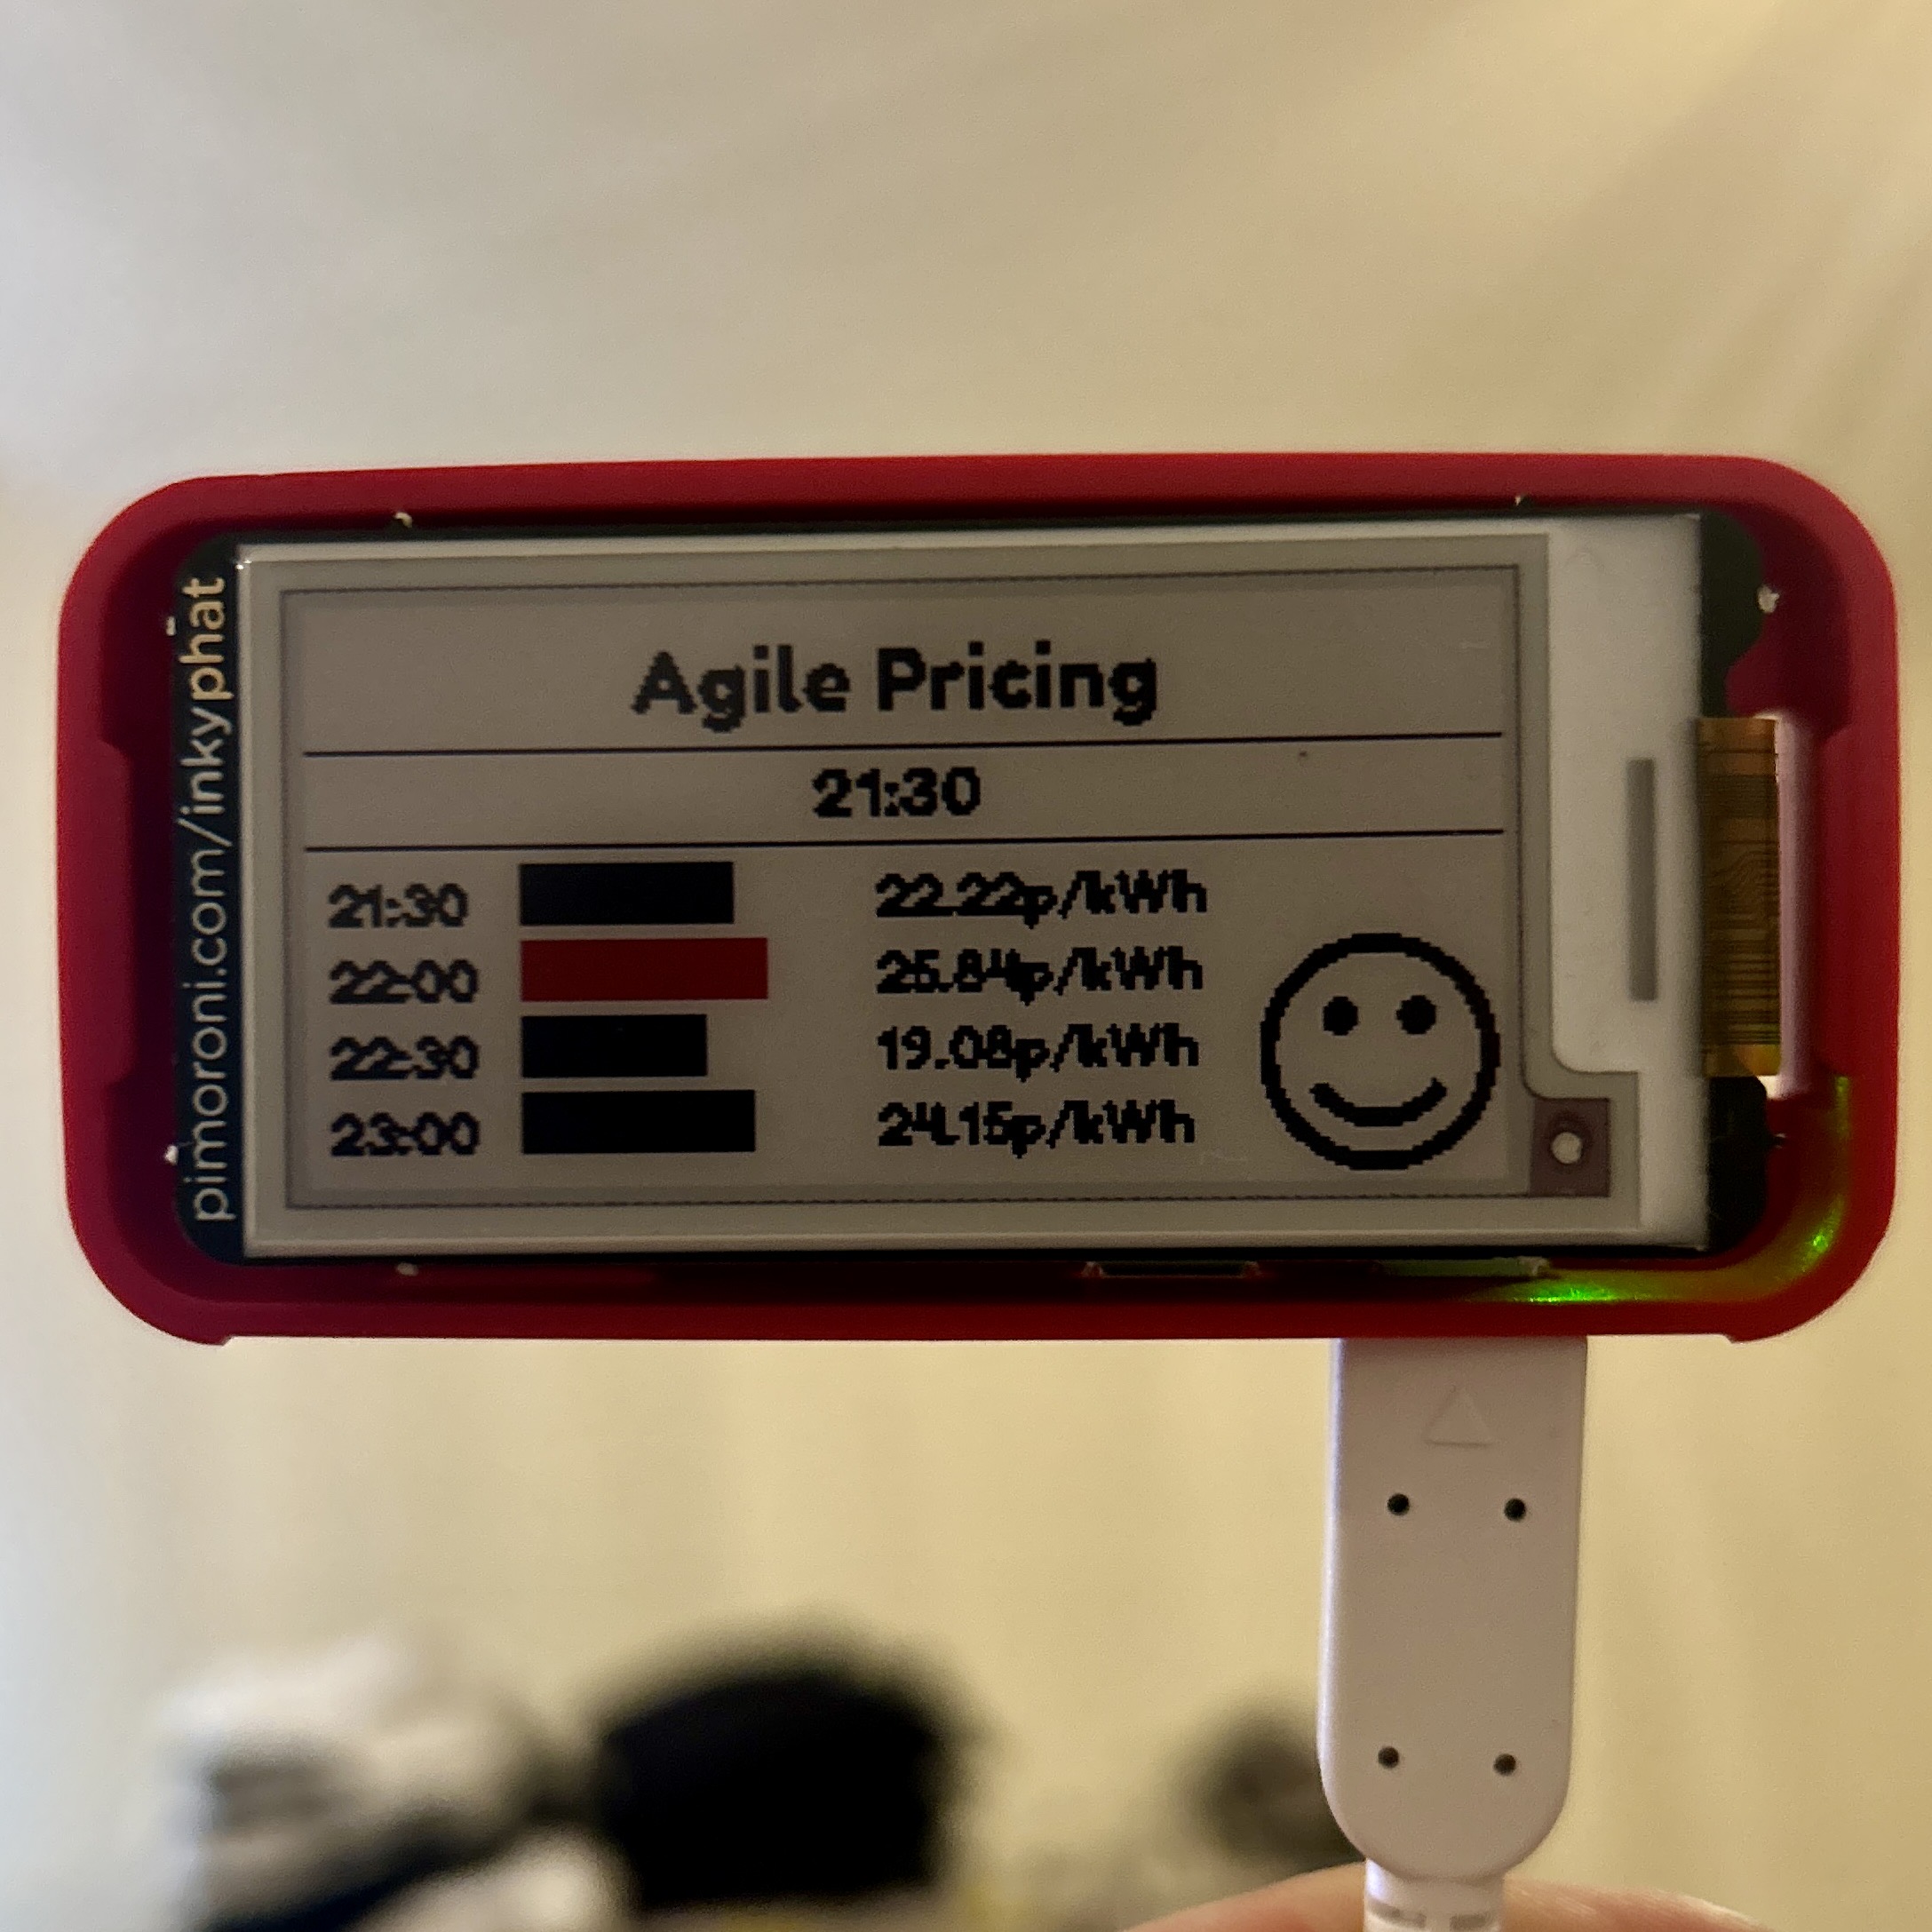
This project displays the current and next three Octopus Agile pricing slots for electricity consumption on an InkyPHAT display, along with a smiley or frowning face to indicate whether the current pricing is below or above a red price threshold. The pricing data is fetched from the Octopus Energy API.
To use this project, you will need a Raspberry Pi Zero and an InkyPHAT display. If you don't already have these, you can purchase them from the Pimoroni website:
To run this project, you will need:
- An InkyPHAT display
- A Raspberry Pi with Raspbian OS installed
- Python 3
- Clone this repository to your Raspberry Pi:
git clone https://github.com/vRobSmith/Octopus_Agile.git- Install the required Python libraries:
pip install -r requirements.txtTo run the program, simply execute the following command from the terminal:
python agile-pricing-display.pyThere are a few options that can be customized in the code:
font_path: The path to the font file used to display text on the InkyPHAT. By default, this is set to "/usr/share/fonts/truetype/dejavu/DejaVuSans-Bold.ttf".color: The color of the text and shapes displayed on the InkyPHAT. By default, this is set to "black".url: The API endpoint to fetch pricing data from. By default, this is set to "https://api.octopus.energy/v1/products/AGILE-18-02-21/electricity-tariffs/E-1R-AGILE-18-02-21-L/standard-unit-rates/". To change the region letter in the URL, modify theLinE-1R-AGILE-18-02-21-Lto the appropriate region letter for your location. For example, if you are in the "J" region, the URL should be "https://api.octopus.energy/v1/products/AGILE-18-02-21/electricity-tariffs/E-1R-AGILE-18-02-21-J/standard-unit-rates/".tz: The timezone used to display the valid_from times. By default, this is set to "Europe/London".max_price: The maximum price used to calculate the width of the proportional bar graph. By default, this is set to 35.max_bar_width: The maximum width of the proportional bar graph. By default, this is set to 70.red_price_threshold: The price threshold in pence per kilowatt hour (p/kWh) above which the border color and frowning face are displayed. By default, this is set to 25.
To change any of these options, simply modify the corresponding value in the code and save the file.
To automatically run the program on boot and at regular intervals, you can set up a cron job on your Raspberry Pi.
- Open the crontab editor by running the following command:
crontab -e- Add the following line to run the program on boot:
@reboot sleep 10; /usr/bin/python3 /path/to/agile-pricing-display/agile-pricing-display.py
Make sure to replace /path/to/agile-pricing-display/ with the actual path to the directory where the agile-pricing-display.py file is located.
- Add the following line to run the program every 30 minutes:
*/30 * * * * sleep 5; /usr/bin/python3 /path/to/agile-pricing-display/agile-pricing-display.py
The sleep 5 command ensures that the correct pricing window is displayed by allowing a 5-second delay between each run of the program. This is necessary because the program fetches the next four pricing slots, including the ongoing slot, and displays them on the InkyPHAT. Without the delay, there is a possibility that the program will display the incorrect pricing window.
This work is licensed under a Creative Commons Attribution-NonCommercial 4.0 International License.
