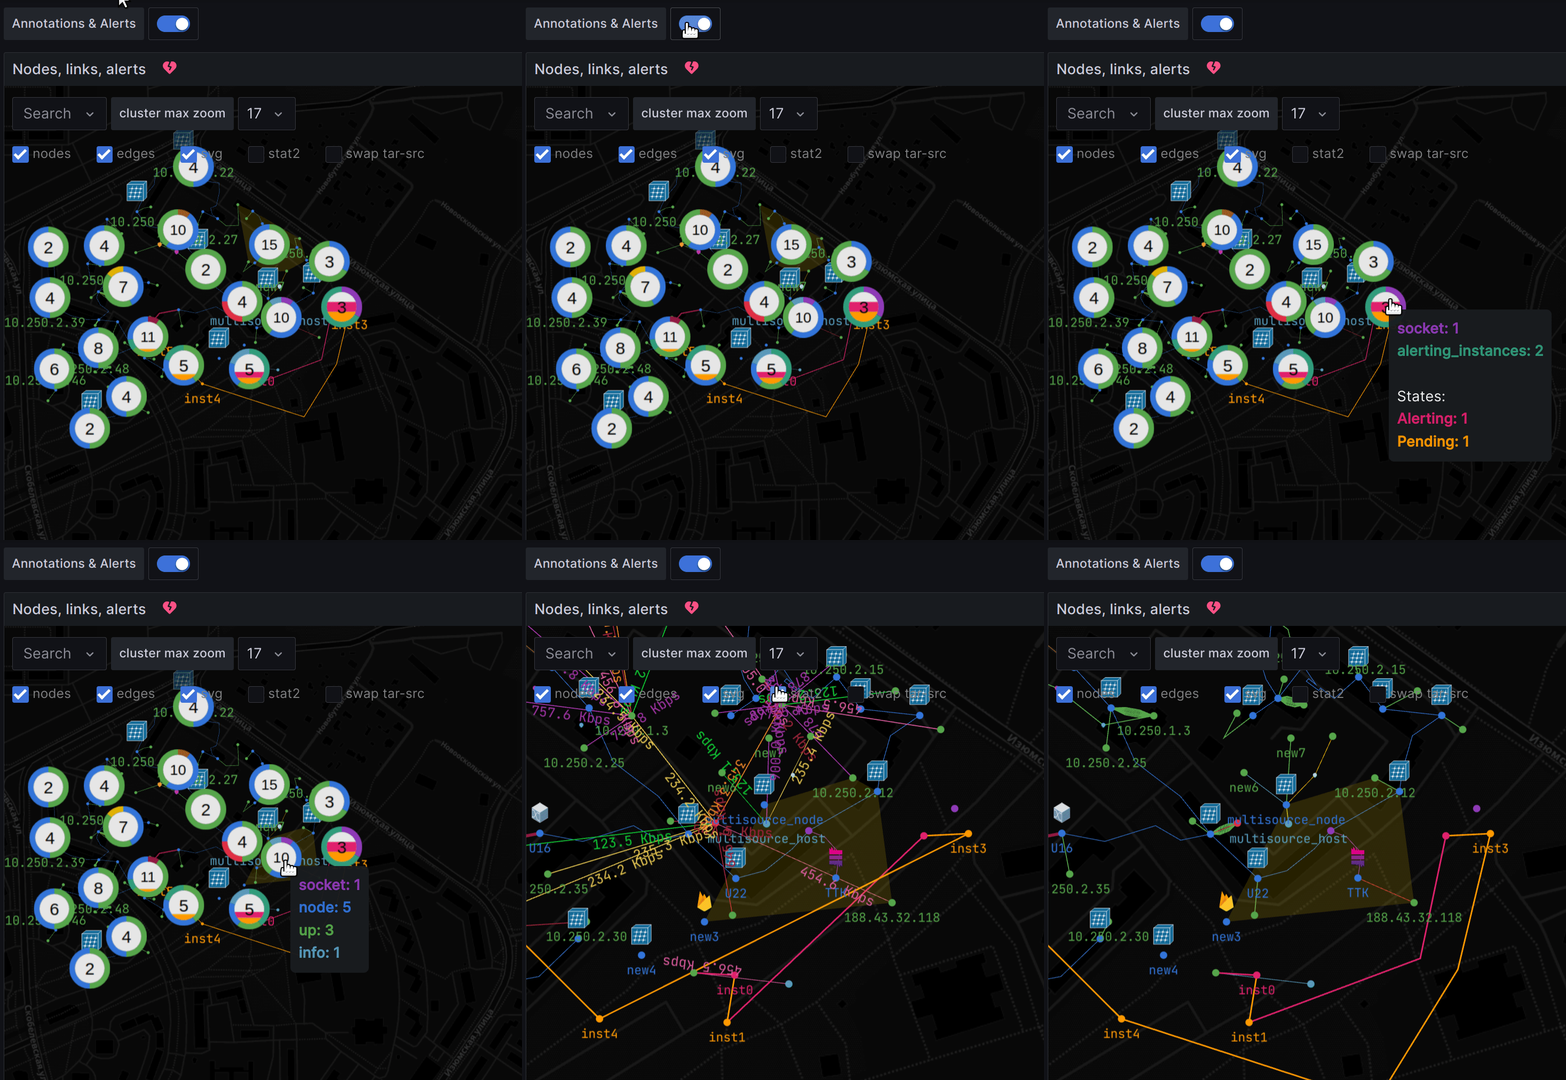
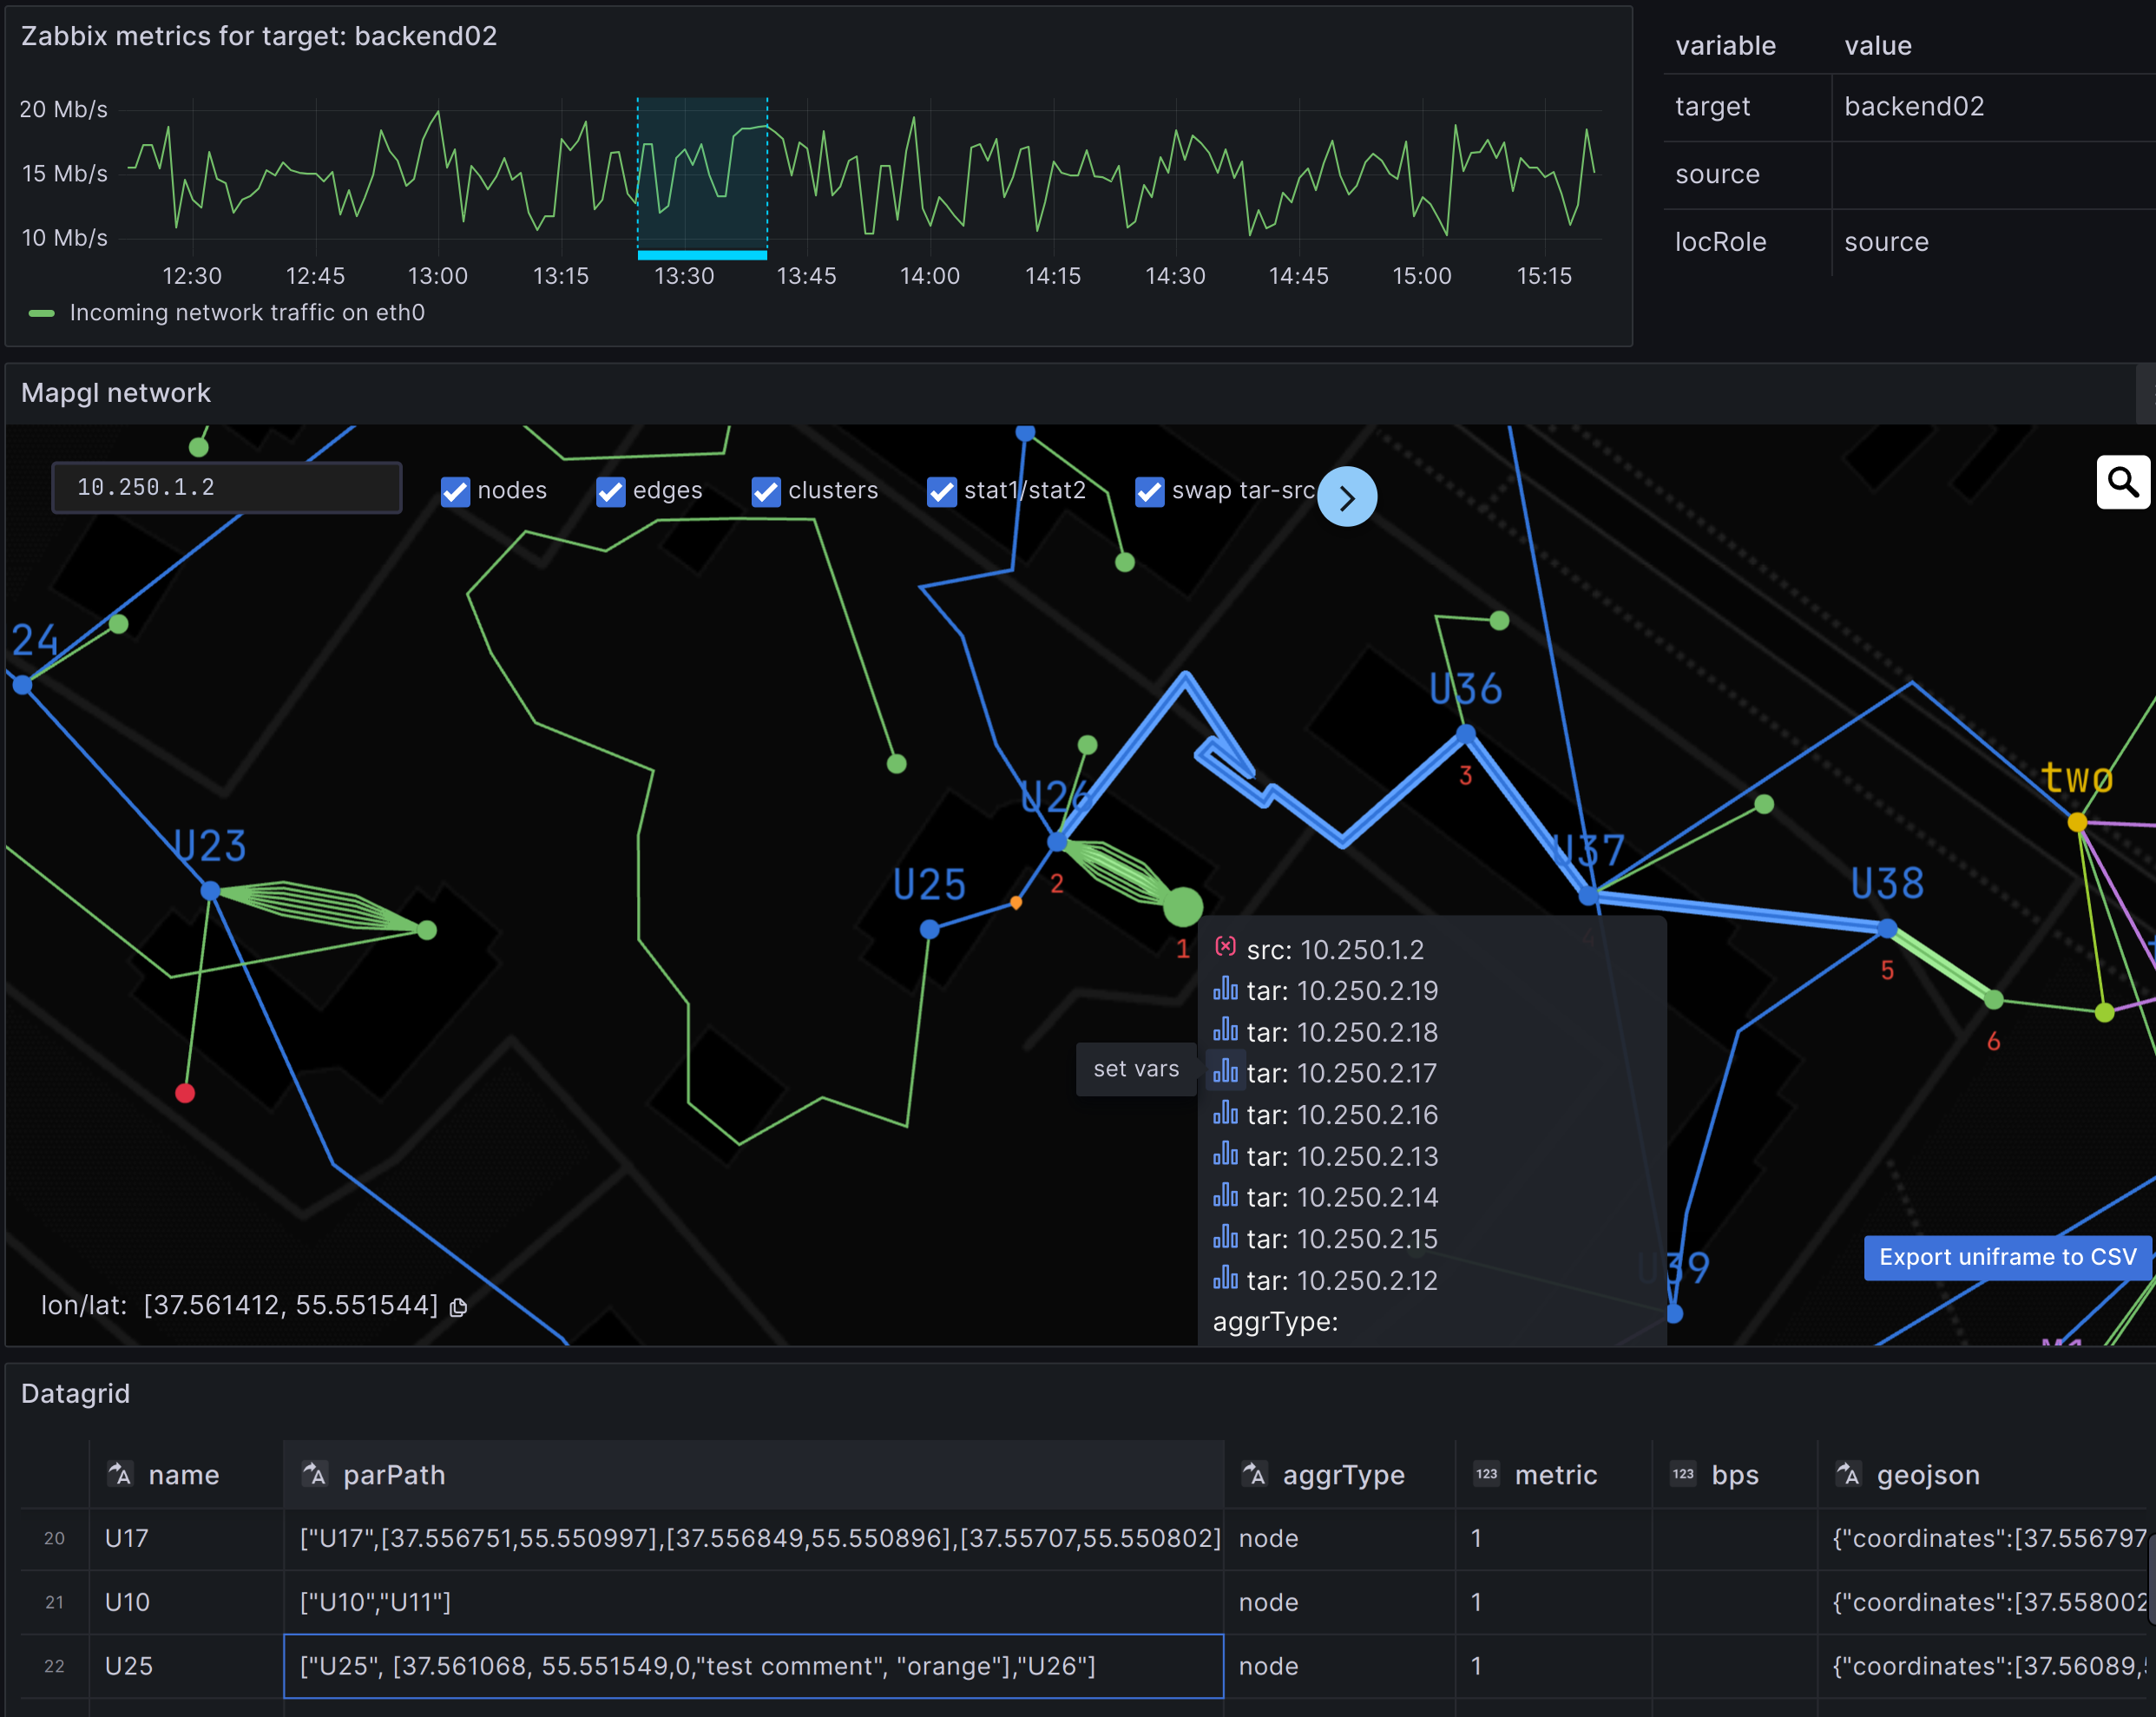
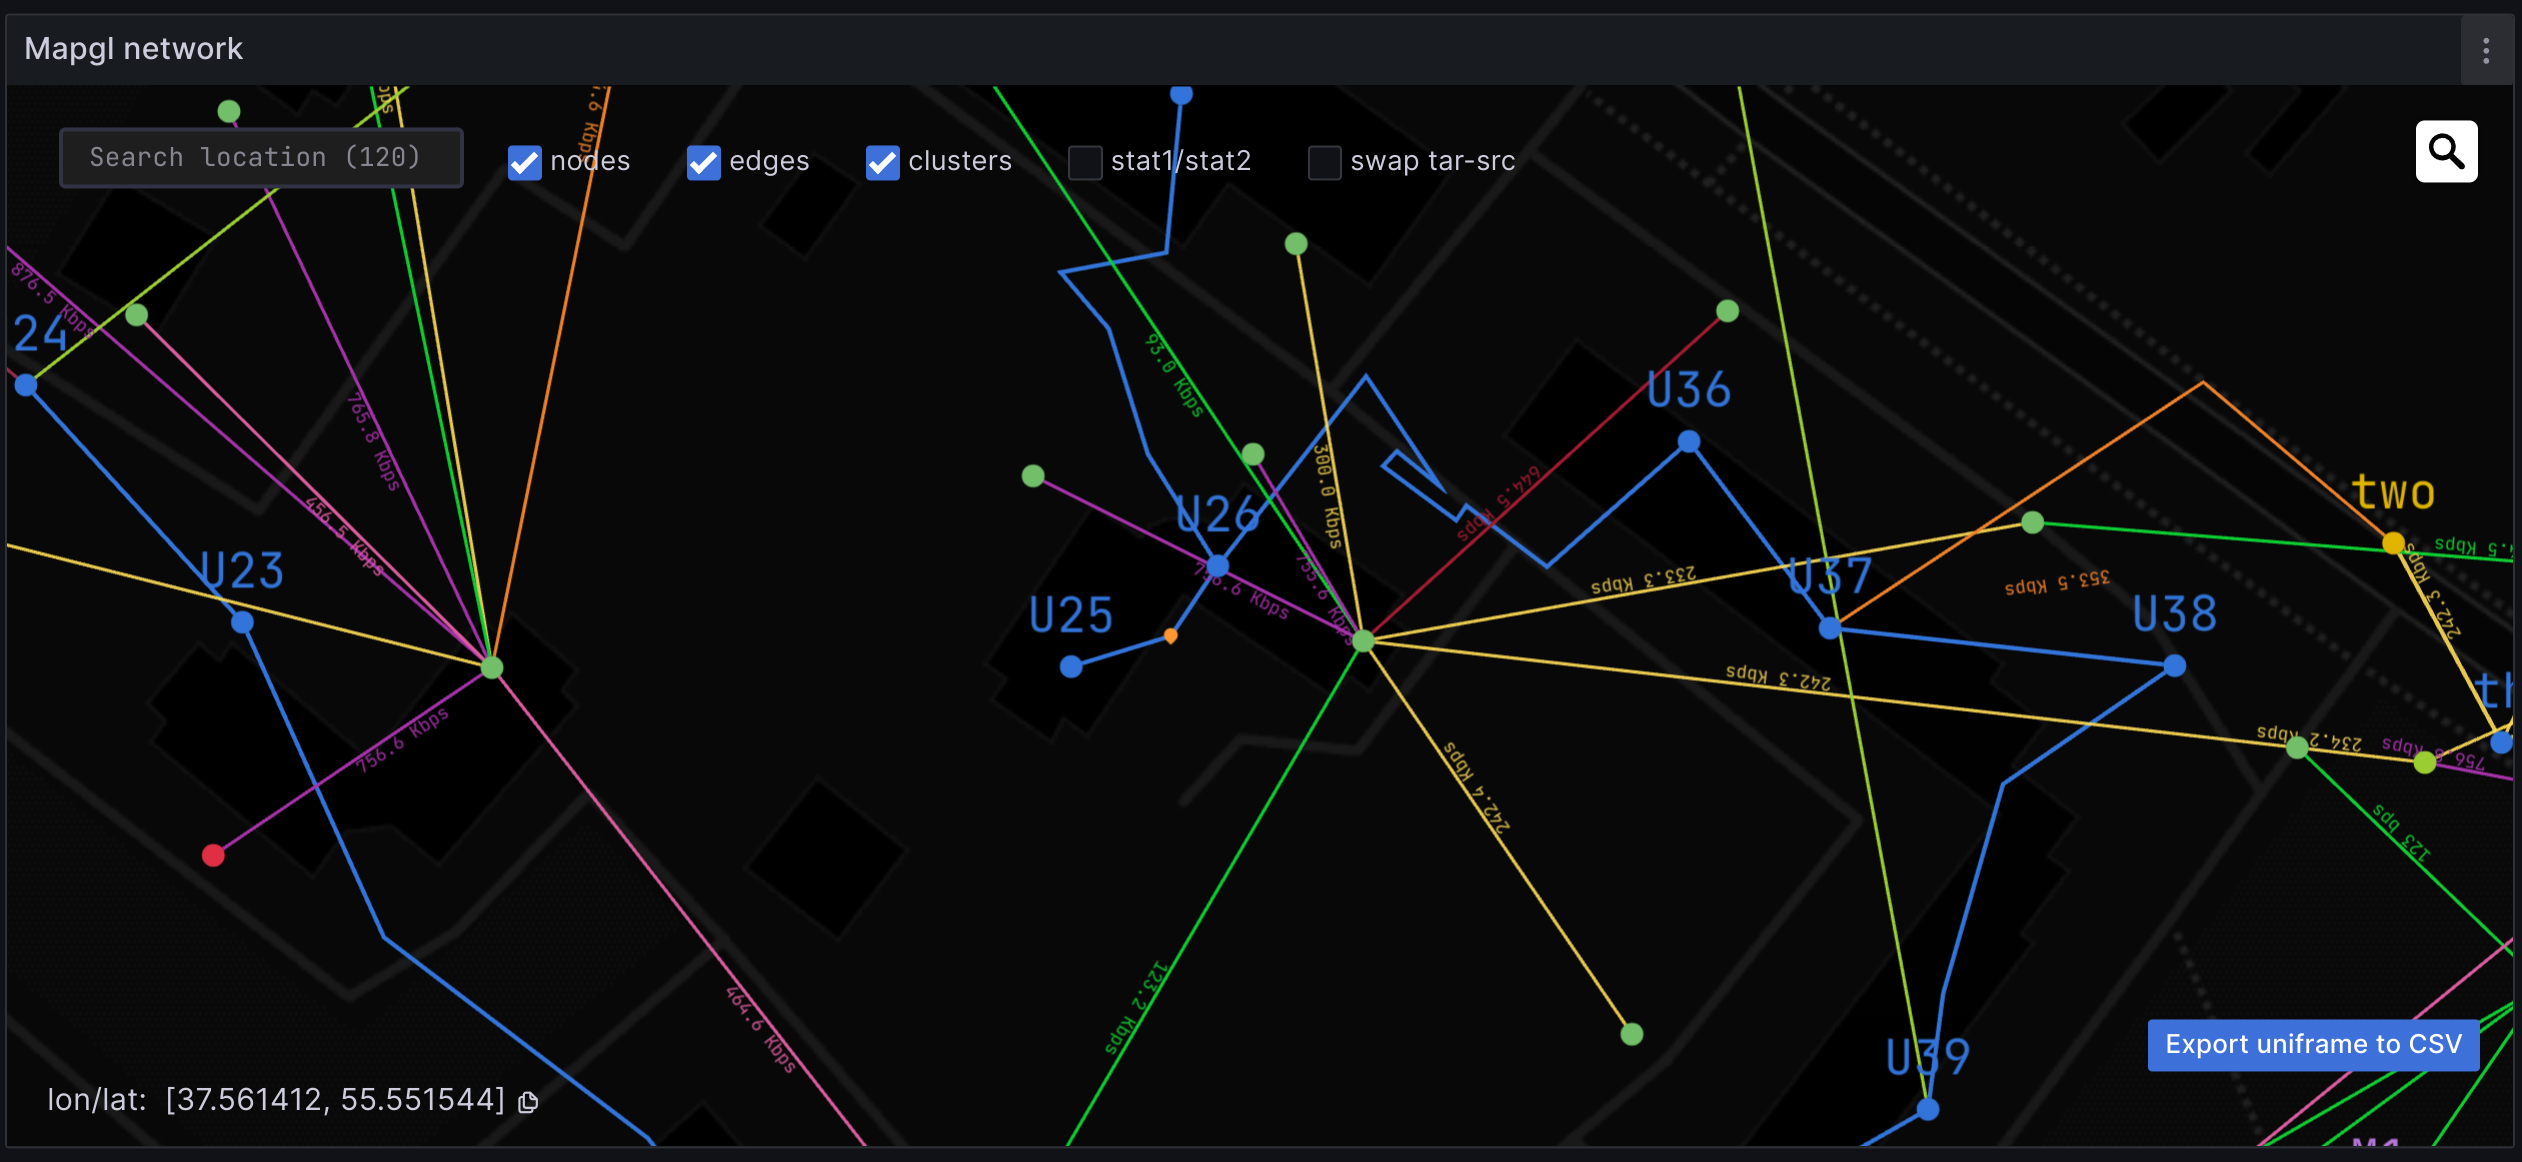
extends base config options of Grafana Geomap with Deck.gl rendering and other features:
- network topology with nodes, links and metrics
- plot alert states from built-in Grafana alert rules
- path (multipaths) to source as an array of coordinates or refs to intermediate locations
- list paths for selected node in both directions (tar-src). Declare dashboard variable 'locRole' to save state
- extended thresholds processor for metric values with overrides
- donut chart icon for clusters listing color labels by thresholds
- svg icons, text labels with collision filter
- data-links: icon button in tooltip sets values for 'target' and 'source' dashboard variables to show charts dynamically in other panels.
- comment icons for intermediate coordinates from inlined text and color (ex.: [37.560447,55.550818, 0, "comment", "green"])
- aggregation typed nodes and offset for overlapping lines.
- stat1/stat2 switch to show straight path with secondary metric as a label
- optimized rendering of large datasets using WebGL
- multi layers support of Polygon, GeoJson from url, LineString layers
- tooltips with customizable fields
- customizable nodes search
Explore panel and datasource config examples at the Playground
Tutorial: Observing Zabbix events on a geospatial map
Required datasource fields:
- Coordinates for points in geojson, lon / lat or geohash format
- Metric field for color thresholds or link your panel to Grafana alerting rules
npm install
npm run build
docker-compose up
And go to http://localhost:3000/


