Grafana MongoDB Atlas Logs Datasource
MongoDB Atlas allows to fetch logs from their service. More information can be found here: https://docs.atlas.mongodb.com/reference/api/logs/
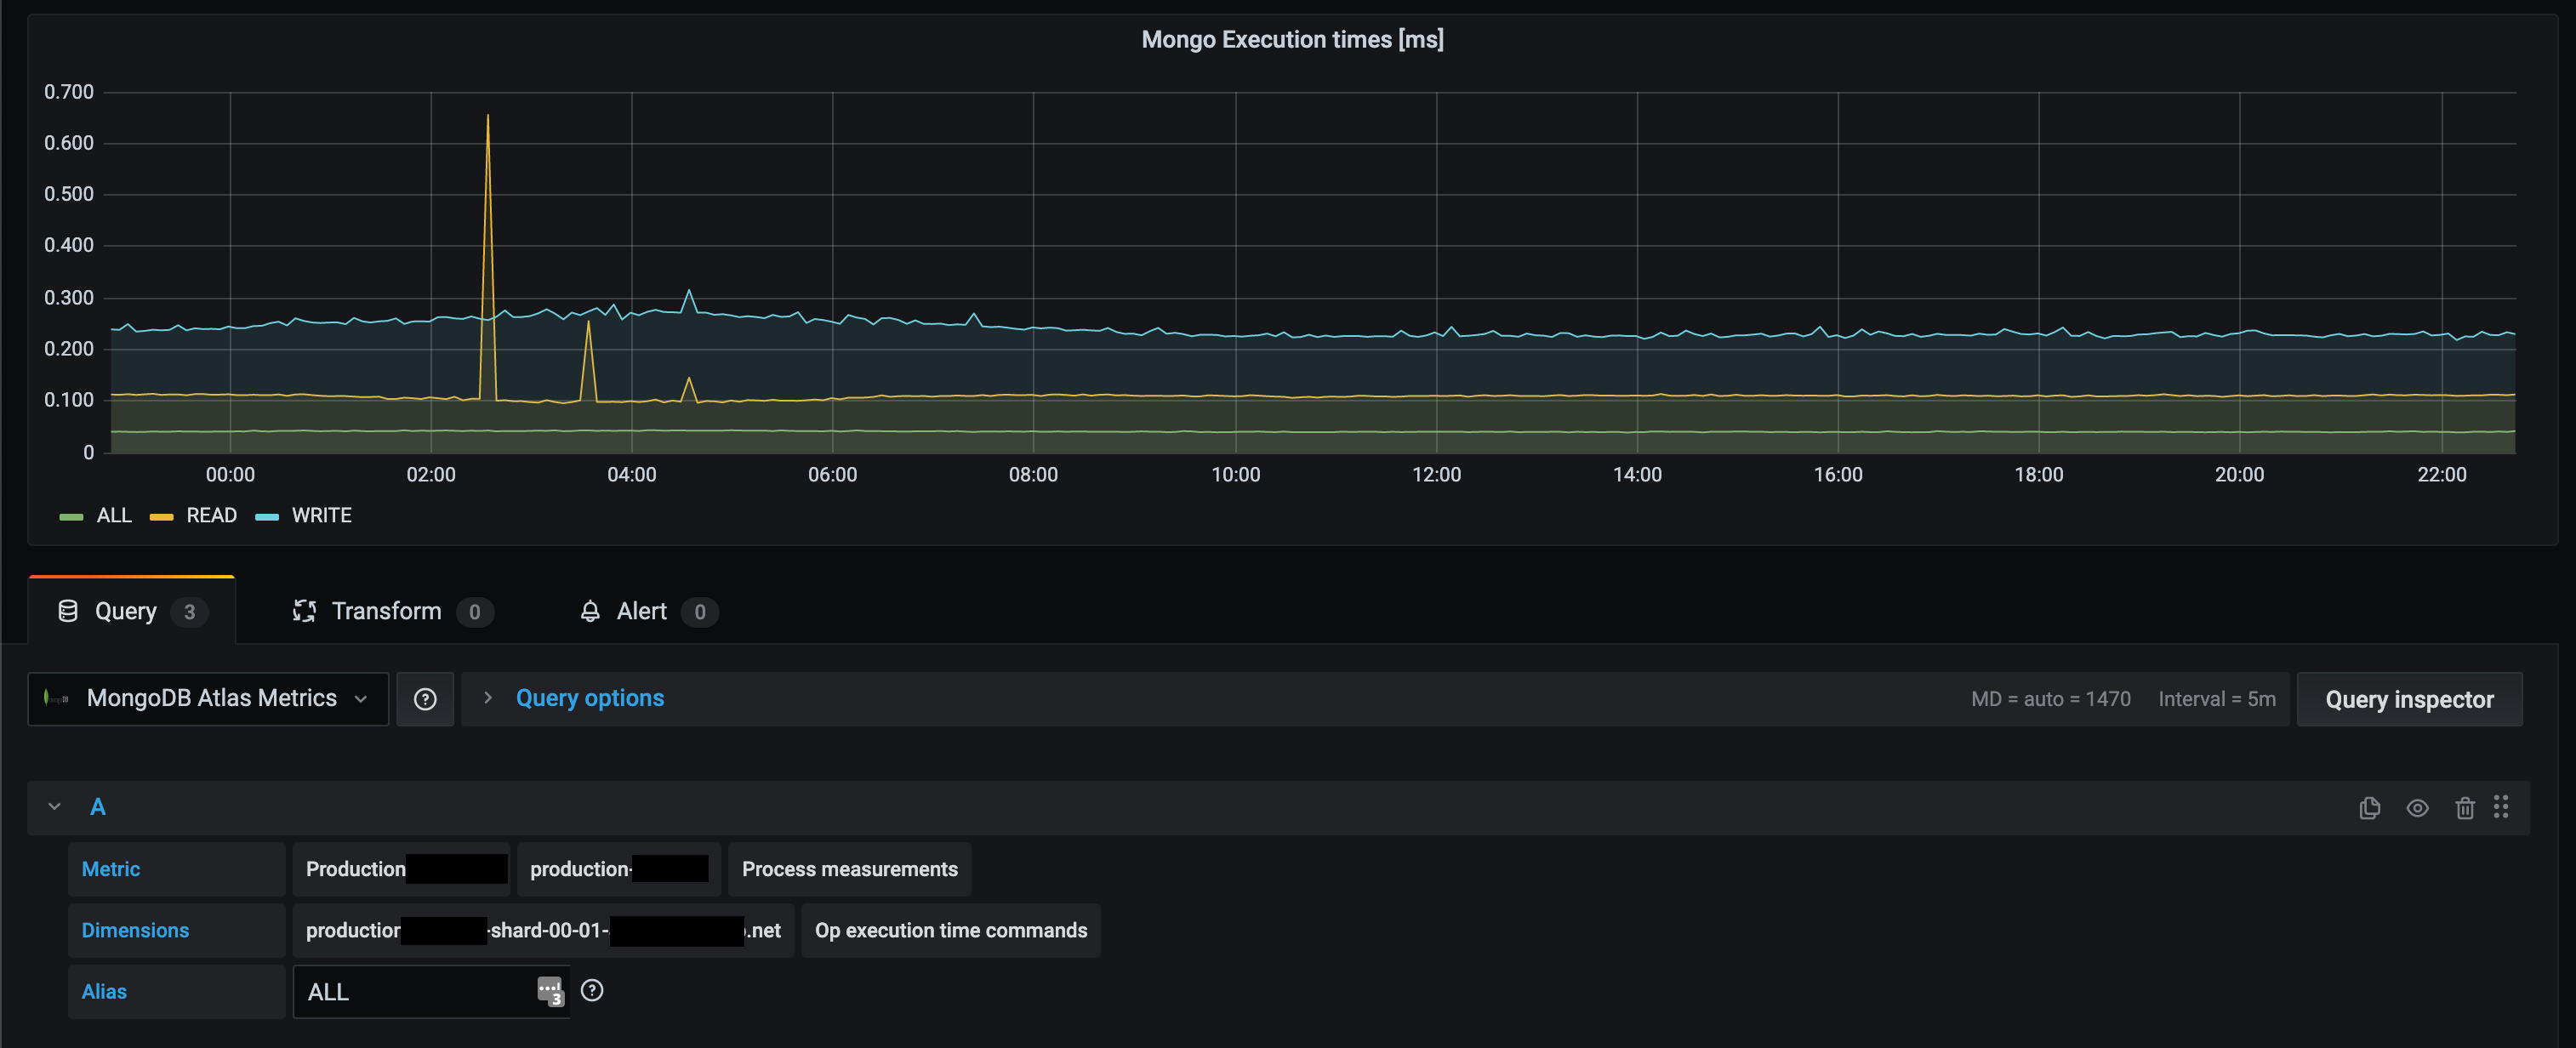
This plugin allows to fetch process, database and disk logs from MongoDB Atlas in your Grafana dashboard. This allows you to monitor your whole MongoDB Atlas infrastructure within your grafana dashboards.
Installation
Grafana Setup
You can load the latest plugin version with the following command:
grafana-cli --pluginUrl https://github.com/valiton/grafana-mongodb-atlas-datasource/releases/v3.0.1/download/valiton-mongodbatlas-datasource.zip plugins install valiton-mongodbatlas-datasourceFor docker setup add the following environment variable to automatically install the plugin:
docker run -p 3000:3000 \
  -e GF_INSTALL_PLUGINS="https://github.com/valiton/grafana-mongodb-atlas-datasource/releases/download/v3.0.1/valiton-mongodbatlas-datasource.zip;valiton-mongodbatlas-datasource" \
  -e "GF_PLUGINS_ALLOW_LOADING_UNSIGNED_PLUGINS=valiton-mongodbatlas-datasource" \
  grafana/grafana:8.0.0
Note: Plugin ID was changed from
mongodb-atlas-datasourcetovaliton-mongodbatlas-datasourcefrom v3.0.0 on due to the new plugin naming convention!
For more information about the plugin installation have a look at the plugin official documentation.
Usage
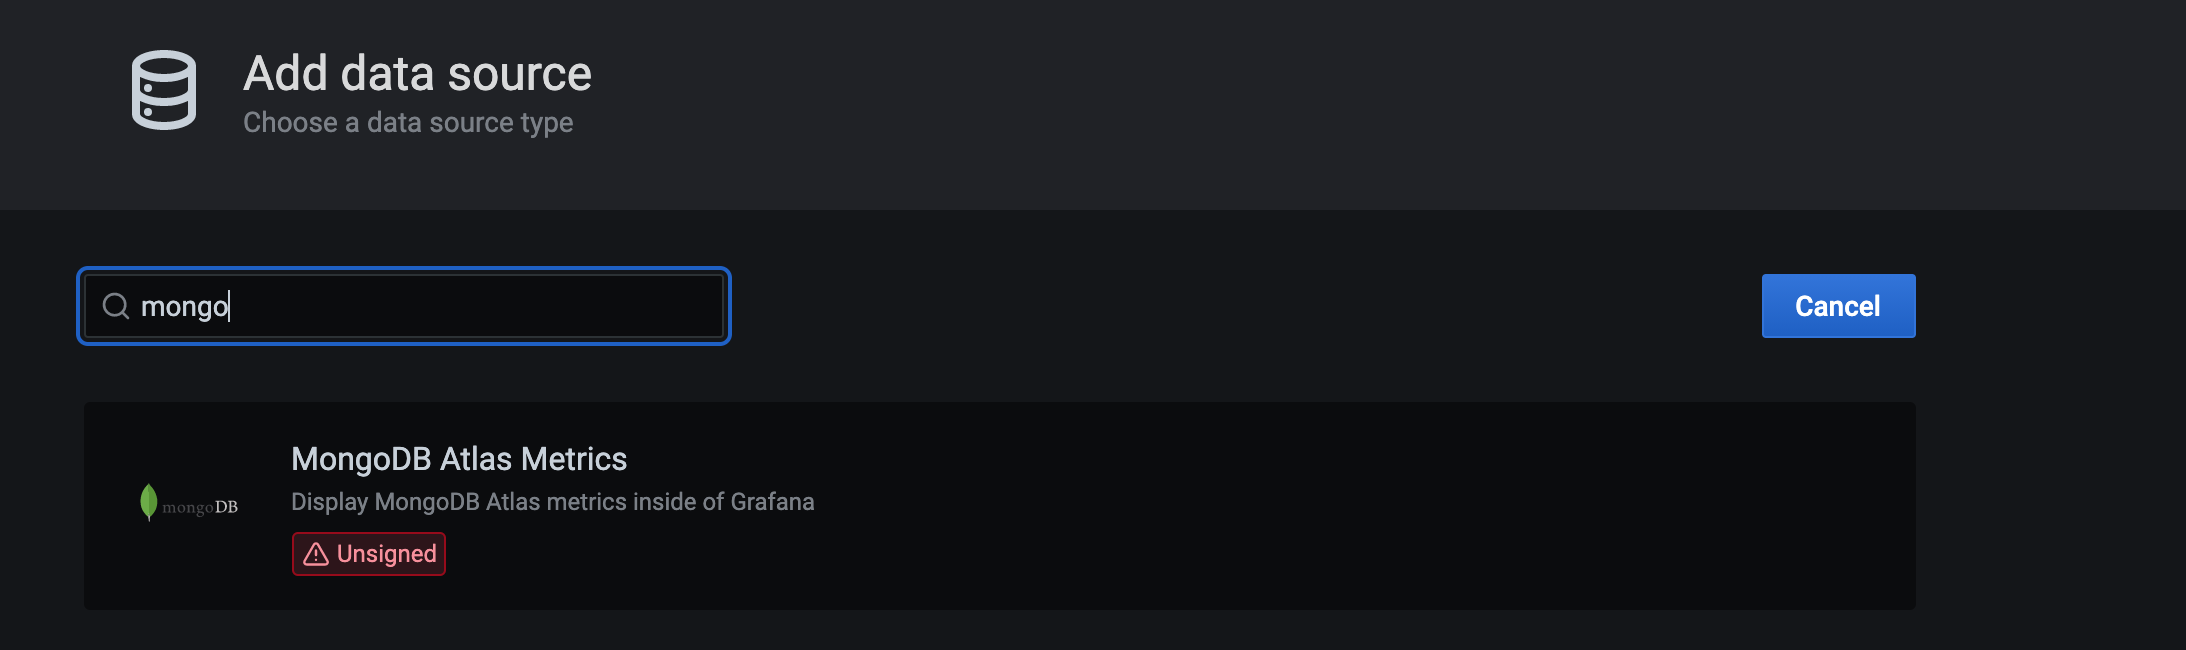
Create datasource
After installing the datasource in Grafana (see Grafana Setup section), you can create a Grafana datasource.
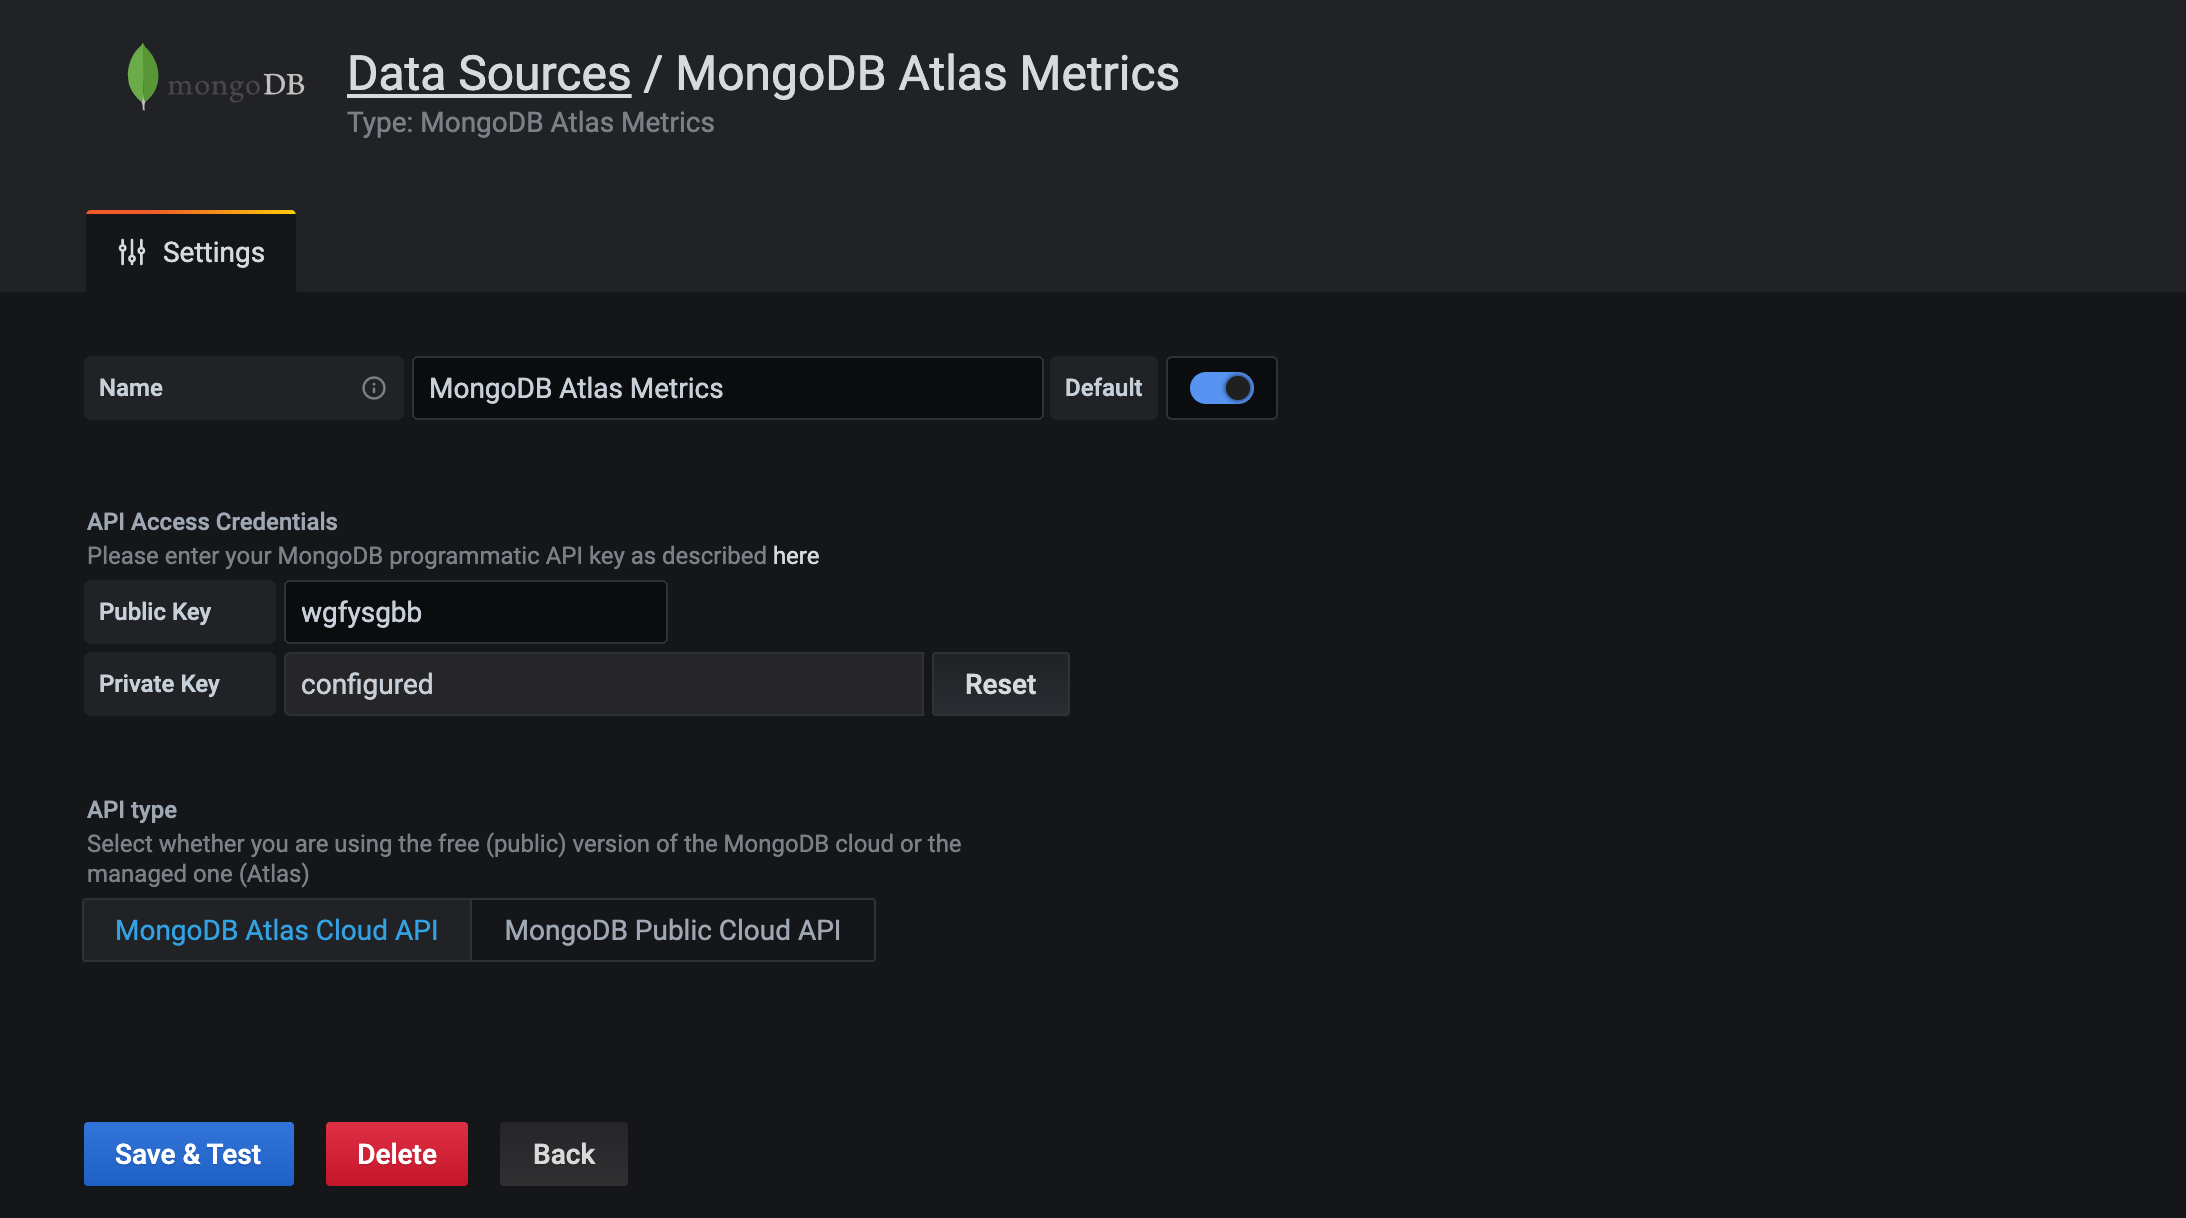
Please enter here your programmatic API key credentials in the two input fields and click on enter. If the credentials are valid, you will see a green info box. For more information, have a look at the MongoDB Atlas documentation to create these credentials.
Create Panel
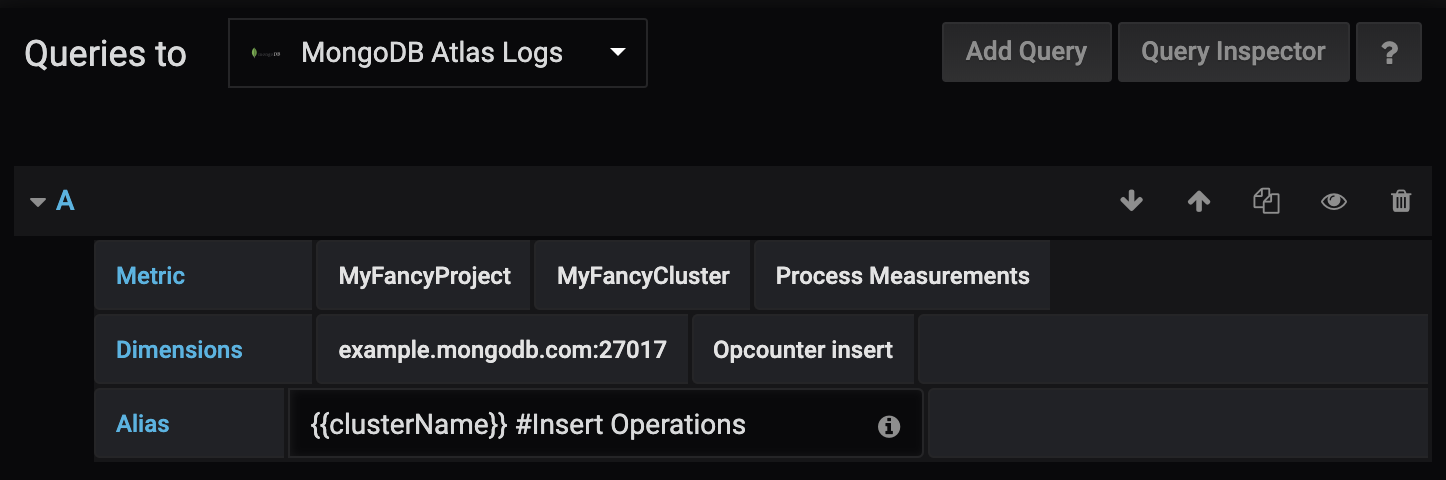
After setting up the datasource, you are able to create a query for a Grafana panel. You have to first select here the project you want to monitor and the cluster. After that, you can select one of three different metrics:
Next, you are asked different other parameters, such as the database name and then you can select the dimension you want to display in the query. To name the query, please use the alias input. You can use {{name}} to use metrics or dimensions for the name (see hint field of alias for more information).
Dev setup
Frontend
-
Install dependencies
yarn install
-
Build plugin in development mode or run in watch mode
yarn dev
or
yarn watch
-
Build plugin in production mode
yarn build
Backend
-
Update Grafana plugin SDK for Go dependency to the latest minor version:
go get -u github.com/grafana/grafana-plugin-sdk-go
go mod tidy
-
Build backend plugin binaries for Linux, Windows and Darwin:
mage -v
-
List all available Mage targets for additional commands:
mage -l
Limitations
- Annotations are not supported yet
Contributing
Pull requests for new features, bug fixes, and suggestions are welcome!
Release
1. Add Release Notes to Changelog in CHANGELOG.md
2. Update package.json version
3. Create Tag with format vx.y.z
We use semversion format for tagging the releases.´
4. Create Release Zip
yarn install
npm run build
mage -v
rm -Rf valiton-mongodbatlas-datasource && \
  cp -R dist valiton-mongodbatlas-datasource
Next, please remove all dev-related topics from the valiton-mongodbatlas-datasource/README.md file. Otherwise, we can not publish it as Grafana plugin (only keep introduction & usage section).
Next, bundle it as
zip -r valiton-mongodbatlas-datasource.zip ./valiton-mongodbatlas-datasource5. Create Release with zip files as attachment
see https://help.github.com/en/articles/creating-releases for more information
Changelog
License
Thanks to
We also want to thank the Grafana team for their Github Datasource that helped us to get started and we also used some of their code parts. This decreased our development effort a lot, which made it easier for us to switch to the new Grafana Plugin v2 version! :-)