FOOOF is a fast, efficient, and physiologically-informed tool to parameterize neural power spectra.
FOOOF conceives of a model of the power spectrum as a combination of two distinct functional processes:
- An aperiodic component, reflecting 1/f like characteristics, modeled with an exponential fit, with
- A variable number of periodic components, that exhibit as band-limited peaks rising above the aperiodic component, reflecting putative oscillations, modeled as Gaussians
This model driven approach can be used to measure periodic and aperiodic properties of electrophysiological data, including EEG, MEG, ECoG and LFP data.
The benefit of using FOOOF for measuring putative oscillations, is that peaks in the power spectrum are characterized in terms of their specific center frequency, power and bandwidth without requiring predefining specific bands of interest and controlling for the aperiodic component. FOOOF also gives you a measure of this aperiodic components of the signal, allowing for measuring and comparison of 1/f like components of the signal within and between subjects.
Documentation for FOOOF is available here.
The tutorials describe the FOOOF algorithm and it's usage, as well as additional examples on the Examples page.
The documentation also includes an FAQ.
FOOOF is written in Python, and requires Python >= 3.5 to run.
It has the following dependencies:
- numpy
- scipy >= 0.19
- matplotlib (optional)
- tqdm (optional)
- pytest (optional)
That is, if you are using Anaconda, then you are good to go.
If you aren't already using Anaconda, it is a useful tool to get and manage these dependencies.
Matplotlib is not required for running the model fitting, but is used if you want to visualize model fits.
tqdm is also not required for running the model fitting, but can be used to print progress bars when fitting many models.
Pytest is only required to run the test suite.
Stable Version
To install the latest stable release of fooof, you can use pip:
$ pip install fooof
Note that this will install only the core (non-optional) fooof requirements.
Development Version
To get the lastest, development version, you can get the code using git:
$ git clone https://github.com/fooof-tools/fooof
To then install the development version (without making changes to it), move into the directory you cloned and run:
$ pip install .
Otherwise, if you want to install an editable, development version, move into the directory you cloned and install with:
$ pip install -e .
FOOOF is implemented in Python, but there is also Matlab wrapper with which you can use FOOOF from Matlab, which is available in the fooof_mat repository.
If you would like to use FOOOF, from Python, within a pipeline that is mostly in Matlab, the mat_py_mat repository also has some examples and utilities for doing so.
If you use this code in your project, please cite:
Haller M, Donoghue T, Peterson E, Varma P, Sebastian P, Gao R, Noto T, Knight RT, Shestyuk A,
Voytek B (2018) Parameterizing Neural Power Spectra. bioRxiv, 299859.
doi: https://doi.org/10.1101/299859
Direct Link: https://doi.org/10.1101/299859
FOOOF is object oriented, and generally follows a similar approach as used in scikit-learn.
The algorithm works on frequency representations, that is power spectra in linear space.
With a power spectrum loaded (with 'freqs' storing frequency values, and 'spectrum' storing the power spectrum, both as 1D arrays in linear space) FOOOF can be used as follows:
from fooof import FOOOF

# Initialize FOOOF object
fm = FOOOF()

# Define frequency range across which to model the spectrum
freq_range = [3, 40]

# Model the power spectrum with FOOOF, and print out a report
fm.report(freqs, spectrum, freq_range)
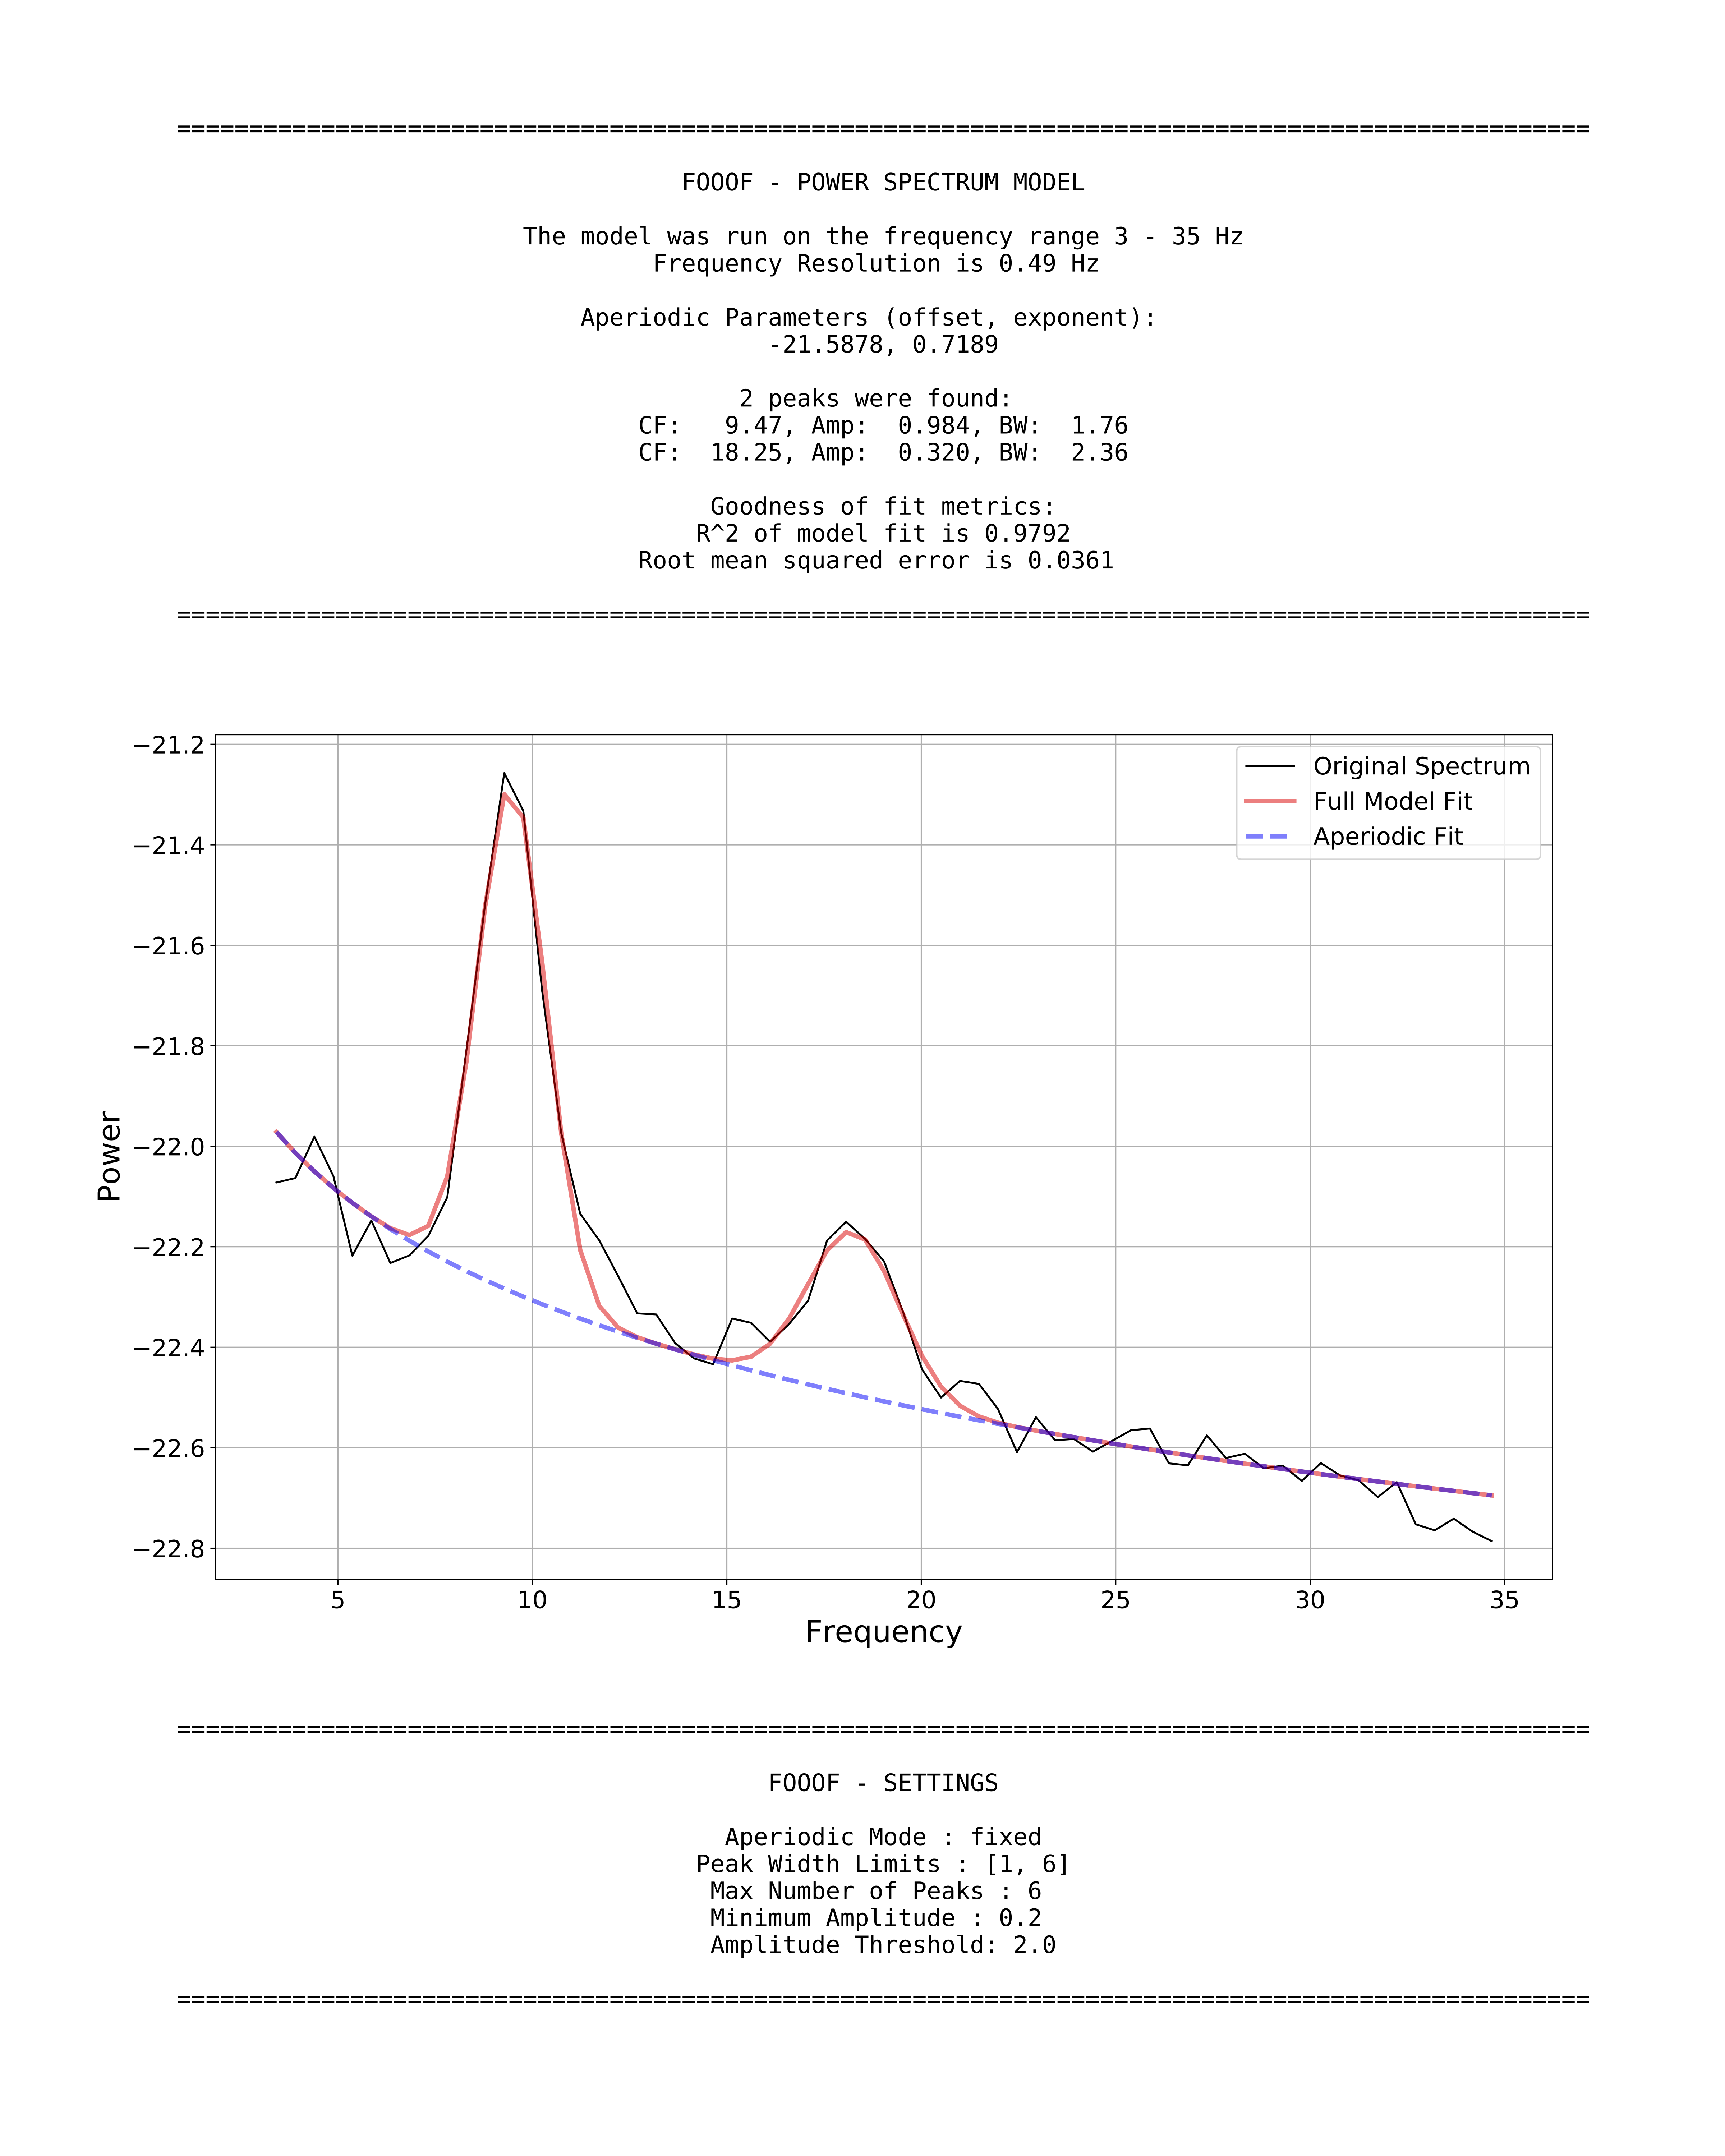
FOOOF.report() fits the model, plots the original power spectrum with the associated FOOOF model fit, and prints out the parameters of the model fit for both the aperiodic component, and parameters for any identified peaks, reflecting periodic components.
FOOOF also accepts parameters for fine-tuning the fit. For example:
fm = FOOOF(peak_width_limits=[1.0, 8.0], max_n_peaks=6, min_peak_height=0.1, peak_threshold=2.0)peak_width_limitssets the possible lower- and upper-bounds for the fitted peak widths.max_n_peakssets the maximum number of peaks to fit.min_peak_heightsets an absolute limit on the minimum height (above aperiodic) for any extracted peak.peak_threshold, also sets a threshold above which a peak height must cross to be included in the model. This parameter is in terms of standard deviation above the noise of the flattened spectrum.
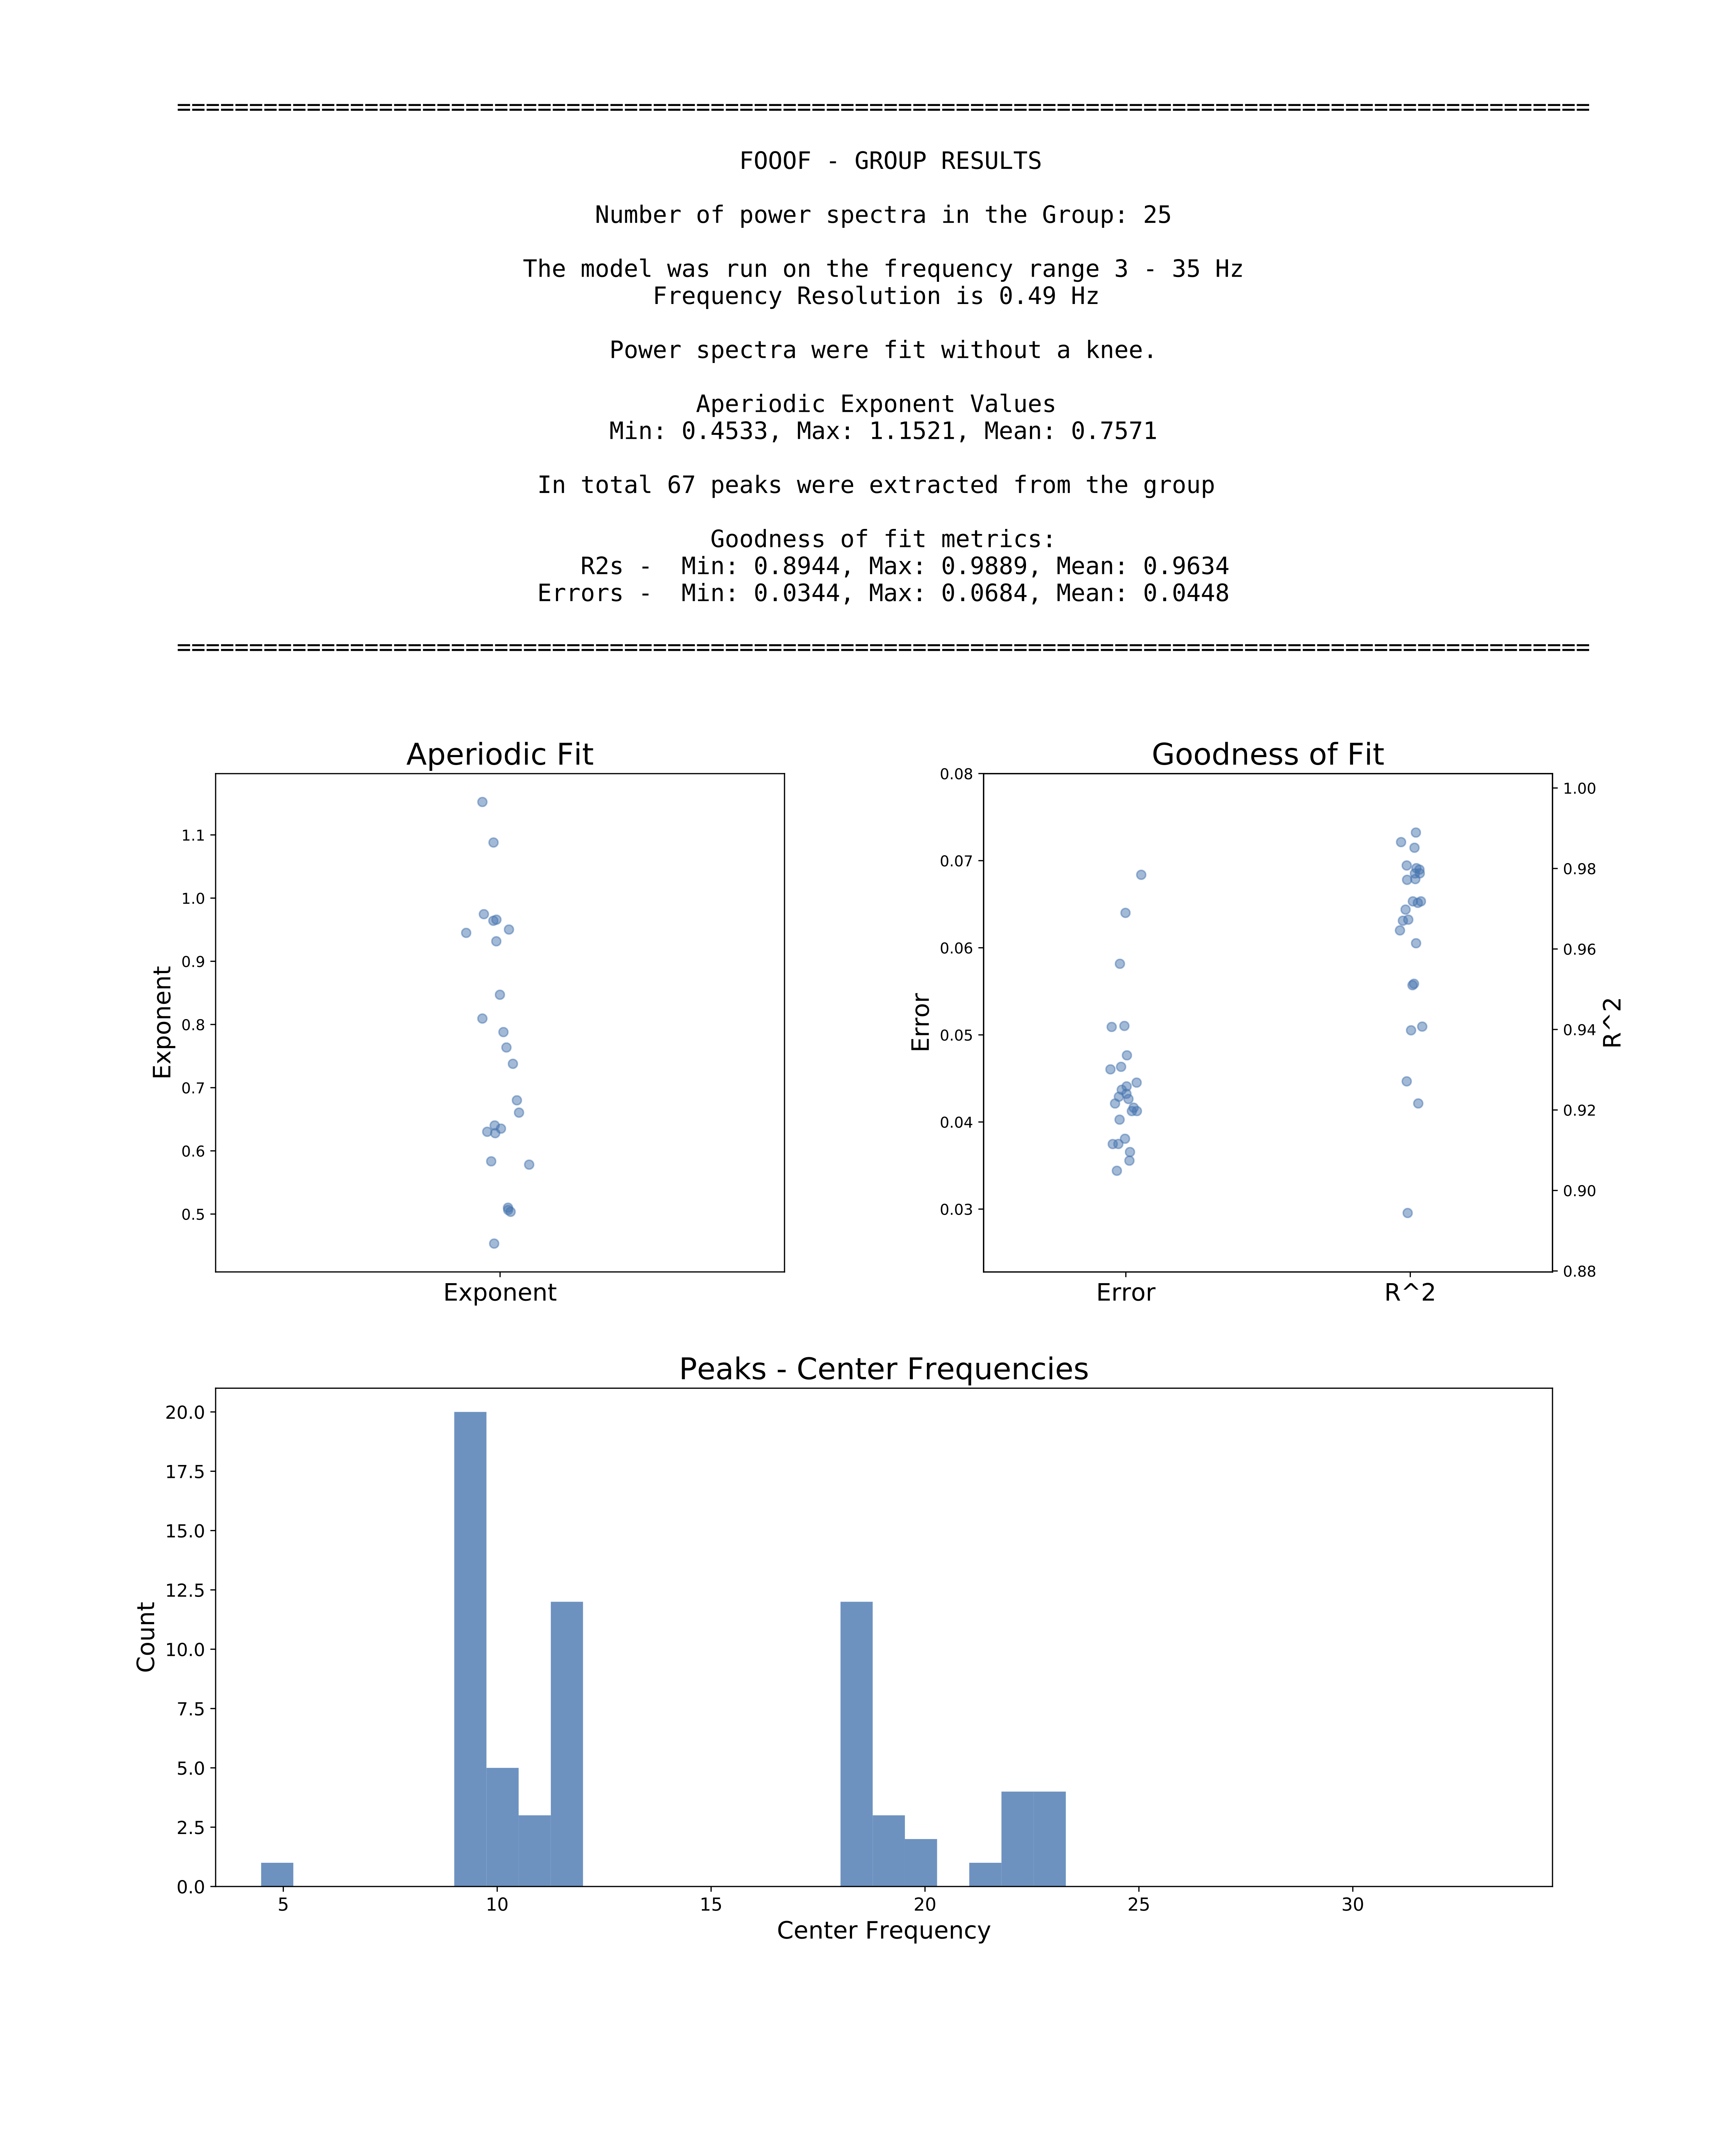
FOOOF also has convenience methods for running the FOOOF model across matrices of multiple power spectra, as well as functionality for saving and loading results, creating reports from FOOOF outputs, and utilities to further analize FOOOF results.
An example workflow for fitting a group of neural power spectra with 'freqs' as 1D array of frequency values, and 'spectra' as a 2D array of power spectra:
# Initialize a FOOOFGroup object, specifying some parameters
fg = FOOOFGroup(peak_width_limits=[1.0, 8.0], max_n_peaks=8)

# Fit FOOOF model across the matrix of power spectra
fg.fit(freqs, spectra)

# Create and save out a report summarizing the results across the group of power spectra
fg.save_report()

# Save out FOOOF results for further analysis later
fg.save(file_name='fooof_group_results', save_results=True)
Example output for a FOOOF fit on an individual power spectrum:
Example output from using FOOOFGroup across a group of power spectra:


