D3 plugin that simplifies making charts and cartograms that have non-overlapping, force-directed elements.
Wraps d3.layout.force() and the collision detection algorithms found here and here.
The force simulation module in D3 4.0 will make this type of force positioning and collision detection straightforward. If you are using the alpha version of D3 4.0, I suggest using d3-force module. It's flexible and will be built into the future D3.
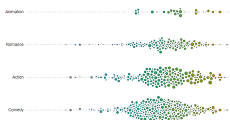
Swarm Plot 
|
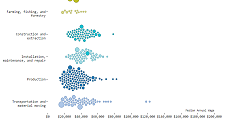
Swarm Plot 
|
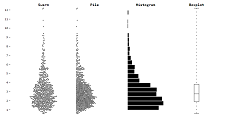
Swarm + Pile Plot 
|
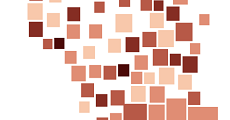
Disjointed Cartogram 
|
Save the force-chart.js file from this repo and include it in your HTML after including D3:
<script src="https://d3js.org/d3.v3.min.js" charset="utf-8"></script>
<script src="force-chart.js"></script># d3.forceChart()
Creates a new force chart generator.
This generator has several getter/setter methods that let you specify how you want the chart to render. Getter/setter methods return an updated force chart generator which allows for method chaining.
# forceChart(selection, data)
Renders the force chart within selection, which should be an <svg> or
<g> SVG element.
The second parameter, data, is an array containing the data that is
used to create the visual elements. When forceChart is called the following
properties will be added (or overwritten!) on each element of the array:
- x - x-coordinate of the current element
- y - y-coordinate
- r - radius or half-width depending on whether forceChart.shape("circle") or forceChart.shape("square")
- x0 - targeted x-coordinate
- y0 - targeted y-coordinate
- r0 - targeted r-coordinate
When this function is called data.length number <g class="node"> elements
will be appended to selection. Each <g> will be translated into the current (x,y)-position.
Each <g> is empty so you'll need to add an SVG shape element like a
<circle>, <rect>, <path> or <text>. For example, this is how you would
add a <circle> to each <g> node and set its radius:
var svg = d3.select("body").append("svg"),
    forceChart = d3.forceChart();

svg.call(forceChart, data)
  .selectAll(".node").append("circle")
    .attr("r", function(d) { return d.r; });
# forceChart.size([width, height])
Sets the width and height of the forceChart. If not specified, returns
the current size. Defaults to [400, 300]
# forceChart.padding([padding])
Sets the padding between each visual element (in pixels). If not specified,
returns the current padding. Defaults to 3.
# forceChart.shape([shape])
Sets the shape of each visual element. Used when determining if elements are
colliding with one another. Can either be "circle" or "square".
If not specified, returns the current shape. Defaults to "circle".
Regardless of which shape is specified here, the user will have to add an
SVG shape elements to each <g> node. For example, you could set this shape
to "square" and append an <text> element to each <g> node.
# forceChart.draggable([draggable])
Sets whether each visual element should be draggable with the mouse
(true or false). If not specified, returns the current draggable setting.
Defaults to true. For more detail see on the drag behavior see the API
reference for the force layout's
drag feature.
Manually moving elements can be useful if your end goal is a static chart with a particular layout. Elements can be arranged how you want and then the positions of the nodes can be saved for use in the static chart.
# forceChart.tickUpdate([tickUpdate])
Sets a function that will be called for every "tick" in the force chart's
animation. The tickUpdate function is called on each <g> node element after
the node has been translated into its current position. If not specified,
returns the current tickUpdate function. Defaults to doing nothing.
This can be useful if you want to have a visual indicator of how far off a node is from its targeted position, for example by making the stroke blue if the x-position is to the right of the targeted x and making it red if it is to the left of its target:
var errorScale = d3.scale.linear()
  .domain([-20, 0, 20])
  .range(["red", "white", "blue"]);

var forceChart()
  .tickUpdate(function(d) {
    var node = d3.select(this);

    node.select("circle")
      .style("stroke", function(d) { return errorScale(d.x0 - d.x); });
  });
# forceChart.force()
Returns the d3.force.layout()
object that underlies the forceChart.
This can be used to stop, start and update the nodes' movement:
var force = forceChart.force();

force.stop(); // freeze the layout
for (var i = 0; i < 100; i++) {
  force.tick(); // update 100 ticks without rendering
}
force.start(); // restart layout movement and renderingThe x-, y- and r-target accessors set the targeted (x,y)-position and radius. There is no guarantee the element will be at its targeted position because there may be other elements vying for the same position. Often you will use the x-, y-, r-target accessor functions with scales:
var xScale = d3.scale.linear().range([0, width]),
    yScale = d3.scale.ordinal().rangeBands([height, 0]),
    rScale = d3.scale.linear().range([3, 10]);

var forceChart = d3.forceChart()
  .x(function(d) { return xScale(d.xVal); })
  .y(function(d) { return yScale(d.yVal) + yScale.rangeBand()/2; })
  .r(function(d) { return rScale(d.rVal); });
# forceChart.x([x])
Sets the x-target accessor to the specified function or constant number. If x is not specified, it returns the current x-accessor. Defaults to:
function(d) { return d[0]; }# forceChart.y([y])
Sets the y-target accessor to the specified function or constant number. If y is not specified, it returns the current y-accessor. Defaults to:
function(d) { return d[1]; }# forceChart.r([r])
Sets the r-target accessor to the specified function or constant number. If r is not specified, it returns the current r-accessor. Defaults to:
function(d) { return d[2]; }The gravity strength determines how forceful each element will be when trying to reach the targeted (x, y)-coordinates and radius set in the x-, y- and r-target accessor functions. A higher gravity strength means the element is more likely get to its target for that dimension. For example, if you care more about the x-axis accuracy than the y-axis accuracy you can set the x-gravity strength to a high value and the y-gravity strength to a low value:
var forceChart = d3.forceChart()
  .xGravity(10)
  .yGravity(1/10);
This is a reasonable thing to do when x is a continuous variable and y is ordinal and defined by range bands.
You can also give some node elements more gravity than others. For example, you can set the x-gravity strength to the radius of each element, making it more likely for larger nodes to be in the targeted x-position:
var forceChart = d3.forceChart()
  .xGravity(function(d) { return d.r; });
# forceChart.xGravity([xGravity])
Sets the x-gravity strength accessor to the specified function or constant
number. If not specified, returns the current x-gravity strength accessor.
Defaults to 1.
# forceChart.yGravity([yGravity])
Sets the y-gravity strength accessor to the specified function or constant
number. If not specified, returns the current y-gravity strength accessor.
Defaults to 1.
# forceChart.rGravity([rGravity])
Sets the r-gravity strength accessor to the specified function or constant
number. If not specified, returns the current r-gravity strength accessor.
Defaults to 1.
The x-, y- and r-start accessor functions determine where each visual element will initially be layed out before moving toward its targeted value as set in the x-, y- and r-target accessor functions. By default the (x, y)-coordinates are jittered to reduce some of the initial overlapping.
# forceChart.xStart([xStart])
Sets the x-start accessor to the specified function or constant number. If not specified, returns the current x-start accessor. Defaults to:
function(d) { return x(d) + 50*Math.random() - 25; }# forceChart.yStart([yStart])
Sets the y-start accessor to the specified function or constant number. If not specified, returns the current y-start accessor. Defaults to:
function(d) { return y(d) + 50*Math.random() - 25; }# forceChart.rStart([rStart])
Sets the r-start accessor to the specified function or constant number. If not specified, returns the current r-start accessor. Defaults to:
function(d) { return r(d); }