The repo contains dotnet coredump investigation helpers. Supports alpine/debian/ubuntu based coredumps.
-
Open the repository folder with Visual Studio Code ;
-
Install workspace recommended extensions ;
-
Place your dump to
dump/with filenamedump.dmp; -
Edit
.devcontainer/devcontainer.jsonfile- If your dump were collected from Debian-based (ubuntu/debian/etc) OS change the
dockerfileproperty toDockerfile.debianor toDockerfile.alpinefor dumps from Alpine. - Change the value of
DOTNET_SDK_IMAGE_TAGinargssection to the coresponding docker image tag of dotnet sdk. Note that runtime version != sdk version. From a dump you can get only runtime version. It's described in FAQ
- If your dump were collected from Debian-based (ubuntu/debian/etc) OS change the
-
Use
Reopen in Container
/_workspace- current dir. repo root./_symbols- additional symbols for lldb,is mounted from local_symbols/srcthe folder where you can place sources of the dumped application. lldb maps sources from/_workspace/srcto/srcand/appautomatically./_nupkg- nuget cache folder, is mounted from~/.nuget/packages/_workspace/dumpmight containdump.coredumpfile. The startup script automatically download DAC for this file. It also contains dotnetclrmd.csprojandclrmd.dib(dotnet notebook), that can be useful in dump investigating.
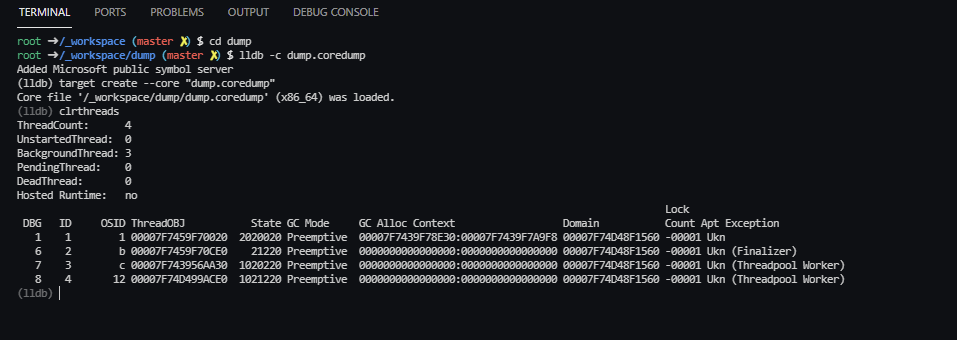
cd dump
lldb --core dump.coredump ./dotnet
After that you can use sos commands in the lldb prompt.
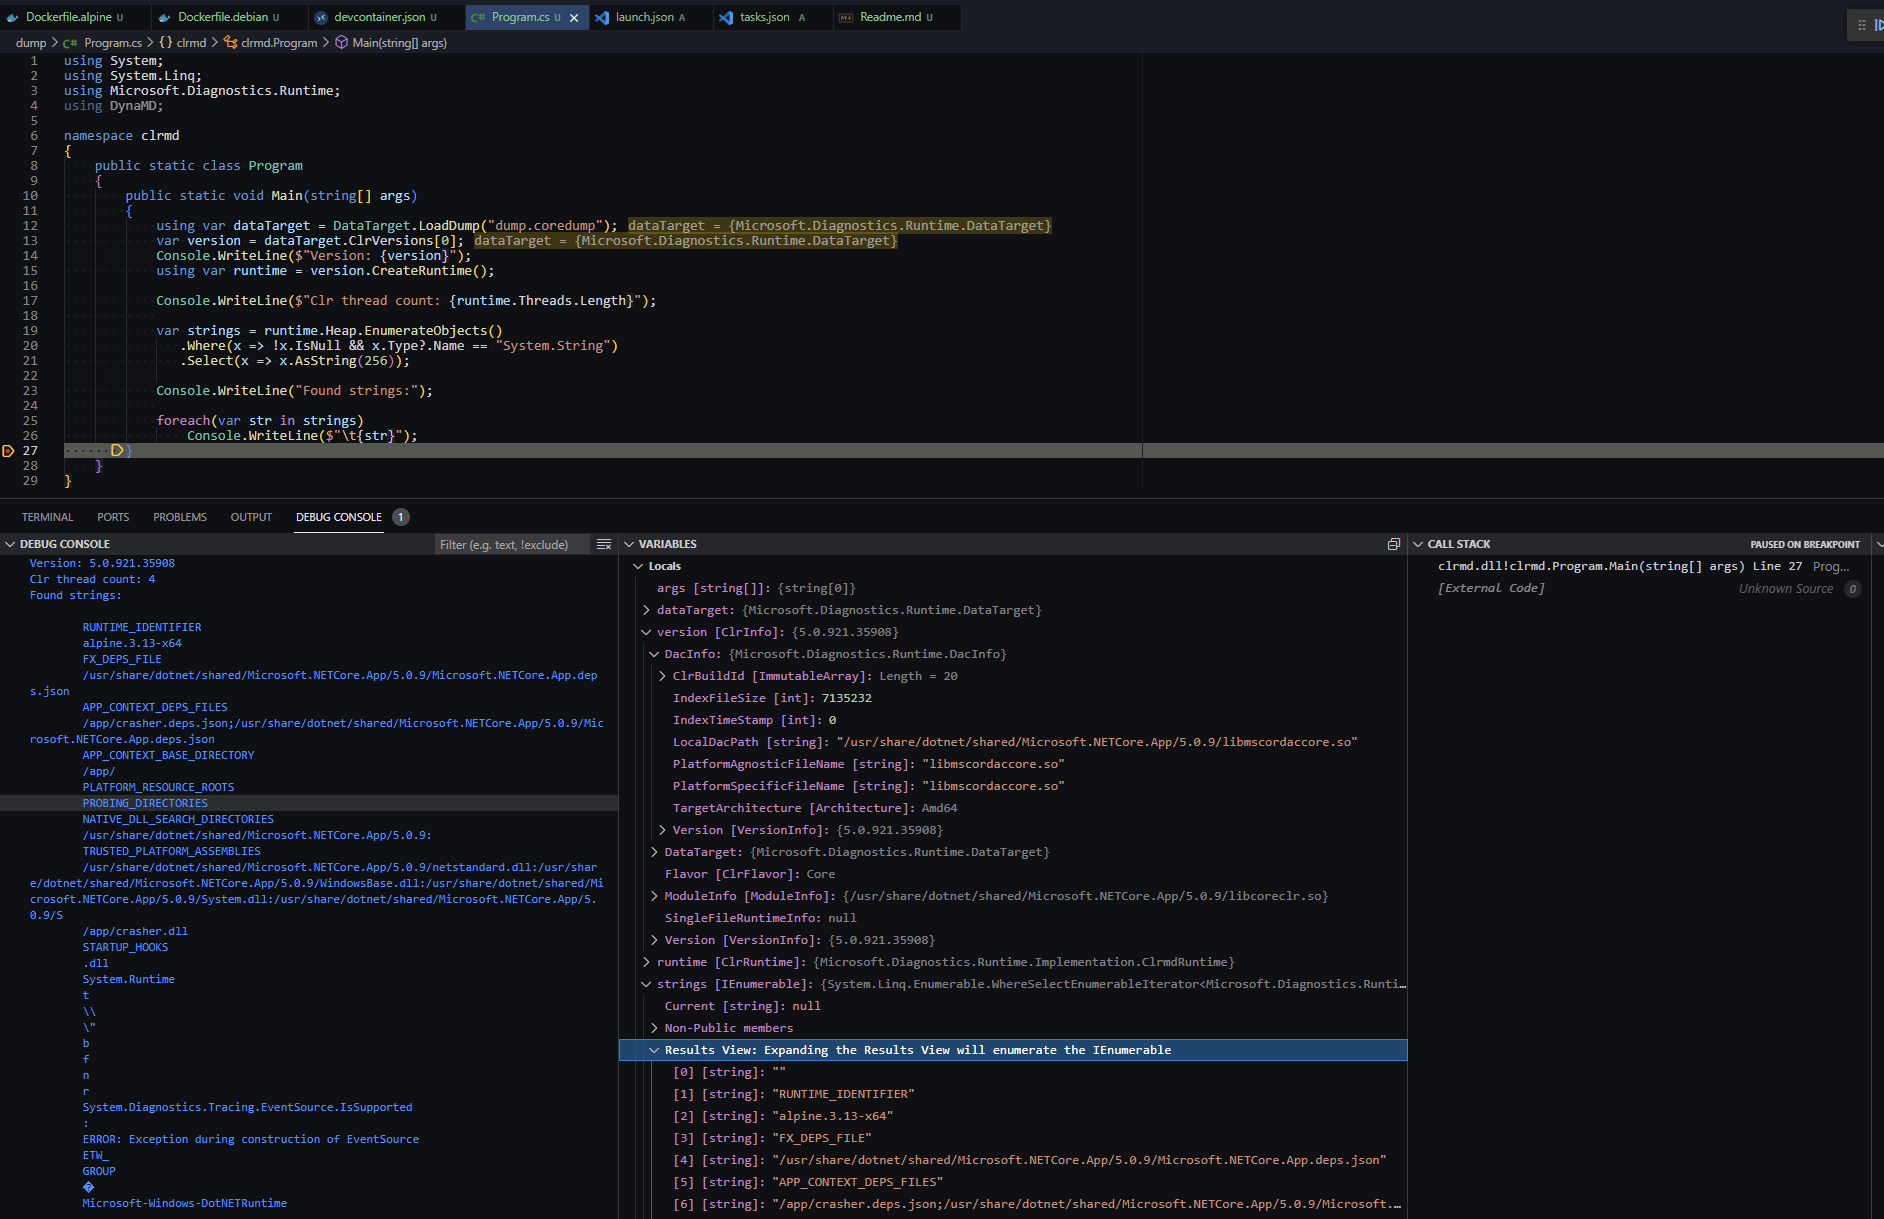
You can write your own debugging logic with ClrMD (aka Microsoft.Diagnostics.Runtime).
The project template is placed under the dump directory, so you can use it with clrmd debug target.
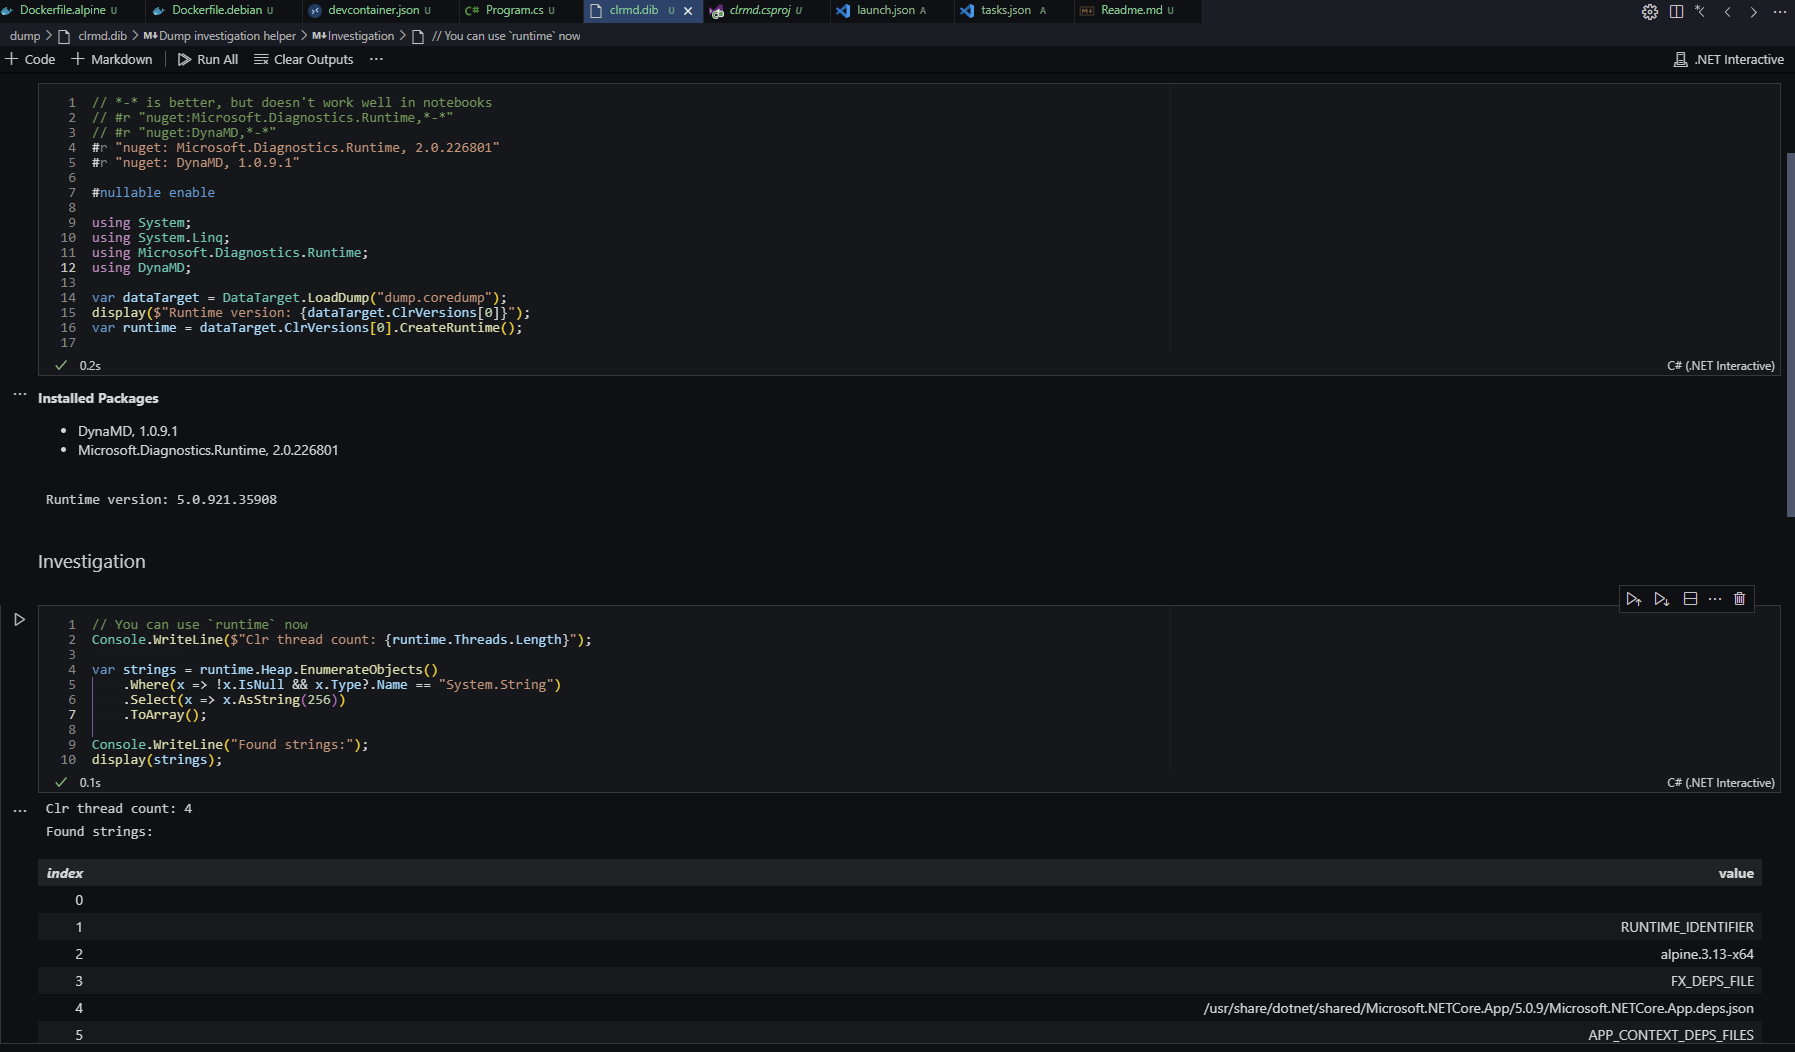
Or you can use dotnet interactive for the same purpose, but with "hot reload" (because variables (e.g. loaded runtime) from cells are still in memory after execution, it helps a lot with visualization after grouping)
Feel free to make PRs with your snippets for the notebook :)
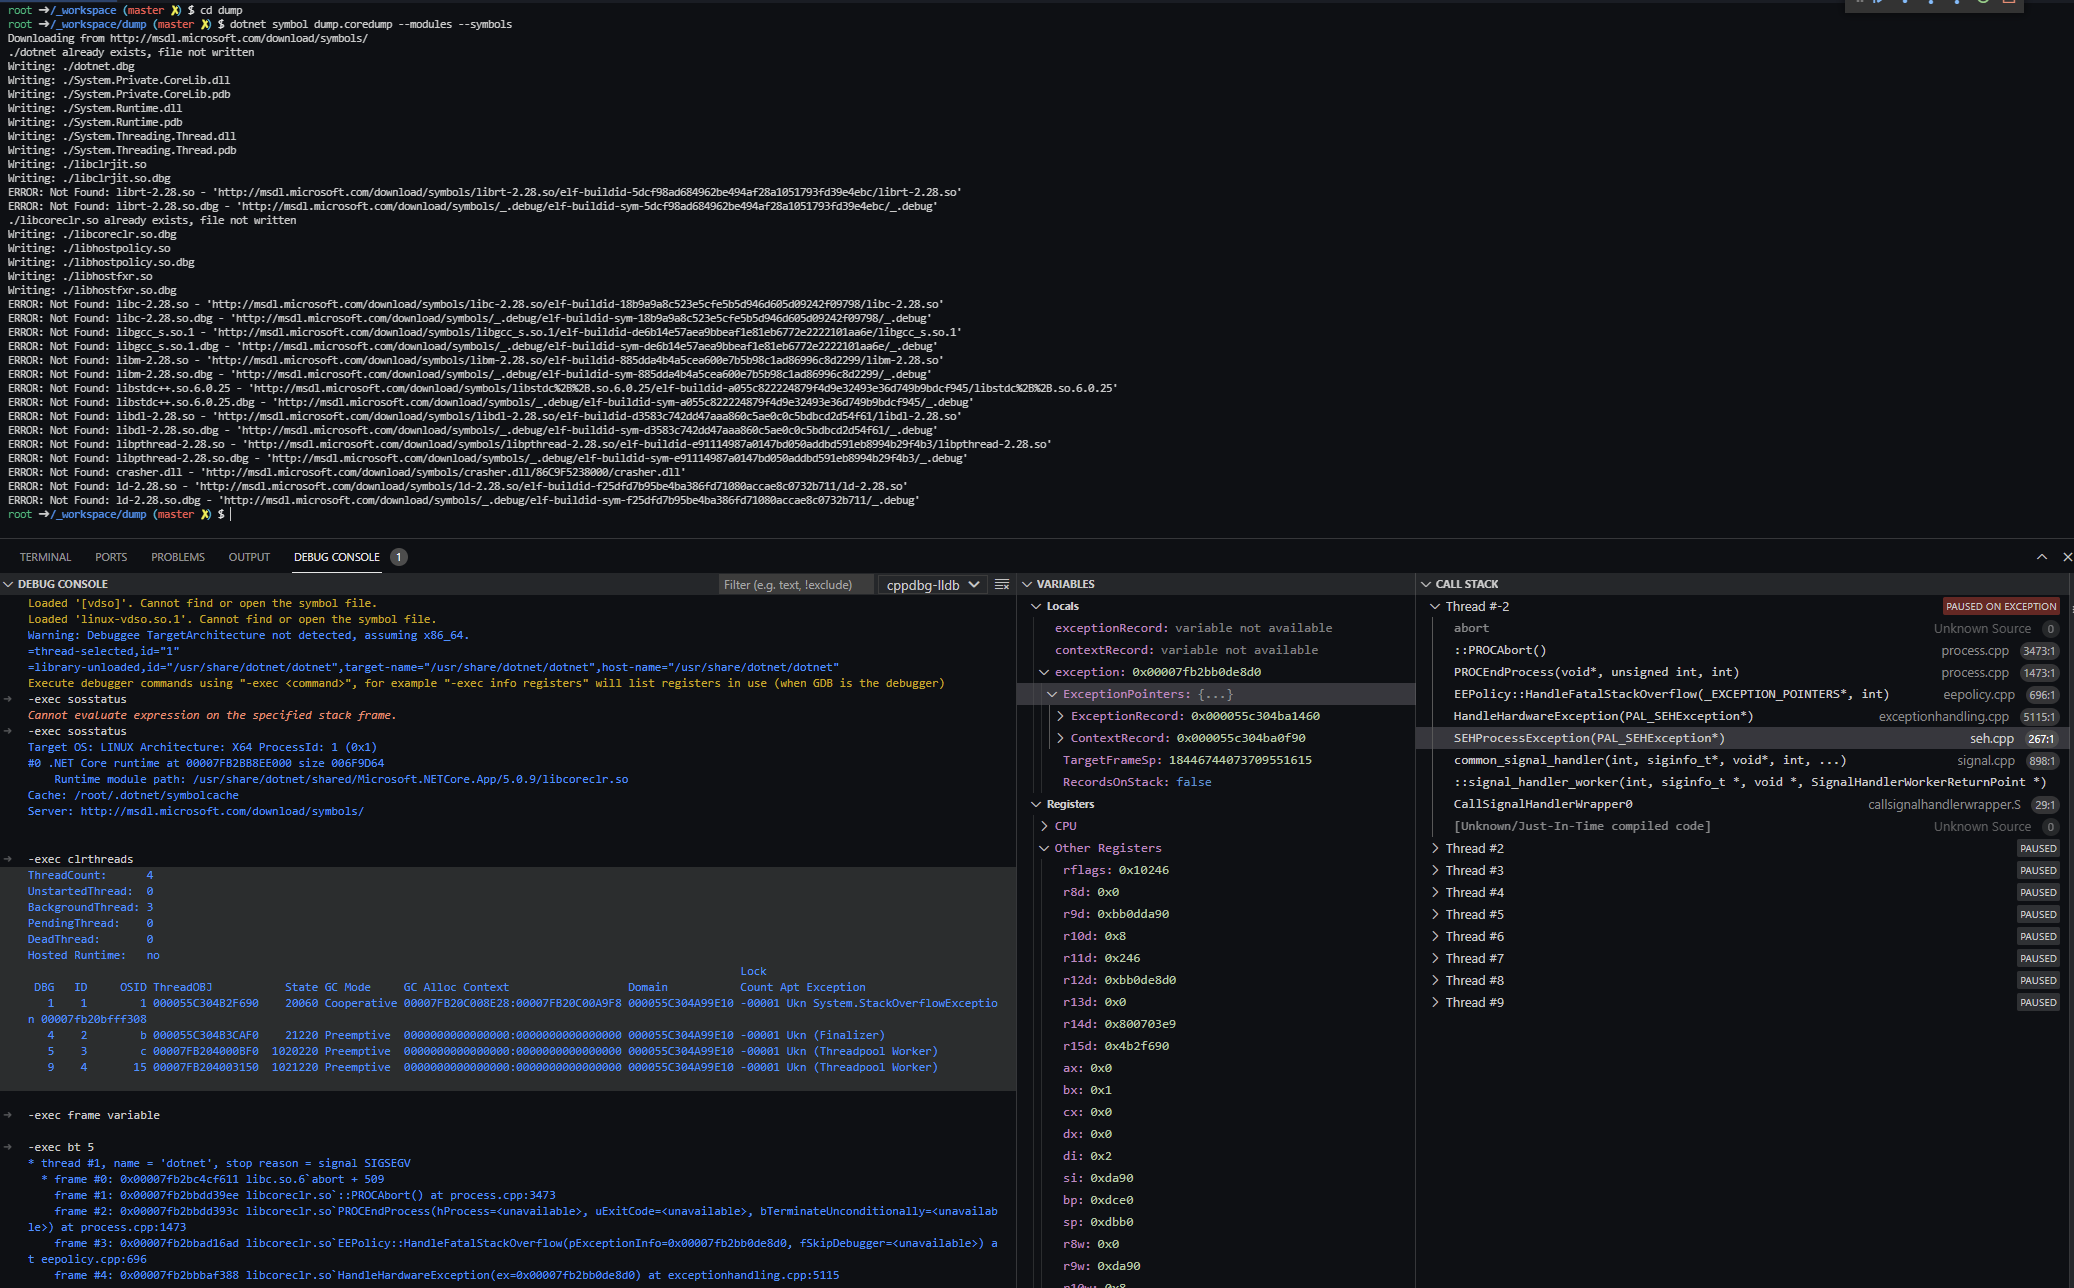
You can use Microsoft C++ extension to debug the native part of coredump.
-
Debian and Ubuntu use old lldb with lldb-mi on board, so no additional steps for these OS. For this you should:
-
Alpine uses newer lldb without lldb-mi
So you should be able to compile your own lldb-mi for this.
- uncomment
ms-vscode.cpptoolsline in `.devcontainer/devcontainer.json or install the C++ extension inside devcontainer by youself; - if you don't use
dump.coredumpname for your dump, change thecoreDumpPathproperty in.vscode/launch.json - you can load additional runtime symbols with command:
dotnet symbol dump.coredump --symbols --modules --overwrite - change run target under debug tab to
cppdbg-lldb; - run
Debug;
You can use sos commands as usual from the vscode debug console with -exec <sos_or_lldb_command>.
You can use these linux commands (works fine from wsl, if you are on Windows)
strings dump.coredump | grep @Commit
I don't know the 100% solution for that, but we can that a dump is an Alpine dump with musl.
Musl is a C standard library which is used by Alpine and it should be refereced from DAC.
Thus, after downloading the DAC (automatically for dump/dump.coredump or manually with dotnet symbol {dumpPath} --debugging) you can verify that libmusl is presented.
ldd libmscordaccore.so
There are several ways to do it. The easiest way (and I think the only one that works on Docker on WSL 2) it's to use
createdump utility, which is provided with runtime. For example:
/usr/share/dotnet/shared/Microsoft.NETCore.App/5.0.9/createdump --full -f /_workspace/dump/%t.coredump <PID>
AFAIK there are no easy ways to use it with automatically collected crash dumps and default crash dumps sometimes
couldn't be loaded. In that case you will see something like CreateDacInstance failed 0x80131c4f (in ClrMD or logging enable + lldb) or Failed to load data access module, 0x80004002). I recommend to set coredump_filter to 0xFF. You can do it with kernel loading params or per process with: echo 0xFF > /proc/<pid>/coredump_filter. All child processes inherit the filter of the parent. So you can specify filters on all presented processes (on the k8s node for example) and after that, you don't need to setup the kernel loading params.
# sets coredump_filter for all current running processes
find /proc/ -name coredump_filter -exec sh -c 'echo 0xFF > {} || exit 0' \;
# verify that all processes have 0xFF filter now
find /proc/ -name coredump_filter -exec cat {} \;
after that all your containers on k8s node will have the 0xFF coredump_filter. You can do it from privileged container. Don't forget to specify /proc/sys/kernel/core_pattern to get dumps.
Yama is a Linux Security Module, for PTRACE_ATTACH (attach to any other process running under the same uid) you may need to set to 0
echo 0 > /proc/sys/kernel/yama/ptrace_scope


