This repository contains the source code for the "LASPATED: A Library for the Analysis of Spatio-Temporal Discrete Data" paper (Arxiv link).
LASPATED Python and MATLAB code were tested under Windows 10/Linux systems. The C++ code was tested under Linux systems only.
For installation instructions check INSTALL.md.
The following example shows basic usage of the python package:
app = spated.DataAggregator(crs="epsg:4326")

max_borders = gpd.read_file(
        r"../Data/rj/rj.shp"
    )  # Load the geometry of region of interest
app.add_max_borders(max_borders)

events = pd.read_csv(r"../Data/sorted_events.csv", encoding="ISO-8859-1", sep=",")
app.add_events_data(
    events,
    datetime_col="data_hora",
    lat_col="lat",
    lon_col="long",
    feature_cols=["prioridade"],
    datetime_format="%m/%d/%y %H:%M:%S",
)  # %m/%d/%y %H:%M:%S


app.add_time_discretization("m", 30, 60 * 24, column_name="hhs")

app.add_geo_discretization(
        discr_type="R", rect_discr_param_x=10, rect_discr_param_y=10
    )

app.plot_discretization()
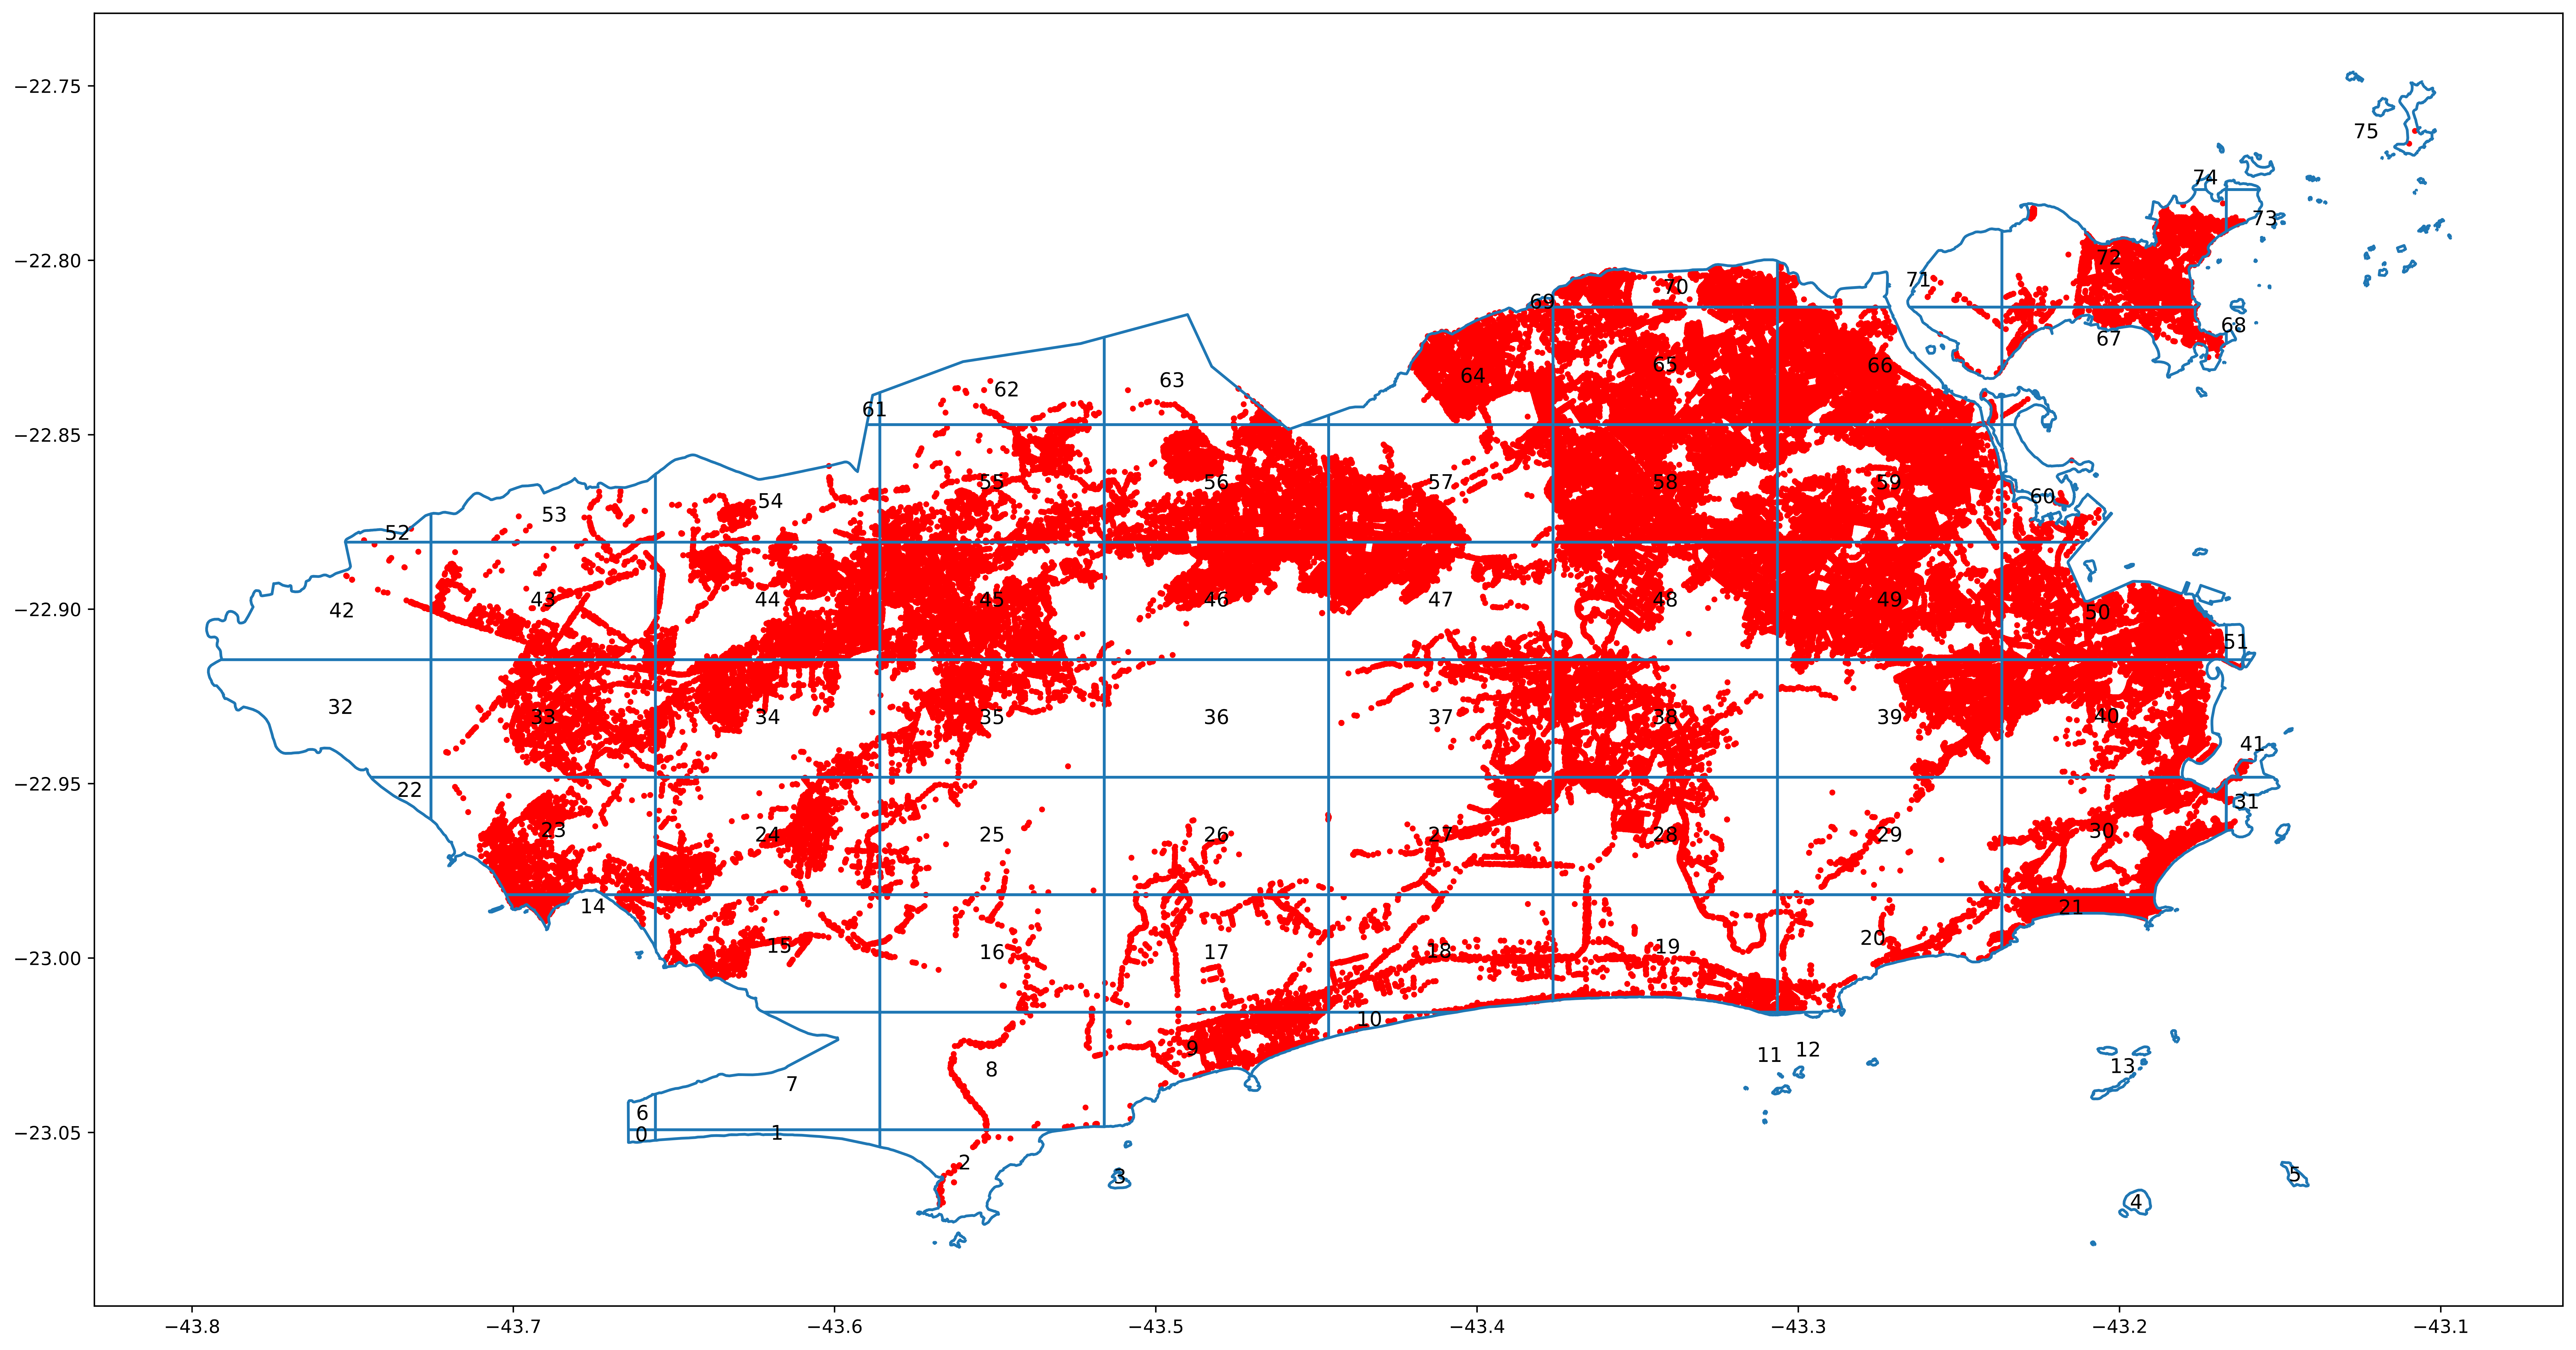
First, the data aggregator is loaded and a Shapefile describing the city of Rio de Janeiro is used as a bounding border. Next, medical emergency data from Rio de Janeiro is loaded. Next, we define a time discretization of 30 minutes for each day and a space discretization of Rio de Janeiro into a grid with a maximum of 10 x 10 rectangles. Finally, we plot the space discretization, generating the following image:
LASPATED also provides a C++ application, that given discretized data (possibly generated by the Python module), performs likelihood estimation of the intensities. After compiling the code (see the Installation guide), run:
./laspated --model_type=no_reg --method=calibration --algorithm=feasible
--info_file=info.txt --arrivals_file=arrivals.txt --neighbors_file=neighbors.txt --alpha_regions_file=alpha_regions.txt
--time_groups_file=time_groups.txt --durations_file=durations.txt
--output_file=output.txt
The command above will perform the likelihood estimation (method=calibration) using a projected gradient algorithm along the feasible region (algorithm=feasible) with a regularized model without covariates (model_type=no_reg). The user must also provide files with general data about the model (--info_file), data about the arrivals events (--arrivals_file), data about the regions under study (--neighbors_file), a space regularization matrix (--alpha_regions_file), a grouping of periods for time regularization (--time_groups_file) and a file describing the duration of each period. The estimated intensities are saved in the path provided by the --output_file option. For details about the format of each file, check the LASPATED user manual.
The user can also provide a configuration file and run the app with the -f option:
./laspated -f config.cfg
Directory Data contains Shapefiles and data files that are used in the code examples. It includes a Rio de Janeiro and New York border Shapefiles, a csv and Shapefile with location of ambulance bases from Rio, covariates Data from Rio, and a Shapefile with Rio's administrative regions. It also includes csv files with Ambulance emergency data from Rio, and a mock csv simulating emergency data from New York.
Contains the laspated python module source code, that can be installed on your system via pip.
Contains the source code of the MATLAB, Octave and C++ functions.
A docker container is available at DockerHub and also via the Dockerfile in the project root directory. See the INSTALL.md on how to generate the container.
