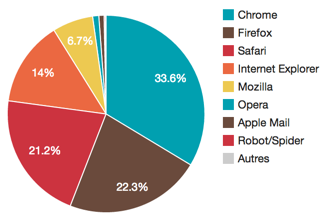
Snowplow-dashboard that lets you build beautiful dashboards over your Snowplow Redshift Database, in one line of Ruby. Based on Rorschart.
<%= pie_chart Event.group(:br_family).count %>Hot !
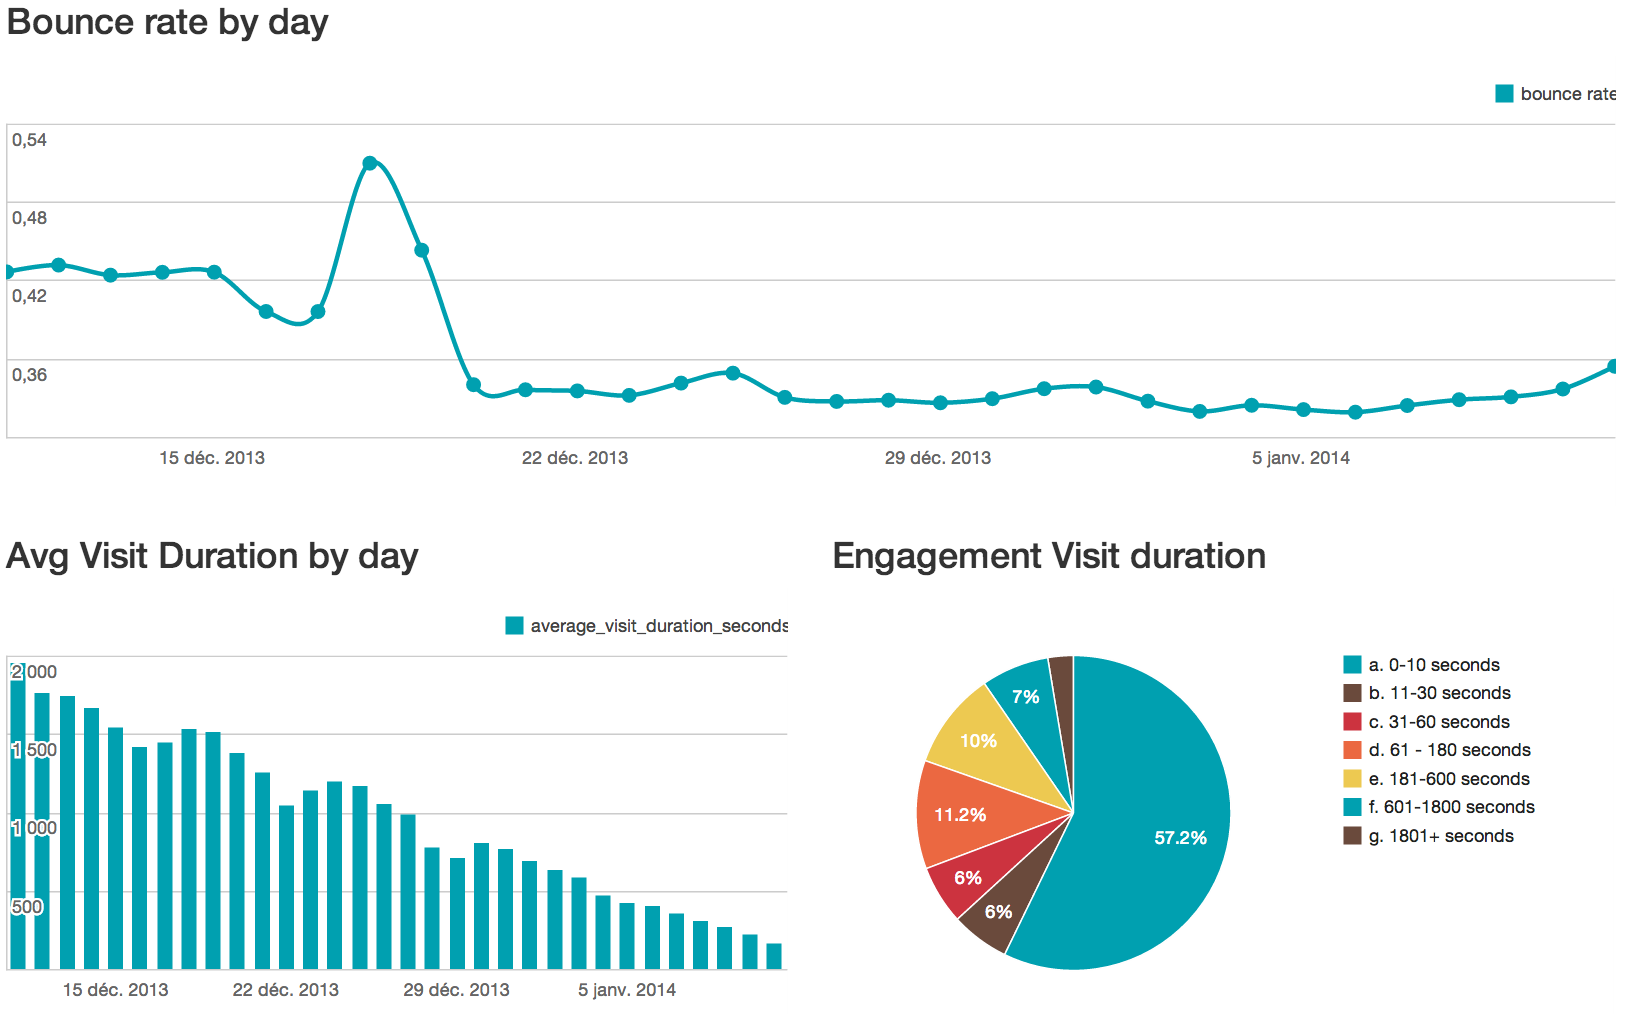
Example using Haml and Bootstrap
.row
    %h3 Bounce rate by day
    = line_chart RecipesBasic.bounce_rate_by_day
.row
    .col-md-6
        %h3 Avg Visit Duration by day
        = column_chart RecipesBasic.avg_visit_duration_by_day
    .col-md-6
        %h3 Engagement Visit duration
= pie_chart RecipesBasic.engagement_visit_durationSnowplow provides dozen of standard Web analytics recipes.
We provide three Models RecipesBasic, RecipesCustomer, RecipesCatalog. Just call the method that you want, and choose the appropriate chart representation.
line_chart RecipesBasic.pages_per_visit
table_chart RecipesBasic.behavior_frequency
pie_chart RecipesBasic.technology_browser
line_chart RecipesBasic.uniques_and_visits_by_dayEvent.group_per_day.count_visitors.where(page_urlpath: "/step/profile").during_last 30.daysFeatures to document:
- Queries from raw SQL
- Queries from your organization Analytics DSL
- Asynchronous Ajax loading
- Caching
- Heroku ready
- A/B testing Methodology
Distributed under the MIT license.

