This microservices branch was initially derived from AngularJS version to demonstrate how to split sample Spring application into microservices. To achieve that goal, we use Spring Cloud Gateway, Spring Cloud Circuit Breaker, Spring Cloud Config, Spring Cloud Sleuth, Resilience4j, Micrometer and the Eureka Service Discovery from the Spring Cloud Netflix technology stack.
Every microservice is a Spring Boot application and can be started locally using IDE (Lombok plugin has to be set up) or ../mvnw spring-boot:run command. Please note that supporting services (Config and Discovery Server) must be started before any other application (Customers, Vets, Visits and API).
Startup of Tracing server, Admin server, Grafana and Prometheus is optional.
If everything goes well, you can access the following services at given location:
- Discovery Server - http://localhost:8761
- Config Server - http://localhost:8888
- AngularJS frontend (API Gateway) - http://localhost:8080
- Customers, Vets and Visits Services - random port, check Eureka Dashboard
- Tracing Server (Zipkin) - http://localhost:9411/zipkin/ (we use openzipkin)
- Admin Server (Spring Boot Admin) - http://localhost:9090
- Grafana Dashboards - http://localhost:3000
- Prometheus - http://localhost:9091
You can tell Config Server to use your local Git repository by using native Spring profile and setting
GIT_REPO environment variable, for example:
-Dspring.profiles.active=native -DGIT_REPO=/projects/spring-petclinic-microservices-config
In order to start entire infrastructure using Docker, you have to build images by executing ./mvnw clean install -P buildDocker
from a project root. Once images are ready, you can start them with a single command
docker-compose up. Containers startup order is coordinated with dockerize script.
After starting services, it takes a while for API Gateway to be in sync with service registry,
so don't be scared of initial Spring Cloud Gateway timeouts. You can track services availability using Eureka dashboard
available by default at http://localhost:8761.
The master branch uses an Alpine linux with JRE 8 as Docker base. You will find a Java 11 version in the release/java11 branch.
NOTE: Under MacOSX or Windows, make sure that the Docker VM has enough memory to run the microservices. The default settings
are usually not enough and make the docker-compose up painfully slow.
If you experience issues with running the system via docker-compose you can try running the ./scripts/run_all.sh script that will start the infrastructure services via docker-compose and all the Java based applications via standard nohup java -jar ... command. The logs will be available under ${ROOT}/target/nameoftheapp.log.
Each of the java based applications is started with the chaos-monkey profile in order to interact with Spring Boot Chaos Monkey. You can check out the (README)[scripts/chaos/README.md] for more information about how to use the ./scripts/chaos/call_chaos.sh helper script to enable assaults.
See the presentation of the Spring Petclinic Framework version
A blog post introducing the Spring Petclinic Microsevices (french language)
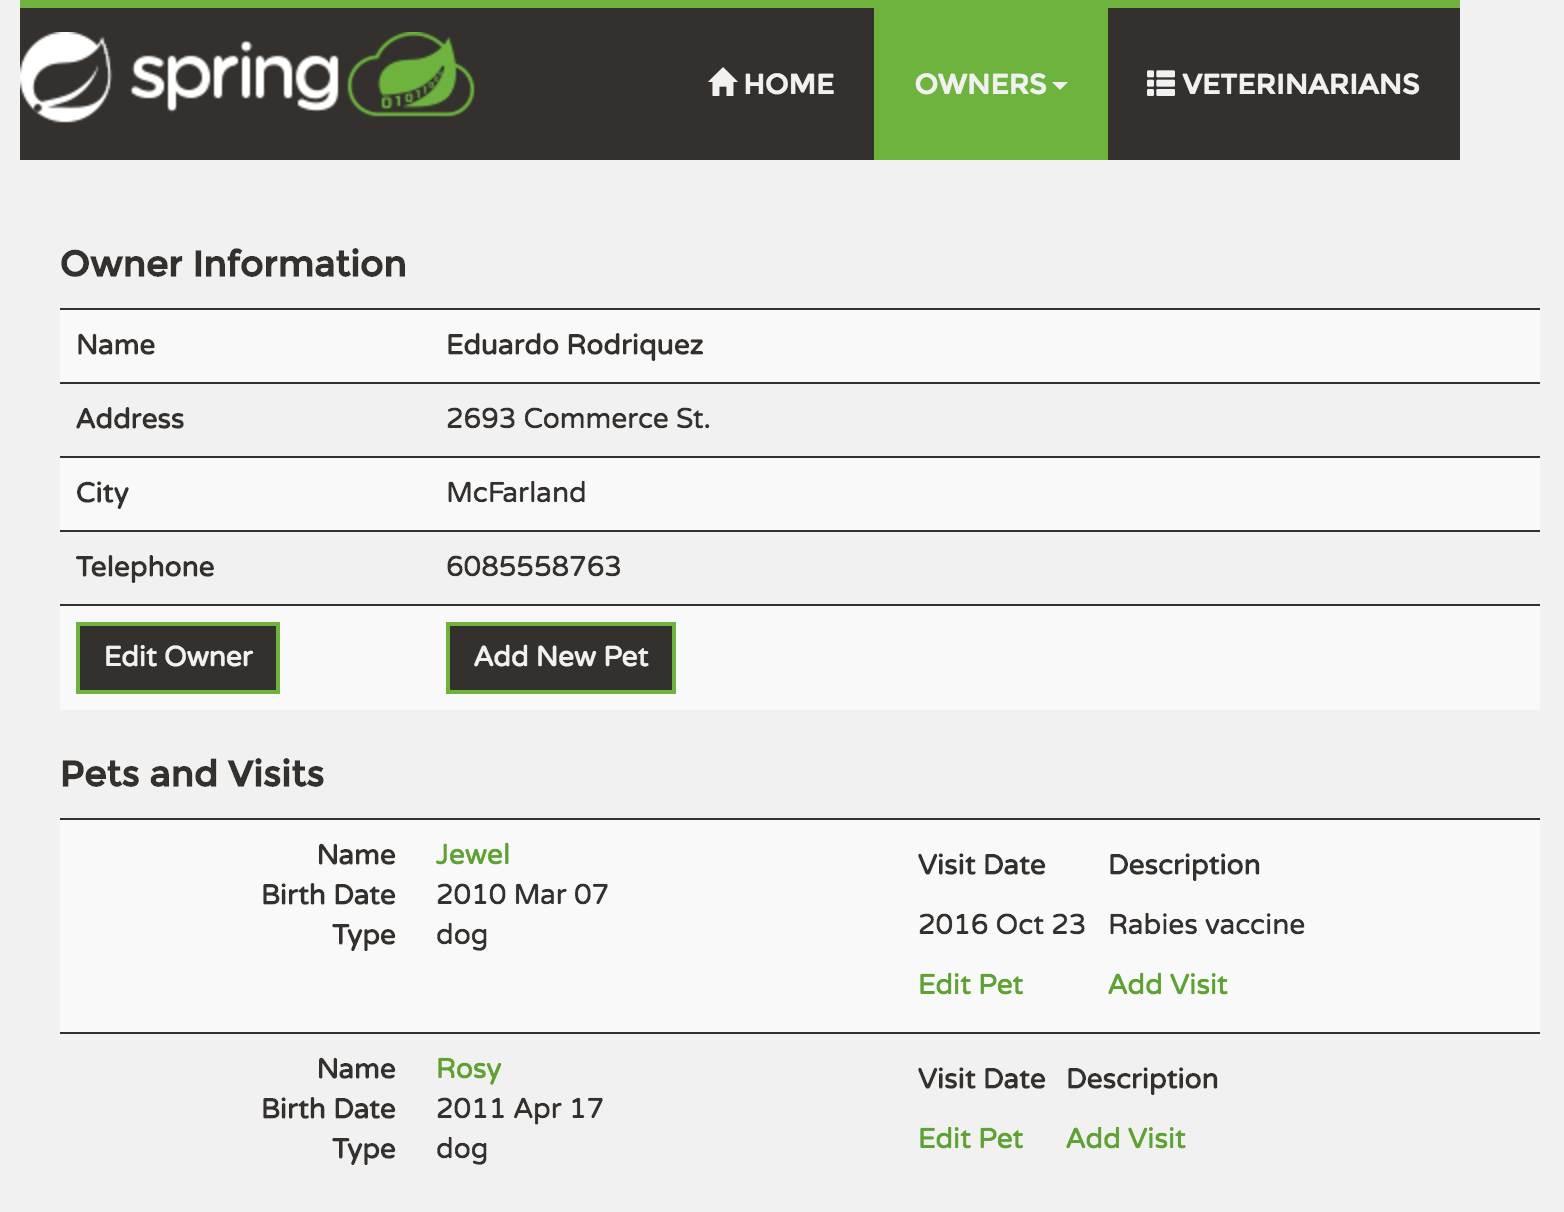
You can then access petclinic here: http://localhost:8080/
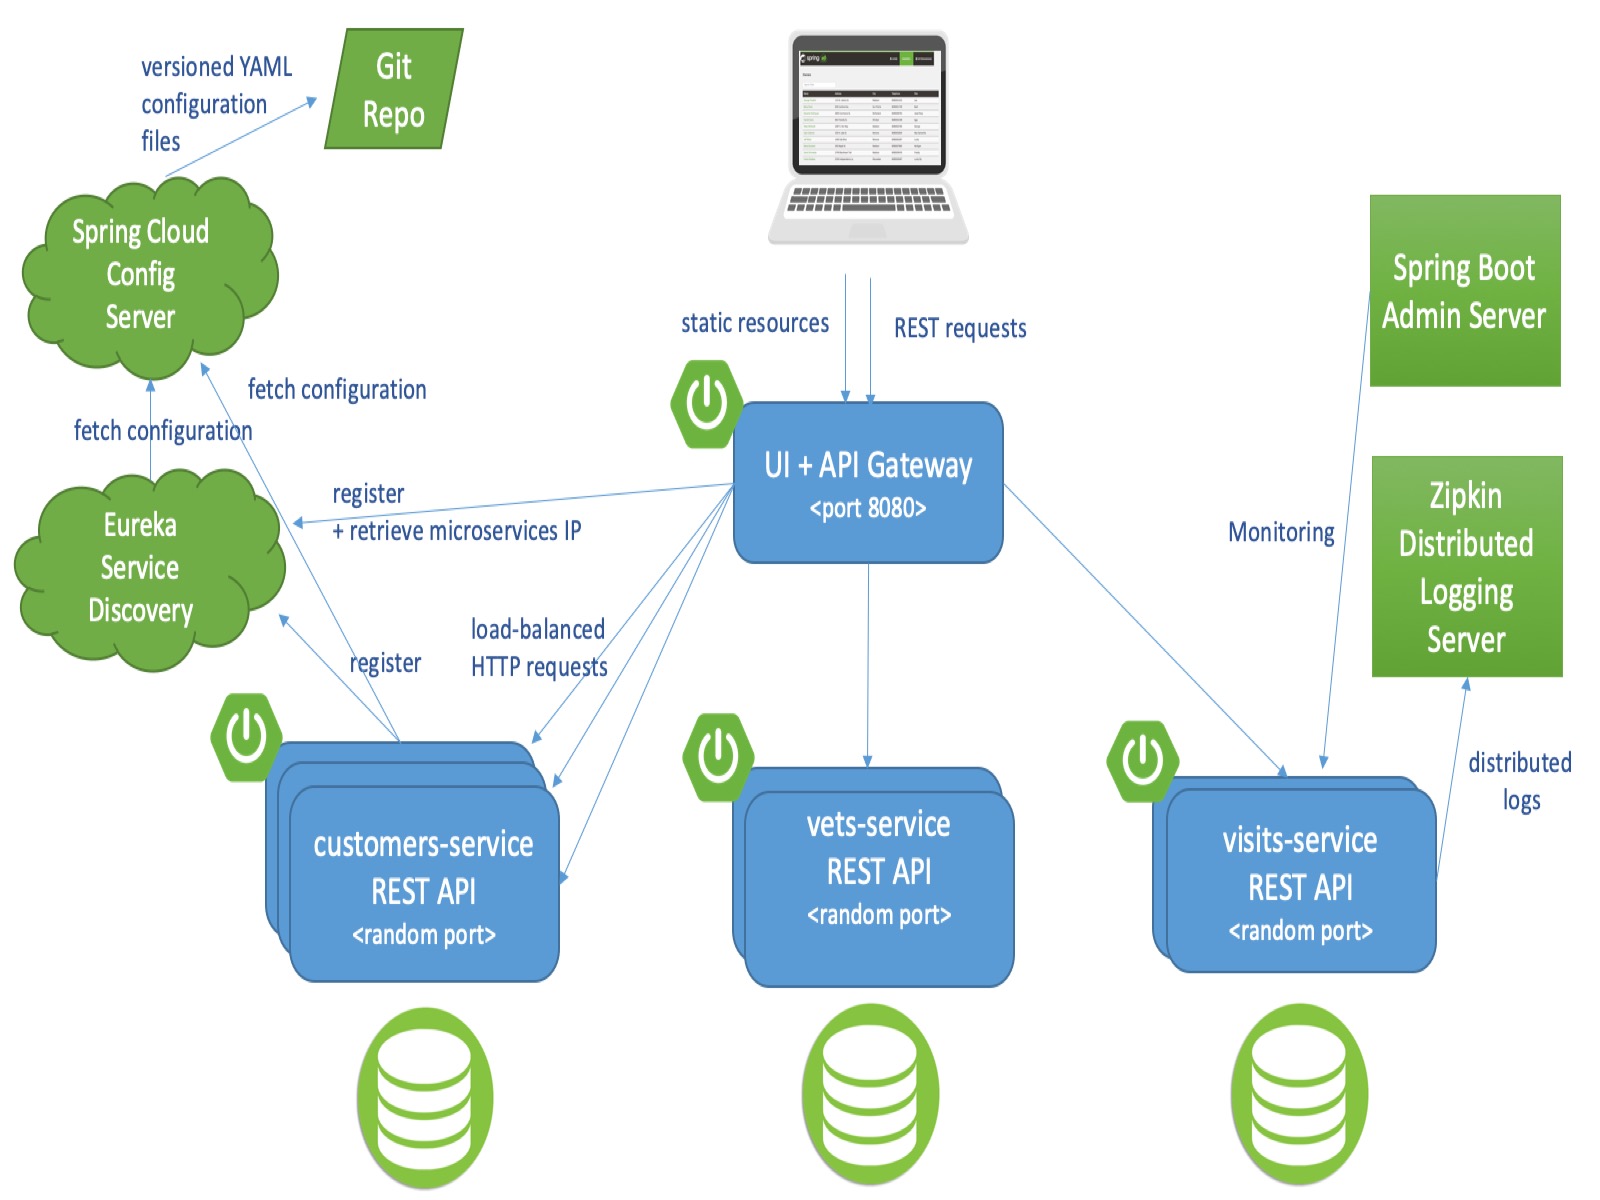
Architecture diagram of the Spring Petclinic Microservices
Our issue tracker is available here: https://github.com/spring-petclinic/spring-petclinic-microservices/issues
In its default configuration, Petclinic uses an in-memory database (HSQLDB) which gets populated at startup with data.
A similar setup is provided for MySql in case a persistent database configuration is needed.
Dependency for Connector/J, the MySQL JDBC driver is already included in the pom.xml files.
You may start a MySql database with docker:
docker run -e MYSQL_ROOT_PASSWORD=petclinic -e MYSQL_DATABASE=petclinic -p 3306:3306 mysql:5.7.8
or download and install the MySQL database (e.g., MySQL Community Server 5.7 GA), which can be found here: https://dev.mysql.com/downloads/
To use a MySQL database, you have to start 3 microservices (visits-service, customers-service and vets-services)
with the mysql Spring profile. Add the --spring.profiles.active=mysql as programm argument.
By default, at startup, database schema will be created and data will be populated.
You may also manually create the PetClinic database and data by executing the "db/mysql/{schema,data}.sql" scripts of each 3 microservices.
In the application.yml of the Configuration repository, set the initialization-mode to never.
If you are running the microservices with Docker, you have to add the mysql profile into the (Dockerfile)[docker/Dockerfile]:
ENV SPRING_PROFILES_ACTIVE docker,mysql
In the mysql section of the application.yml from the Configuration repository, you have to change
the host and port of your MySQL JDBC connection string.
Grafana and Prometheus are included in the docker-compose.yml configuration, and the public facing applications
have been instrumented with MicroMeter to collect JVM and custom business metrics.
A JMeter load testing script is available to stress the application and generate metrics: petclinic_test_plan.jmx
- Prometheus can be accessed from your local machine at http://localhost:9091
- An anonymous access and a Prometheus datasource are setup.
- A
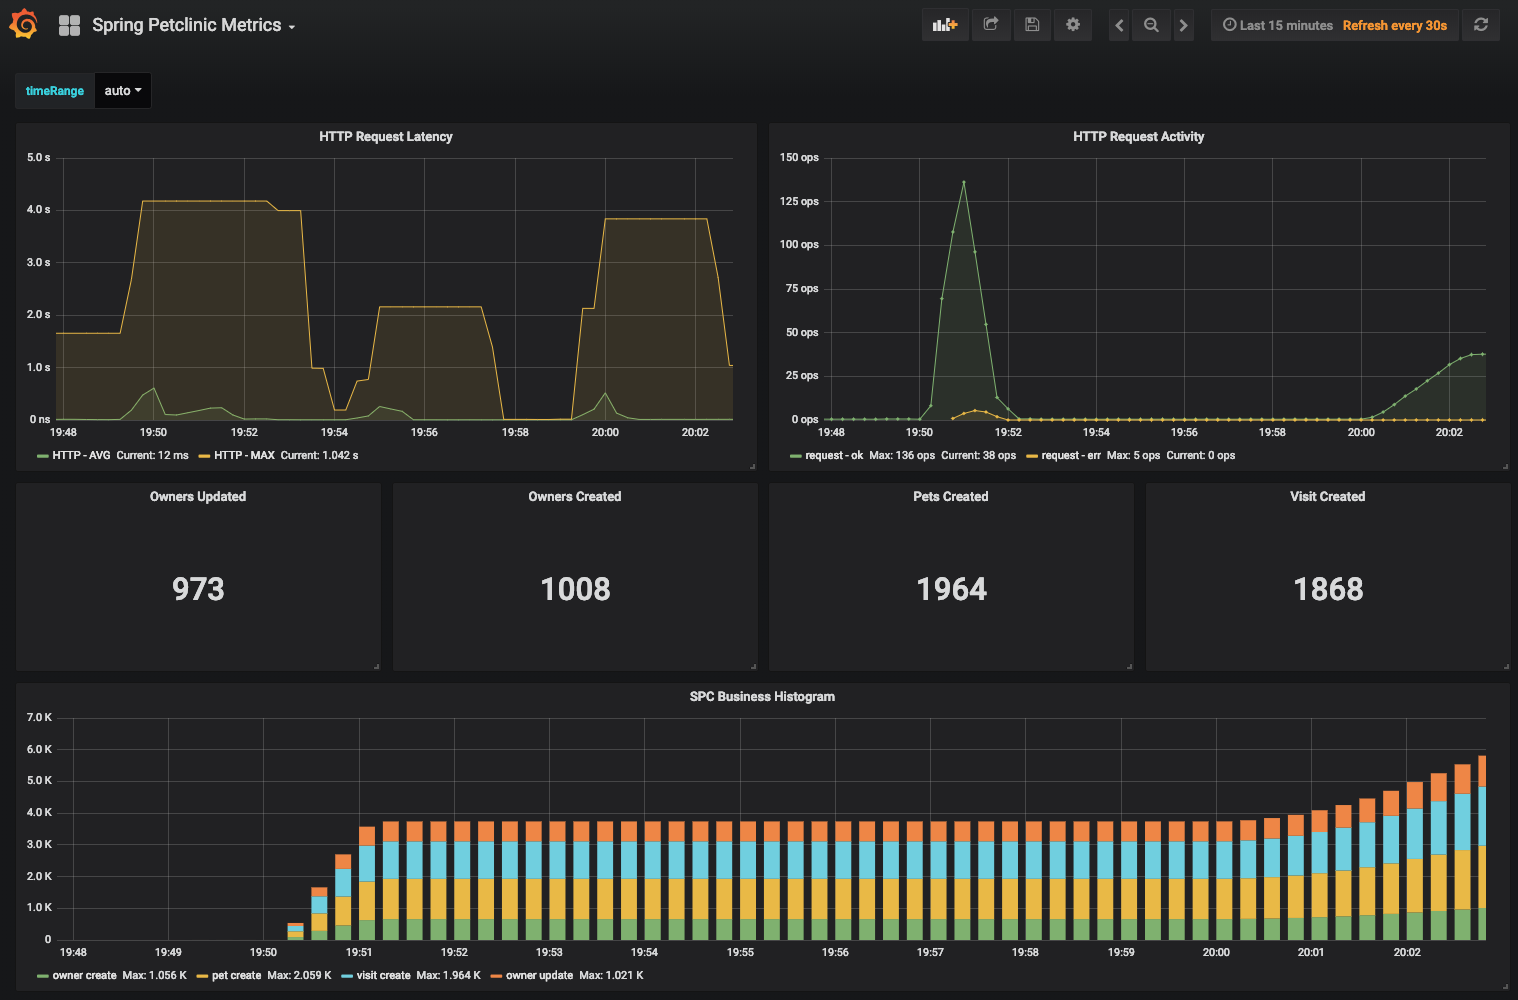
Spring Petclinic MetricsDashboard is available at the URL http://localhost:3000/d/69JXeR0iw/spring-petclinic-metrics. You will find the JSON configuration file here: docker/grafana/dashboards/grafana-petclinic-dashboard.json. - You may create your own dashboard or import the Micrometer/SpringBoot dashboard via the Import Dashboard menu item.
The id for this dashboard is
4701.
Spring Boot registers a lot number of core metrics: JVM, CPU, Tomcat, Logback...
The Spring Boot auto-configuration enables the instrumentation of requests handled by Spring MVC.
All those three REST controllers OwnerResource, PetResource and VisitResource have been instrumented by the @Timed Micrometer annotation at class level.
customers-serviceapplication has the following custom metrics enabled:- @Timed:
petclinic.owner - @Timed:
petclinic.pet
- @Timed:
visits-serviceapplication has the following custom metrics enabled:- @Timed:
petclinic.visit
- @Timed:
| Spring Cloud components | Resources |
|---|---|
| Configuration server | Config server properties and Configuration repository |
| Service Discovery | Eureka server and Service discovery client |
| API Gateway | Spring Cloud Gateway starter and Routing configuration |
| Docker Compose | Spring Boot with Docker guide and docker-compose file |
| Circuit Breaker | Resilience4j fallback method |
| Grafana / Prometheus Monitoring | Micrometer implementation, Spring Boot Actuator Production Ready Metrics |
The Spring Petclinic main branch in the main spring-projects
GitHub org is the "canonical" implementation, currently based on Spring Boot and Thymeleaf.
This spring-petclinic-microservices project is one of the several forks hosted in a special GitHub org: spring-petclinic. If you have a special interest in a different technology stack that could be used to implement the Pet Clinic then please join the community there.
The issue tracker is the preferred channel for bug reports, features requests and submitting pull requests.
For pull requests, editor preferences are available in the editor config for easy use in common text editors. Read more and download plugins at http://editorconfig.org.


