A Linear Regression model to predict the car prices for the U.S market to help a new entrant understand important pricing factors/variables in the U.S automobile industry. A highly comprehensive analysis with all data cleaning, exploration, visualization, feature selection, model building, evaluation and MLR assumptions validity steps explained in detail.
1- Data understanding and exploration
2- Data cleaning
3- Data preparation: Feature Engineering and Scaling
4- Feature Selection using RFE and Model Building
5- Linear Regression Assumptions Validation and Outlier Removal
6- Rebuilding the Model Post Outlier Removal: Feature Selection using K-Fold Cross Validation & RFE
7- Removing Multicollinearity, Model Re-evaluation and Assumptions Validation
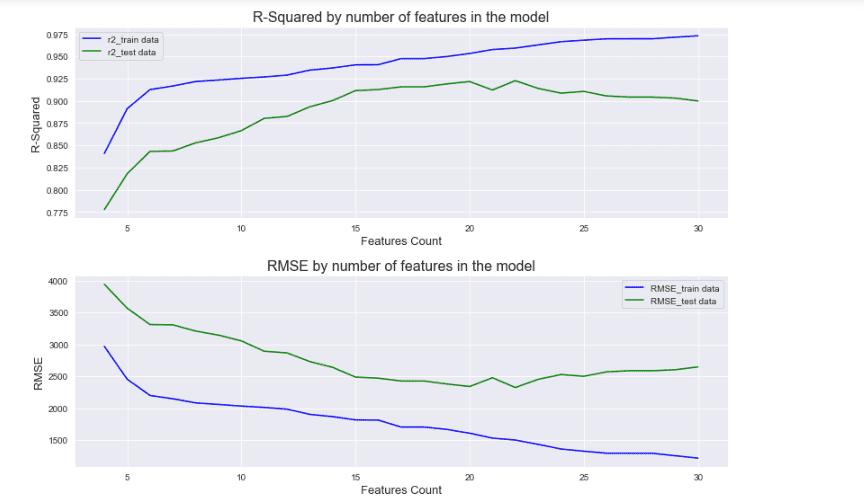
Determining optimum number of features in model by checking performance metrics R-Squared and RMSE at different counts of features
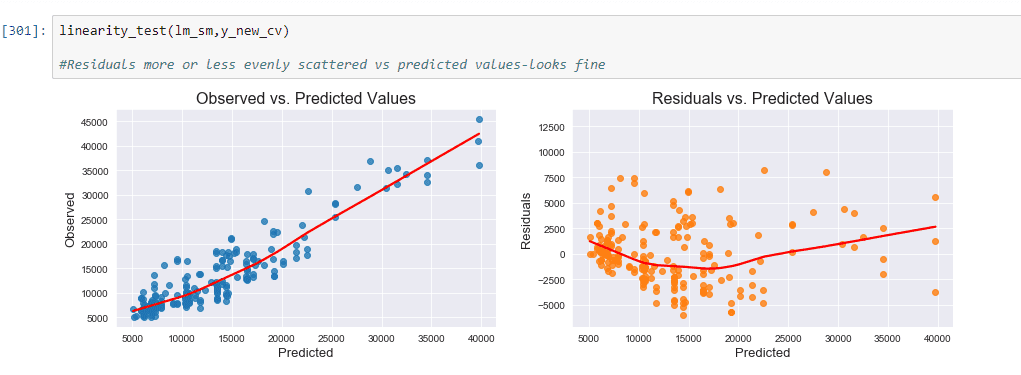
Assumption_Presence of Linear Relationship: Holds as residuals more or less evenly scattered vs predicted values
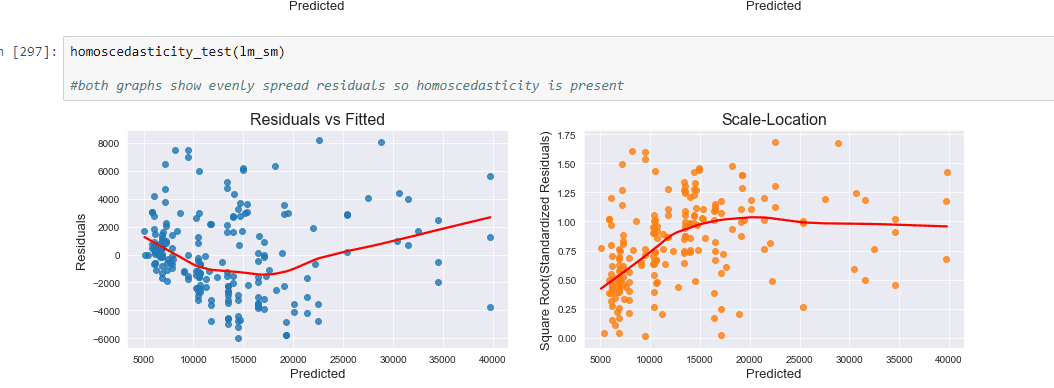
Assumption_Presence of Homoscedasticity: Both graphs show evenly spread residuals so homoscedasticity is present
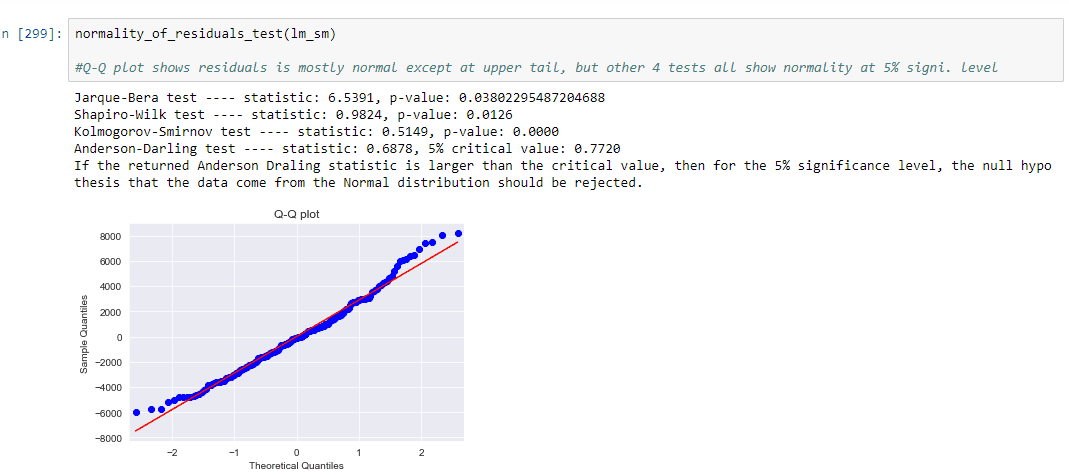
Assumption_Normality of Residuals: Q-Q plot shows residuals is mostly normal except at upper tail, but other 4 tests all show normality at 5% signi. level
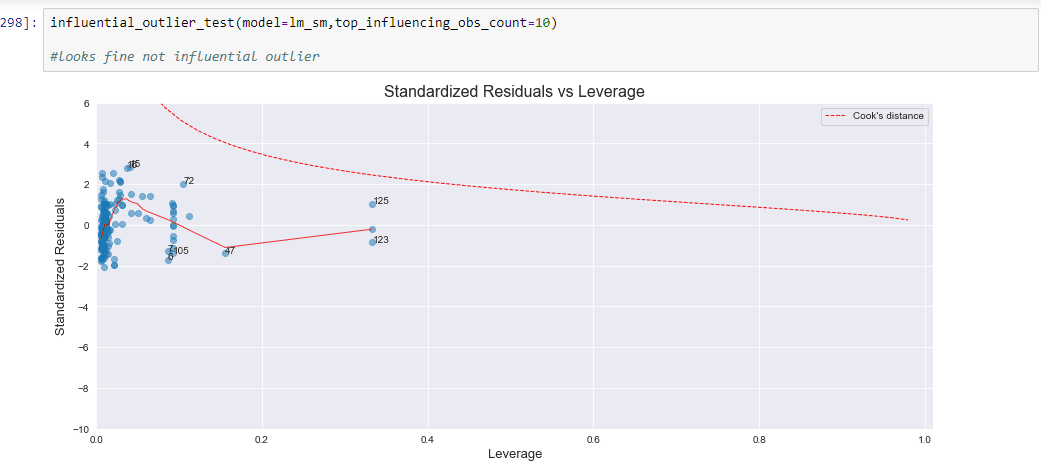
Assumption_Absence of Outliers: No point beyong cooks distance line so no outlier is present
