Based on my Spotify Wrapped for 2019, I accumulated 120,000+ minutes of listening which translates to over 2000 hours, which also translates to a whooping 83.3 days. So I do consider myself a huge music enthusiast and enjoy exploring all the different genres music has to offer. Because of my extensive listening history, I realized I had a lot of data to work with to create a classifier that will state whether or not I would like to listen to a song or not.
- Two datasets: "StreamingHistory.csv" (my Spotify listening history) and "SpotifyFeatures.csv" (dataset with songs and song features)
- StreamingHistory.csv was obtained through Spotify with a json drop.
- SpotifyFeatures.csv was downloaded from kaggle. (https://tinyurl.com/y7mpts3e)
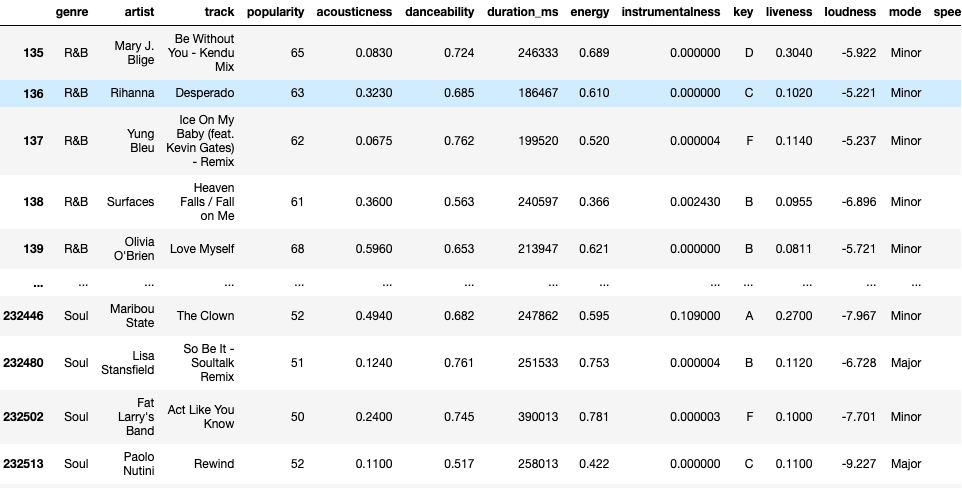
StreamingHistory.csv has 66,203 rows and 4 columns (Artist, Date, msPlayed, trackName). SpotifyFeatures.csv contains 223,044 rows and 17 columns. Of these 17 columns, 14 are related to a song's feautures such as popularity, mode, key, and etc. Moreover, each row represents an individual song.
All music in Spotify are given song features to describe the audio. For example, 1 in "acousticness" indicates a high level of confidence that the track is acoustic. If we wan't to find a good dancing song, the "danceability" feature with the value of 1 says that the song is perfect to dance to. With these values, we can explore to see if we prefer certain values more than others. What if we enjoy more acoustic music? Then, we would find more songs with lower values in acousticness. This is how we will recommend songs, by identifying features with the highest correlations to our favorite songs.
(Read more about the features here: https://developer.spotify.com/documentation/web-api/reference/tracks/get-audio-features/)
In this project, I will build a song recommender based on my personal Spotify listening history and a Spotify song features dataset. To accomplish this, I will compare 3 classifier models:
- Logistic Regression
- Decision Trees
- Random Forest
I will evaluate each model based on the F1 score.
The F1 score enables us to take into account false negatives and false positives when calculating the accuracy of a model. If we use the generic accuracy_score method, false positives would be considered as correct predictions which is something that is inaccurate and would mislead me into thinking my model is more accurate than it is.
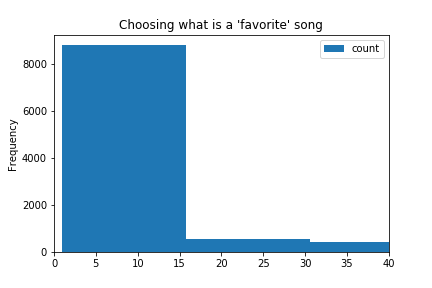
Our prediction variable will be called "favorite" with 1 representing a well-liked song and 0 representing otherwise. But, what is a 'favorite' song? I decided to label songs with more than 15 listens as a favorite and those with less as not.
Why 15? When I plotted the song counts on a histogram, there was a substantial drop in song frequencies after 15. These cutoff seemed like a perfect place to differentiate songs that I casual listen to versus songs that I truly enjoy.
I was able to train a Logistic Regresssion model with a F1 score of 86% on unseen test data. The RandomForest model came in close at 84% while the DecisionTrees model was last at 73%.
Moreover, this project has enabled me to obtain a mass recommendation of songs at once instead of having to go through options such as Discover Weekly (limited to 30 songs), look through different playlists, or opt for a playlist radio.
This project has also created two actionable next steps. First, I created a script that enables me to automate playlist creations by converting .csv recommendation files into a Spotify playlist.
- Link to that script can be found here: https://github.com/isacmlee/csv-to-playlist.
Second, I have also productionized a version of this model at http://www.whatspopping.xyz/. If curious, please give it a try! :)

