Submitted by - Vishal Rangras
Click here for Vehicle Detection and Tracking Project
The goals / steps of this project are the following:
- Compute the camera calibration matrix and distortion coefficients given a set of chessboard images.
- Apply a distortion correction to raw images.
- Use color transforms, gradients, etc., to create a thresholded binary image.
- Apply a perspective transform to rectify binary image ("birds-eye view").
- Detect lane pixels and fit to find the lane boundary.
- Determine the curvature of the lane and vehicle position with respect to center.
- Warp the detected lane boundaries back onto the original image.
- Output visual display of the lane boundaries and numerical estimation of lane curvature and vehicle position.
Rubric Points
Here I will consider the rubric points individually and describe how I addressed each point in my implementation.
You're reading it!
1. Briefly state how you computed the camera matrix and distortion coefficients. Provide an example of a distortion corrected calibration image.
There are two functions defined as draw_corners and undistort_img which serves the purpose of Camera Calibration and removing distortin from the input image. These two functions are defined in 3rd cell of my jupyter notebook located in. The code for this step is contained in the first code cell of the IPython notebook
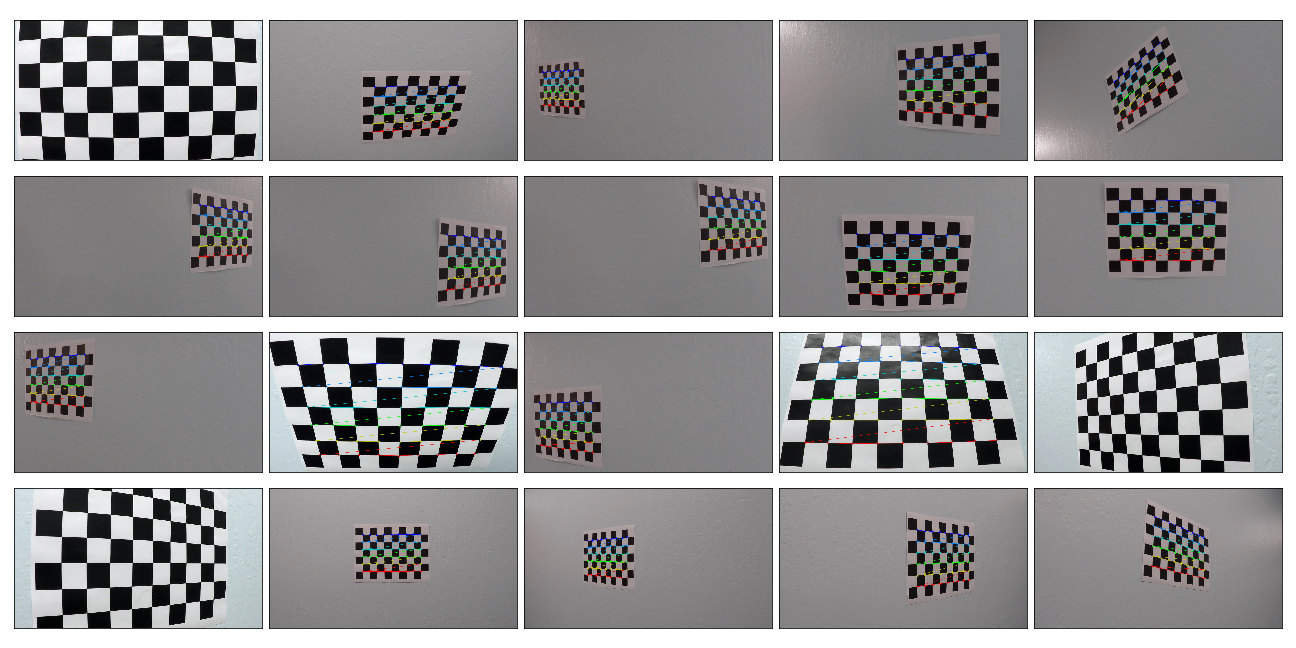
In 2nd cell of Jupyter notebook, imgpoints and objpoints empty lists are declared and one object point called "objp" is defined which is a replicated array of coordinates such that object points will be same for each calibration image. objpoints and imgpoints will be appended to the list every time the draw_corner() function successfully detect all the chessboard corners in a test image. The draw_corner function applies cv2.findChessboardCorners on a grayscale chessboard image to obtain the corners in the image. For the images where corners can be found, cv2.drawChessboardCorners function is used to draw the corners on original color image of the chessboard. imgpoints and objpoints are appended in the list only for those images where the corners are found. I used provided 20 Camera Calibration images to detect corners, image points and object points from the same. For 17 out of total 20 images, the cv2.findChessboardCorners function was able to identify the corners. For the remaining 3, it was not able to identify because the images are cropped from some or the other portion such that total number of inner corners are not 9 x 6. All the images are combined in a single grid and are displayed below.
Chessboard Corners
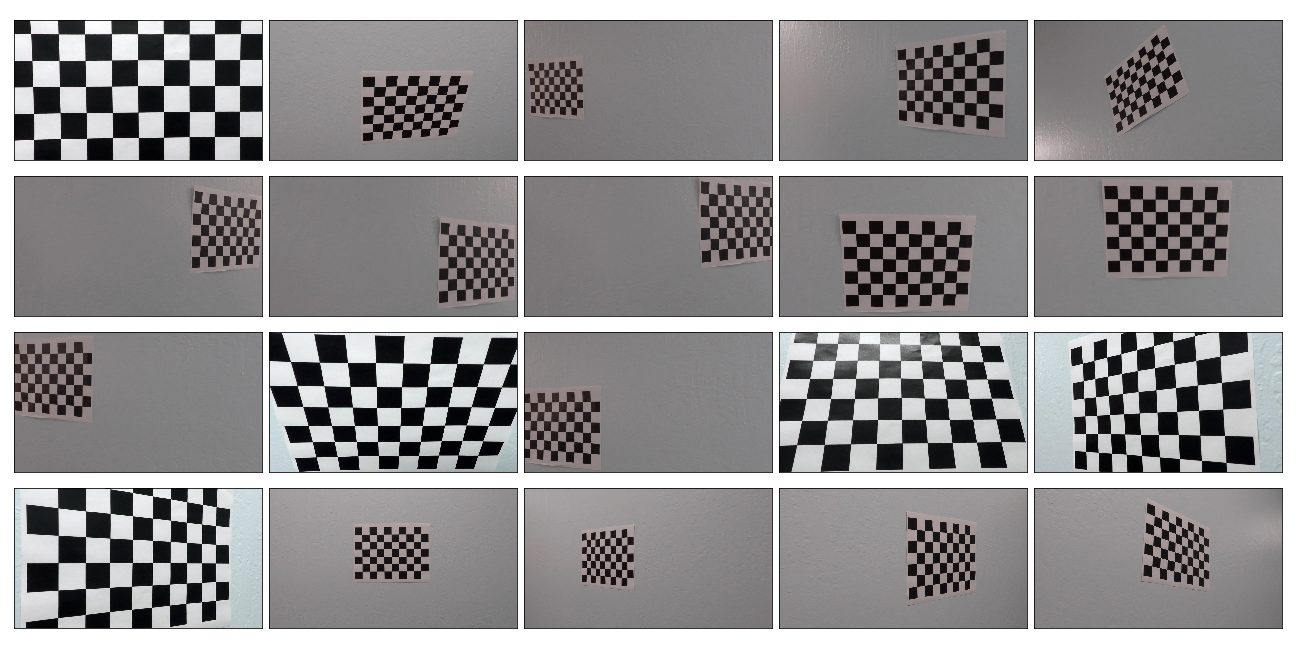
The objpoints and imgpoints are then used to compute the camera calibration matrix and distortion coefficients using the cv2.calibrateCamera() function. Then cv2.undistort() functin was used for distortion correction on same chessboard images. The undistort_img() function serves the purpose of applying cv2.calibrateCamera() and cv2.undistort() to the input image. Below is a grid showing all the undistorted chessboard images.
Undistorted Chessboard Images
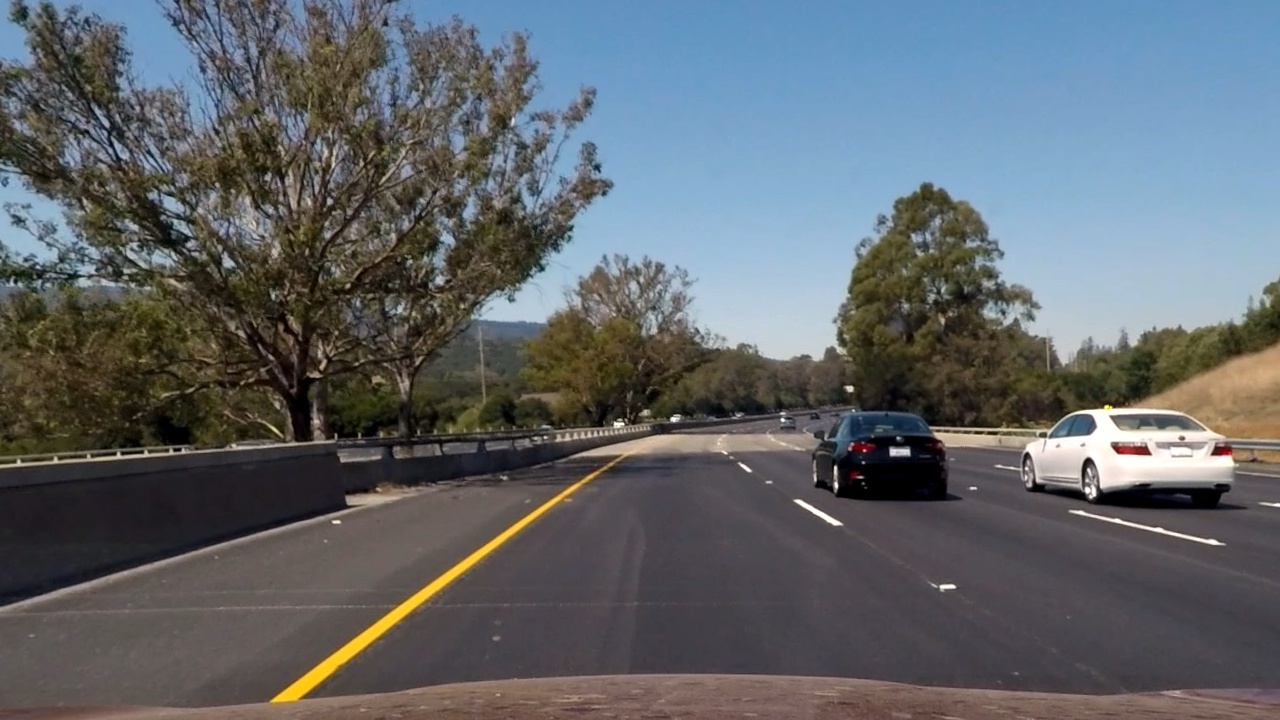
As explained above, the functions draw_corners() and undistort_img() serves as a mean for camera calibration and distortion correction. Below is a sample image saved after applying distortion correction to it for the purposes of demonstration.
Undistorted Lane Image
2. Describe how (and identify where in your code) you used color transforms, gradients or other methods to create a thresholded binary image. Provide an example of a binary image result.
This was a non-trivial part of work for me as I do not belong from Computer Science background and there was an extensive learning for me about Computer Vision for the implementation of color transforms and gradients based line detection. In 3rd cell of Ipython notebook, I have declared various methods which made my work easier to create a binary image.
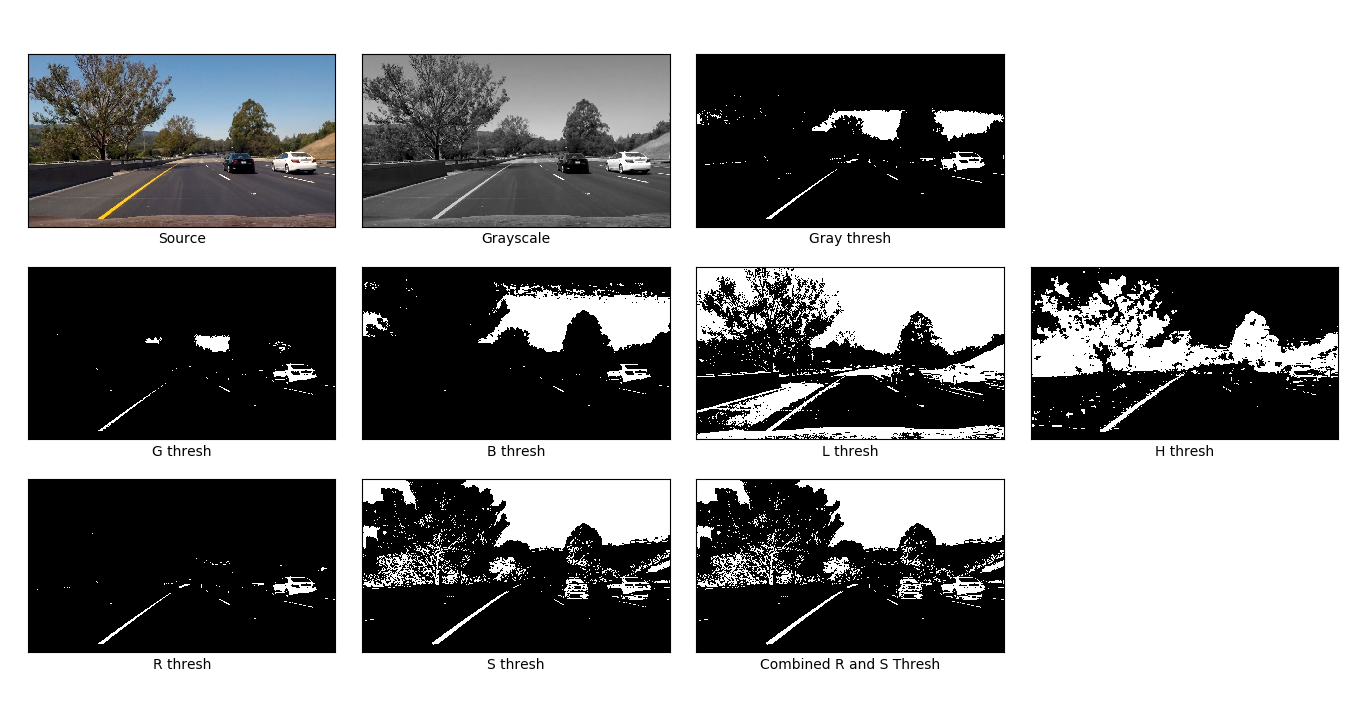
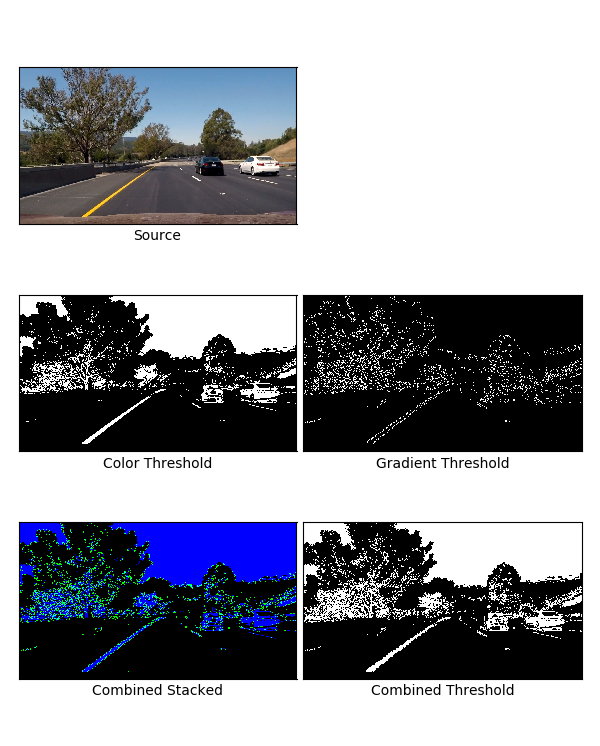
Color Thresholding: First of all, I defined a very simple method thresh() which can be used to apply color threshold in any color space. Then I defined colorthresh() function which takes the R channel component of image from RGB color space and S channel component from HLS space. As per the classroom modules for P4, the lines were detected efficiently in R channel as well as S channel so I chose to combine the pixels detected in both of this channels' thresholds by applying a logical OR operation.
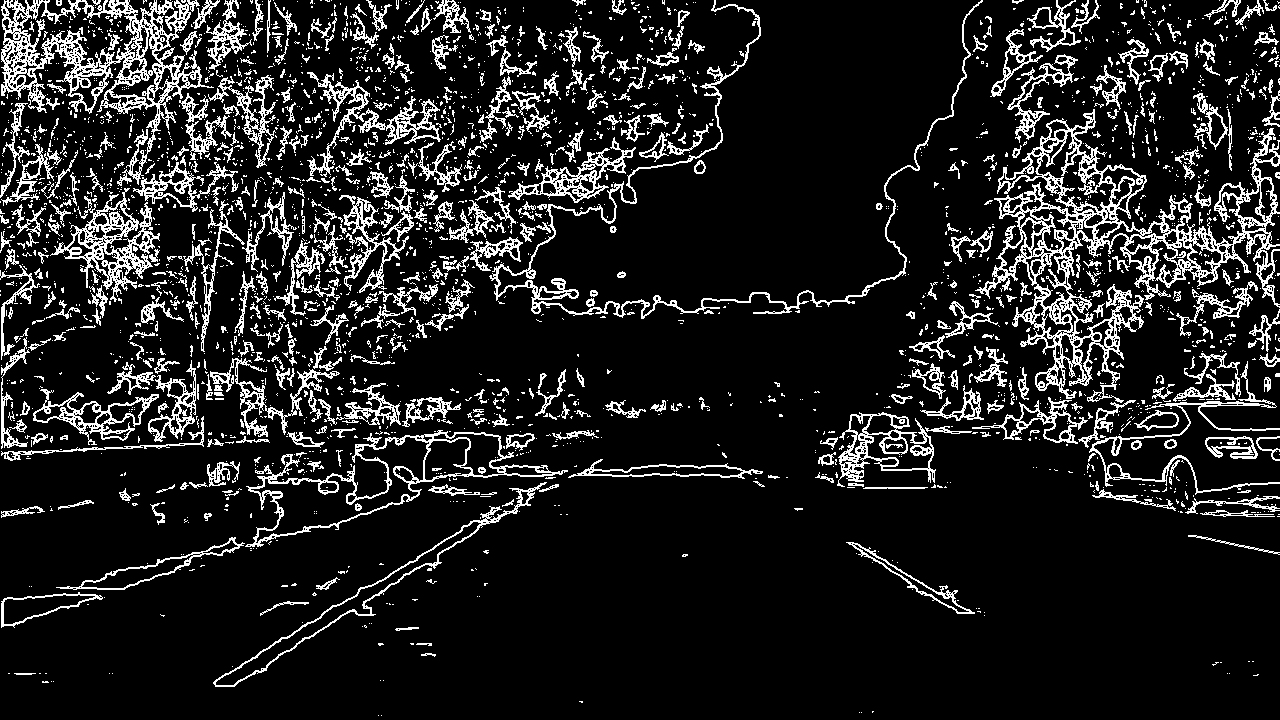
Gradient Thresholding: The binary file received as output of color thresholding was then used as an input to Gradient Thresholding method gradthresh(). This method in turns calls different Gradient based thresholding methods which computes gradients along X dimension, Y dimension, Magnitude gradient and Direction Gradient. As you can see in gradthresh() method, I tried various combinations of gradient thresholding techniques as trial and error to reach the final combination which I used: (Sobelx OR Mag_Gradient) AND (Sobely OR Mag_Gradient). I excluded the direction gradient in my final code base as it was not making any significant improvement in detecting lane lines. The various threshold values, kernal size, etc. used in the project were somewhat taken from classroom videos plus trial and error.
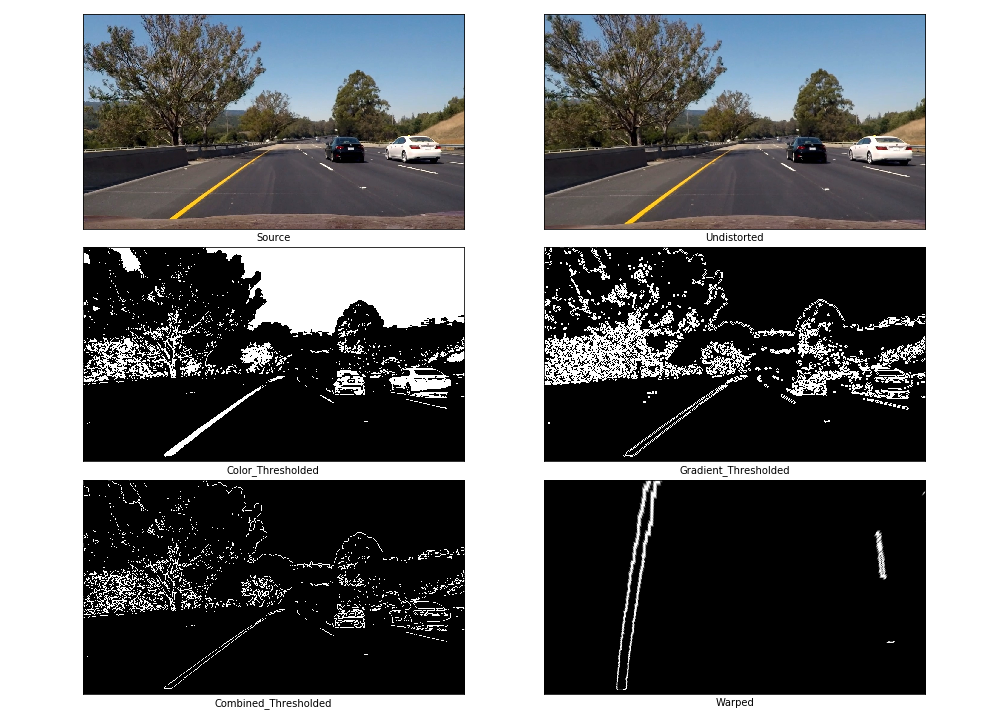
In the below section, I have provided output images of various thresholding operations. The images are self-explanatory due to labels provided in them.
Color Threshold Grid
Color and Gradient Threshold Grid
Sample Thresholded Binary
3. Describe how (and identify where in your code) you performed a perspective transform and provide an example of a transformed image.
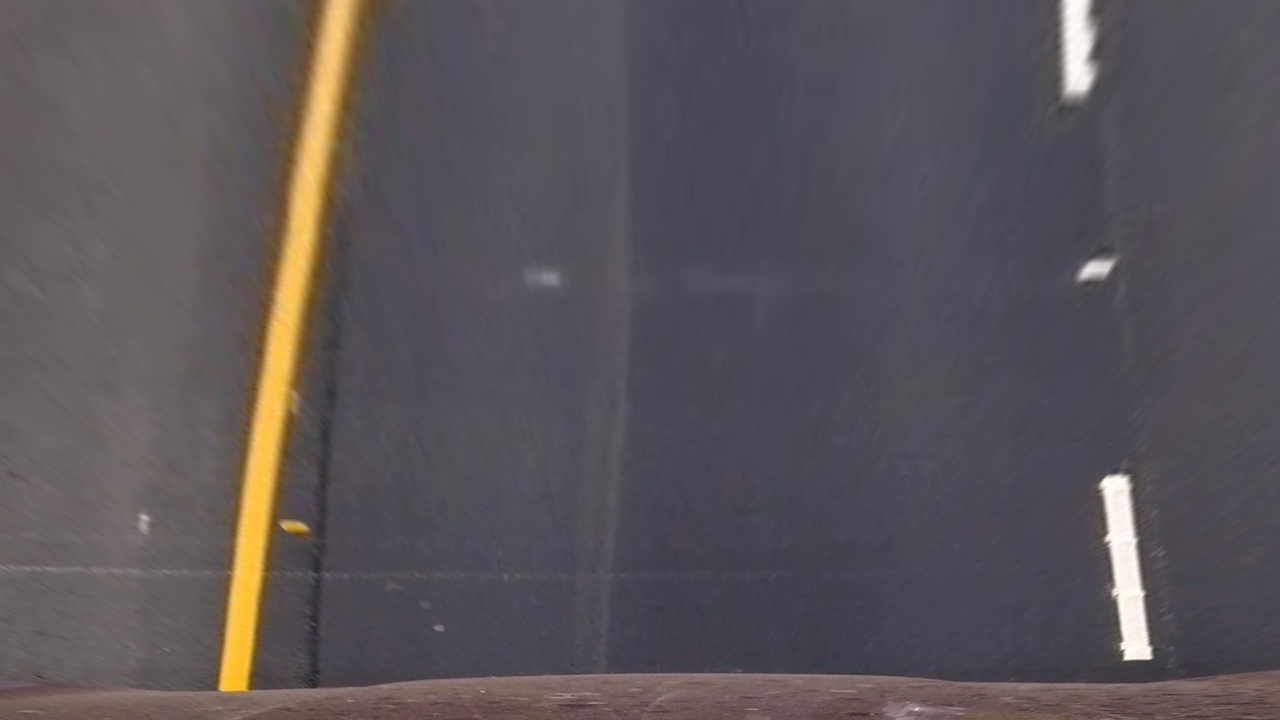
In the 3rd Cell of Ipython notebook, the function warp() is declared which gives Perspective Transform matrix and Inverse Perspective Transform matrix by using source and destination points. The source and destination points were chosen by eyeballing the image in Python interactive window and moving cursor to various points. The function warp() not only returns the warped, but it also returns the matrices M and Minv so that these matrices can be used directly for inverse perspective transform at the end of pipeline. I later realized that I could use a flag in warp() function so that it supports perspective transform using M as well as Minv but then I chose to not modify it giving consideration to time. Below is the warped image of the road after applying warp() function to the source image.
Sample Warped Image - Bird's Eye View
Processed Image Grid
4. Describe how (and identify where in your code) you identified lane-line pixels and fit their positions with a polynomial?
The real business of finding Lane Lines starts in the 4th cell of Jupyter notebook. Three methods find_lane(), calculate_curvature_offset() and draw_lane() are defined in this particular cell of notebook and this cell does the real leg work for detecting and plotting Lane Lines.
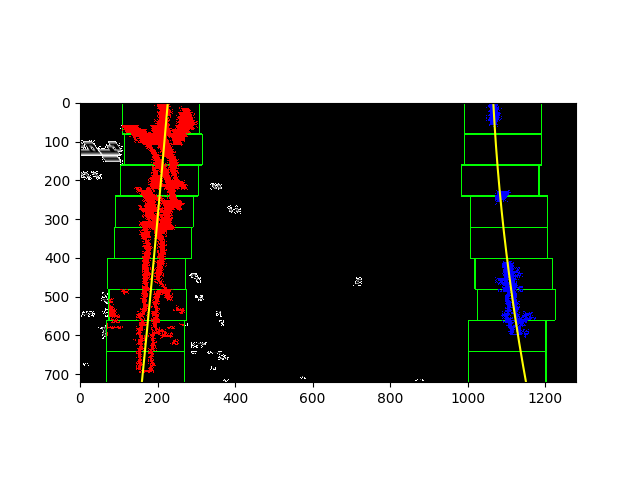
find_lane(): This function takes a pre-processed binary warped image of the road. I used the histogram and sliding window approach for Lane Detection instead of Convolutional approach. As explained in the video lectures, I computed the histogram on the lower half of binary warped image as a starting point. Based on the determined peaks of the histogram and calculation of midpoint of the image, left and right base pixels were determined. The number of windows were provided as a variable which can be altered if needed. However, I used the same value of 9 for sliding window. The window height was computed by dividing the total image height with number of sliding windows. Then nonzero pixels in x as well as y dimension were identified and stored in corresponding array variables. The margin and minpix variables were defined which can be altered to increase / decrease the accuracy of whether to consider the given pixel as part of lane line or not.
Then after, a for loop iterates for each window such that the window slides from bottom of the image to the top of the image. For each iteration, the Window boundaries were identified and highlighted with rectangle box around them on left as well as right side lane line. Then the nonzero pixels within the window were identified and stored for future processing.
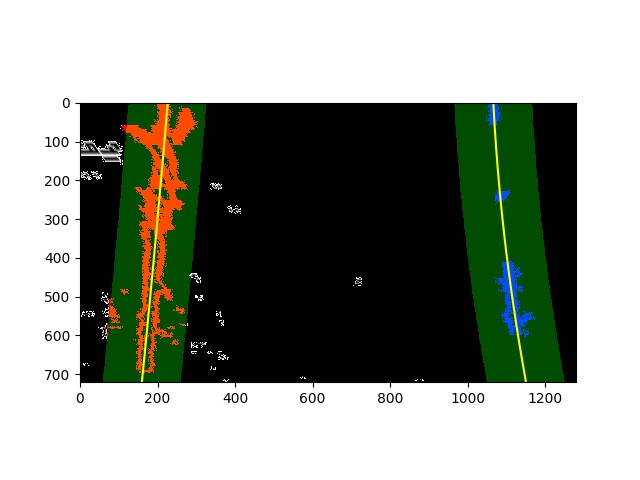
After completion of window iterations, the lane indices were been retrived from overall non-zero pixels so that the indices constitute only of the part of Lane Lines and rest of the pixel information can be ignored. np.polyfit was then used to plot a line of 2nd degree polynomial through Lane Indices for left as well as right lane. The computed lane line data was then returned from the function so that it can be used for next step.
Lane Detection using window search
Polynomial plotting of Lane
5. Describe how (and identify where in your code) you calculated the radius of curvature of the lane and the position of the vehicle with respect to center.
In the same code cell 4th of notebook, the method calculate_curvature_offset() does this calculation.
calculate_curvature_offset: Based on the calculations and formulae provided in video lectures, the curvature of the road along with the offset of vehicle from centre of the road is been computed in this method. These values are then returned by the function.
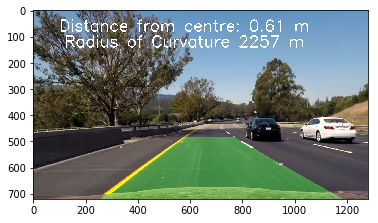
6. Provide an example image of your result plotted back down onto the road such that the lane area is identified clearly.
The 8th cell of Ipython notebook has the code to find lane lines on warped binary image and based to draw the lanes on the image and display the final output including Radius of curvature and offset of vehicle. Below is the final image output:
Lanes drawn on original image
1. Provide a link to your final video output. Your pipeline should perform reasonably well on the entire project video (wobbly lines are ok but no catastrophic failures that would cause the car to drive off the road!).
Here's a link to my video result
1. Briefly discuss any problems / issues you faced in your implementation of this project. Where will your pipeline likely fail? What could you do to make it more robust?
For the implementation of this project, I used all the computer vision techniques discussed in classroom module of P4 except Convolution method. I didn't got chance to understand and implement it due to time limitations but I would like to explore that method as well and compare the differences between both the approaches as a future scope of this project. Other than this, I believe that the pipeline is working fine because of the available day light but in darkness at night or similar whether conditions, it might not be entirely feasible to detect the lane lines using the same exact pipeline with pre-defined threshold values. According to me, a more targeted approach for Lane Detection would be to tune the threshold values dynamically based on different lighting conditions. Besides I am pretty sure that this lane detection program will not be able to succeed on Indian roads (from where I belong) where there are no Lane Lines on majority of the roads and even if there are lane lines, they might be very faded. So I believe for Indian roads, the Lane should be detected based on the road's edge or some other way instead of Lane marks. As a future scope, I would like to work on computer vision techniques which can help me identify where the road to drive is irrespective of presence of Lane Lines on the roads.
