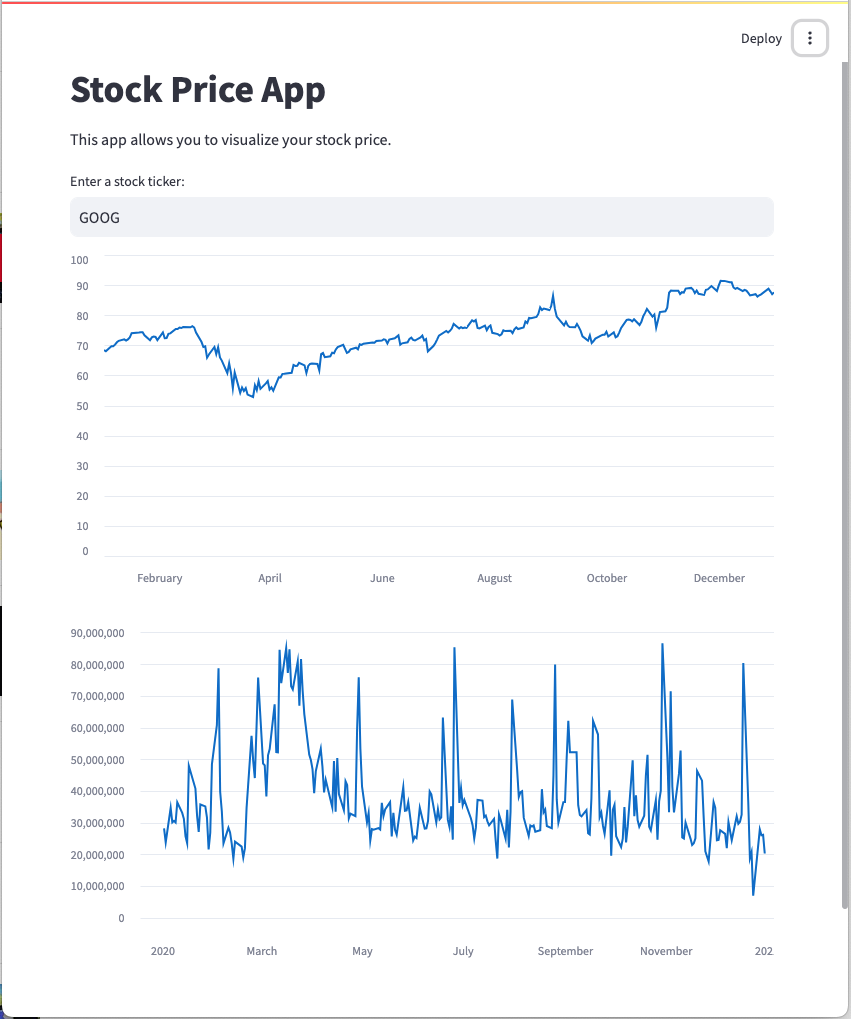
This application gets data from the Yahoo Finance project (https://pypi.org/project/yfinance/)
data = yf.download(ticker, start='2020-01-01', end='2021-01-01')
Then uses Streamlit to plot the Close and Volume subsets onto line charts:
st.line_chart(data['Close'])
st.line_chart(data['Volume'])
pip install streamlit
streamlit run streamlit_example.py
Add New Interpreter > Add Local Interpreter > [Dialog] OK
Install Packages

