This repository is intended for anyone who wants to monitor a Synology NAS using SNMP protocol and a lightweight collectd tool.
If you have any ideas on how to improve this repository, you are welcome to create an issue or pull request.
Collectd SNMP features relies on the Net-SNMP library as described here. You therefore need to have this library installed.
This is done by executing e.g. apt-get install snmp.
To use the plugin with Synology DSM you need to
download and place the DSM management information base (MIB) files.
Standard location for those files is /usr/share/snmp/mibs. The required files
are:
- SNMPv2-MIB.mib
- SNMPv2-SMI.mib
- SNMPv2-TC.mib
and all the Synology MIBs that are available to download on the link provided in this official 🔗documentation PDF.
Just clone this repository somewhere on your system and symlink the dsm-snmp.conf
file to the /etc/collectd/collectd.conf.d/ directory. You can of course move
the file to the location, but by symlinking you'll get free updates by git pull.
A note to updating
Although it is a great thing to have the "profile" always updated. It might be dangerous to blindly pull all the changes automatically. Some old collected data can be malformed by changing their definition.
In the snmp plugin configuration section add the host and specify what information you want to collect. E.g.
<Host "synology.example.com">
	Address "192.168.1.2"
	Version 2
	Community "local"
	Collect "dsm.uptime"
	Collect "dsm.services"
	...
</Host>
Other configuration options for this section are described in collectd-snmp(5).
Those data sets can be specified as an parameter to the Collect key in Host config section.
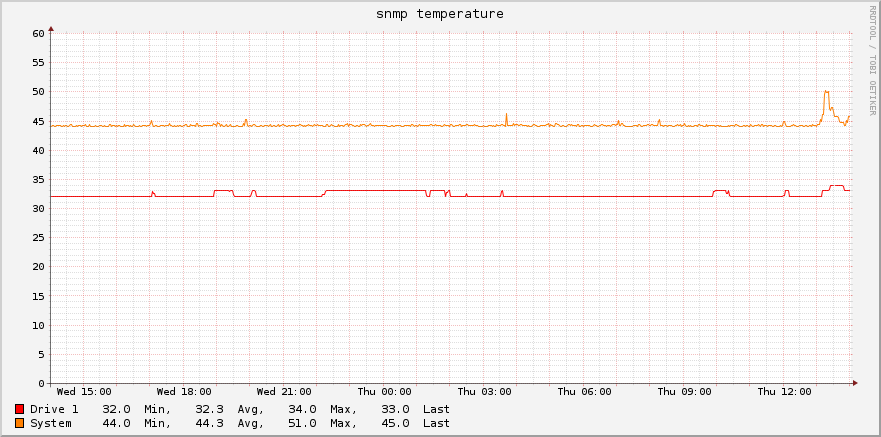
A temperature for all available disks installed in NAS.
Collect "dsm.diskTemperature"
An amout of bytes read/written to each device.
Collect "dsm.diskUtilization"
Short, mid and long term load of each disk.
Collect "dsm.diskLoad"
A number of bytes transmitted/received on each interface.
Collect "dsm.interface"
Similar to Interface traffic 🚦 but the values are in packets instead of bytes.
Collect "dsm.interfacePackets"
The number of users connected using each provided service (HTTP/S, NFS, FTP, CIFS...)
Collect "dsm.services"
Short, mid and long term load of the system. For further information on what is it the load
please see uptime(1), w(1).
Collect "dsm.systemLoad"
A temperature of the Synology NAS.
Collect "dsm.temperature"
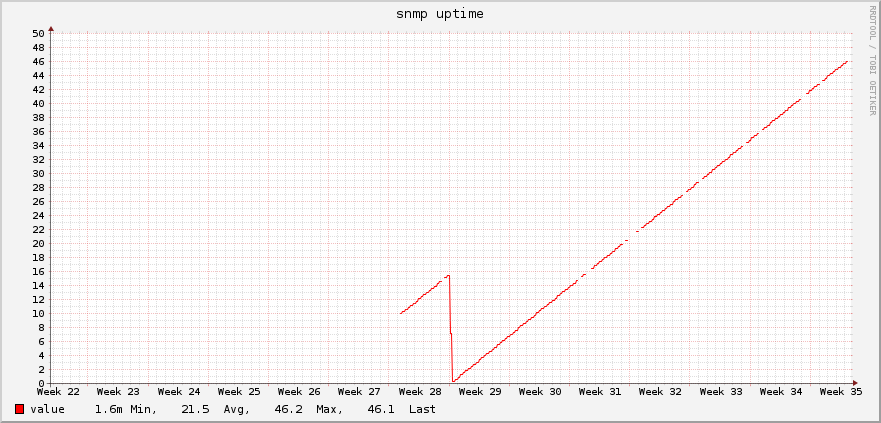
A diskstation uptime. The actual value is in days.
Collect "dsm.uptime"
The value is received in milliseconds. The conversion to days is performed by this profile by multiplying each received value by 1/(100*60*60*24)

