This is a student project
This repository is a proof of work for a Kappa architecture, which is an event based architecture to handle real-time data processing.
It uses following stack :
- Spark Streaming as the data processer,
- Kafka broker as a message broker,
- MySQL to store processed data in a data warhouse,
- Python flask to expose some API routes,
- VueJS to create the user interface and see calculated data.
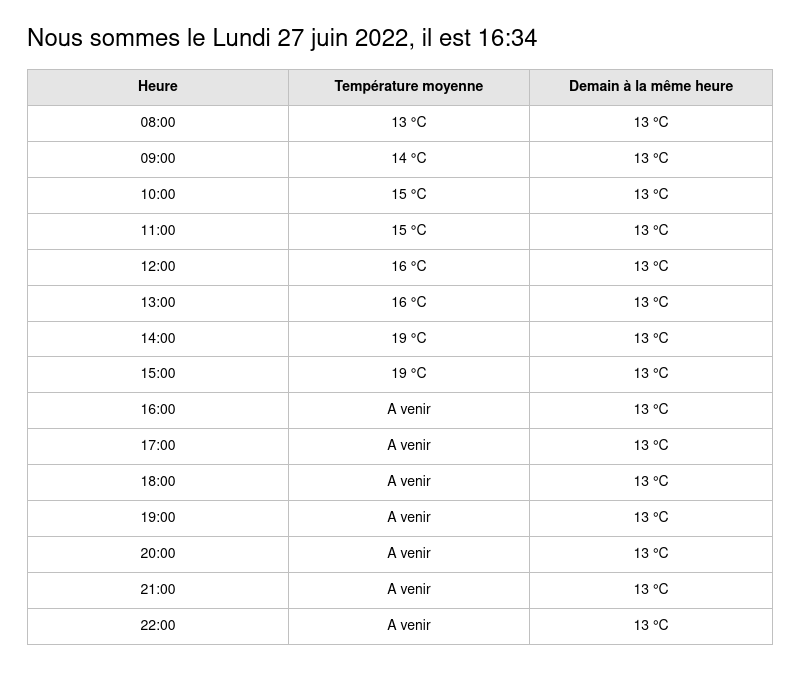
The data comes from NOAA meteorological data : https://www.ncei.noaa.gov/cdo-web/. It shows temperatures from several meteo stations scattered around the world, hour by hour.
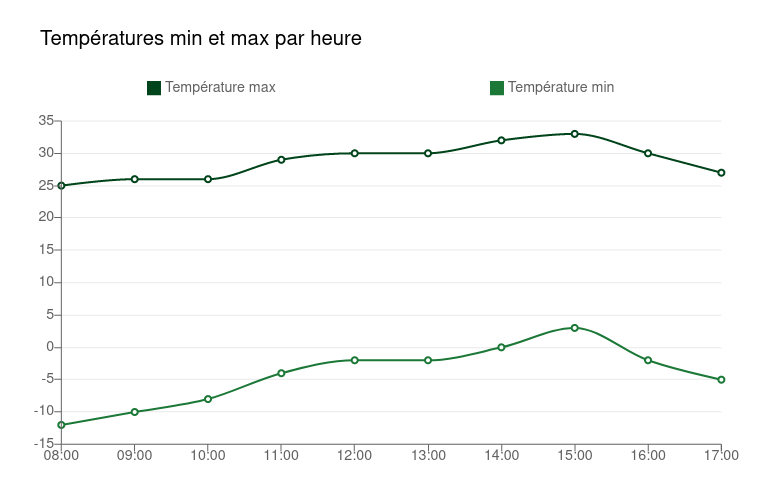
A data feed simulator sends this data in little batches every 30 seconds. Those batches are used to calculate ongoing means, max and min temperatures by jours, with Spark Streaming. The results are then stored to MySQL and showed to end users.
Cf. https://app.moqups.com/a5r0wjvSgi4Xyx94Z7zfuXo2I4Oefjr4/edit/page/ad64222d5
Speed layer : Kappa
flowchart LR
    kafka_broker[[Kafka Broker]]
    kafka_producer[\Kafka Producer/]
    spark_streaming_ml[/Spark Streaming\]
    spark_streaming_stats[/Spark Streaming\]
    moaa_website[MOAA website]
    feed[Data feed simulator]
    unix_socket[Unix socket]
    compute_means{Stats job}
    model{{Spark ML Model}}
    predict{Predict job}
    mysql[(MySQL)]
    insert_mysql{Insert job}

    subgraph feed_step
    moaa_website -- First download --> feed
    feed -- Every 30s --> unix_socket
    kafka_producer --> unix_socket
    end

    %% kafka_producer -- New data --> kafka_broker

    subgraph broker_node
    kafka_broker
    end

    subgraph stats_step
    spark_streaming_stats --> compute_means
    end

    %% kafka_broker --> spark_streaming_stats
    %% kafka_broker --> spark_streaming_ml
    %% compute_means --> kafka_broker
    %% predict --> kafka_broker

    subgraph ml_step
    model o--o spark_streaming_ml
    spark_streaming_ml --> predict
    end

    subgraph mysql_step
    insert_mysql --> mysql
    end

    broker_node --> mysql_step
    feed_step --> broker_node
    broker_node <--> stats_step
    broker_node <--> ml_step
Essentially, the streaming pipeline is as following :
- => Download Data from MOAA API
- => Push data to socket
- => Listen to socket and push data back to Kafka
- => Consume message and do calculation (spark streaming)
- => Push calculation results back to Kafka
- => Consume message and insert in MySQL
Spark Streaming:
- calculates temperatures by hour (min/max + mean), and store it to MySQL
- (TODO) predicts temperatures by hour for next day, and store it to MySQL
Kakfa broker:
- must keep all data it receives for 7 days
More details on the stats and mysql steps :
flowchart
    raw_topic[Topic for raw data from stations]
    agg_topic[Topic for aggregated results]
    spark_streaming_1[/Spark Streaming Process 1\]
    compute_means{Means job}
    mysql_consummer[/Mysql consumer\]
    insert_mysql{Insert job}
    mysql_db[(MySQL)]

    subgraph broker_node[Kafka Broker]
    raw_topic
    agg_topic
    end

    raw_topic -- Microbatch 5s --> spark_streaming_1
    -- Publish results --> agg_topic
    spark_streaming_1 o--o compute_means

    agg_topic -- Consume --> mysql_consummer --> mysql_db
    mysql_consummer o--o insert_mysql
TODO
Spark Streaming handle input of data, and pass it to a Spark ML model to get predictive results.
If possible, a Spark ML model is trained upon each interations, when new data comes. If not, leave it for batch layer.
First, you need to open unix socket :
py -m app.speed_layer.feed.server_socketThen, you need to launch a feed simulator. This is a process that will simulate a streaming of data, in order to process it later with Spark Streaming :
py -m app.speed_layer.feed.client_socket_v2The script first dowload the data from MOAA API, then feed it to the data pipeline
Don't forget to choose how many stations you want to process:
# app/speed_layer/feed/client_socket_v2.py
def download_today_data():
    number_of_statoins = 100  # how many stations you want to retrieve
Then, you need to launch Spark Streaming process, in order to process all that data, i.e. calculate means, max/min, etc. :
py -m app.speed_layer.stats_step.spark_streaming_consumerPlease remember that the folder
app/speed_layer/stats_step/checkpoint/contains checkpoints of previous spark streaming calculation. That means that spark streaming will reuse the former calculation before doing new ones. If you cant to avoid this, i.e. start from scratch, simply delete this folder, and spark will create a new one.
Finally, to save the results in MySQL DB, you need to launch yet another process :
py -m app.speed_layer.insert_step.tmp_hourlyThe agregated values that we are going to calcultate are :
- min / max TMP of the current hour
- mean TMP of the current hour
On top of the speed layer, there is a batch layer that will calculate and show the same values (mean, max, min) but for the whole period of time, i.e. for the X last years, depending on how many years of data you choose to download.
Theses stats are shown in a separate tab view
First, you need to download the data from MOAA website :
python -m app.batch_layer.download_csvThen, you need to import that data into Hadoop :
# From webappbackend container
python -m app.batch_layer.hdfs_client
Then, you need to calculate all the intermediate values with Spark :
py -m app.batch_layer.agregatsThose results are inserted in MySQL, and showed in frontend.

