This application gives software architects and developers an example how a microservice web application can look like and it simulates a development cluster, which contains continuous integration infrastructure as well as all necessary nodes that are needed to run an online shop. Thus it will furthermore shown, how a distributed online shop can deployed with a multi deployment pipeline and how the distributed system can be monitored. The application is based on the following two online shop applications, which can be found on Github:
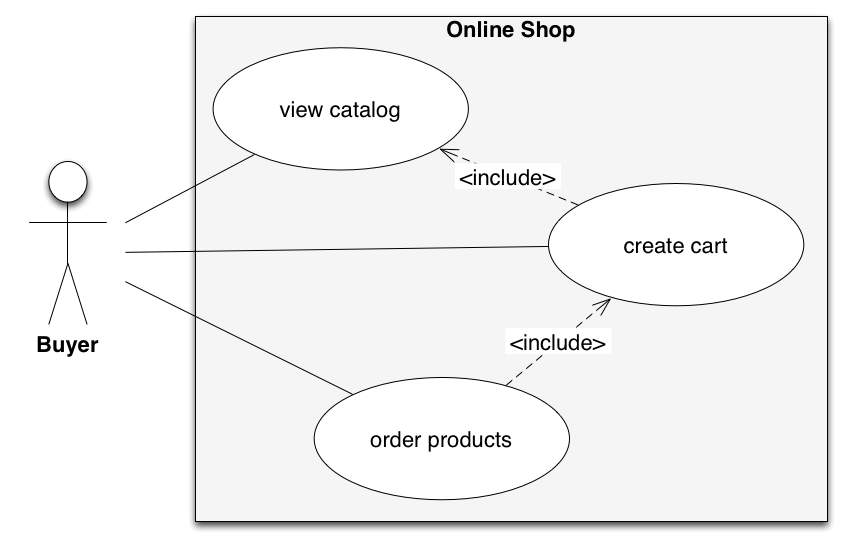
Both project was combined to an new online shop that is indeed to sell mobile devices and implements the following use cases. An user is able to:
- see different kinds of mobile devices catalogs (e.g. mobiles or tablets),
- create a cart,
- and order the created cart.
This use cases are implemented in the following two ways:
- A Monolitic Webshop, which is represented by a three layered online shop based on Apache Wicket, the Spring Framework and Spring Data that implements all given use cases,
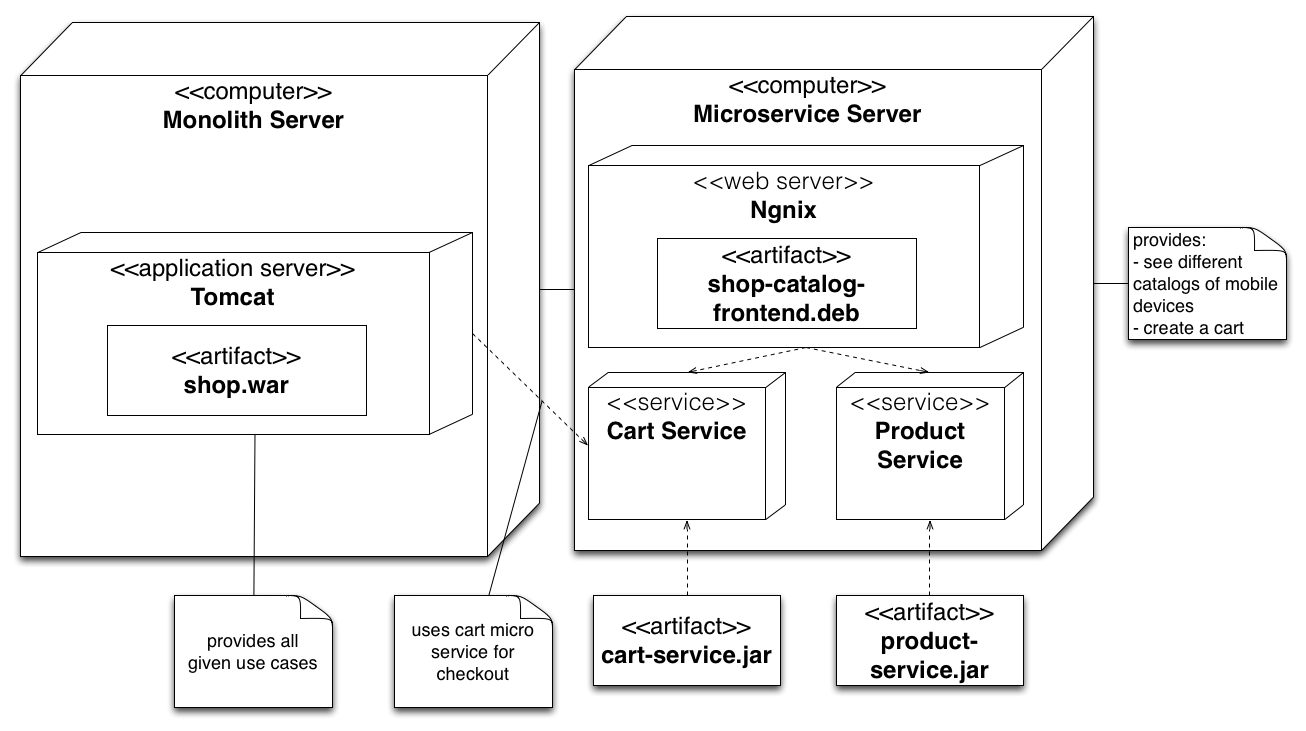
- and microservice architecture, which is based on a mix of the Monolitic Webshop and a Microservice Catalog Frontend as it is shown in the below deployment diagram. In this mix a so called Microservice Catalog Frontend provides the use case that an user should be able to see the different mobile. Finally the Monolitic Webshop is used by the user to create an order that means Monolitic Webshop represents a microservice on its own for this specific use case. The Microservice Catalog Frontend is based on an AngularJS and Typescript which access different kinds of REST-Services that are implemented in Scala, Spray, Restx and Spring Boot.
For simplicity all services are supposed to run on a Java-VM at the moment.
- Web frontend
- Based on Angular JS and Typescript
- Cart service
- Based on Spring boot and Groovy
- Redis backend via Spring Data
- Product backend
- Based on Scala and Spray
- MongoDB backend via ReactiveMongo
- Navigation backend
- Based on Restx with embedded Jetty
- MongoDB backend via Jongo
The following directory layout shows only the important directories that are necessary to implement the given use cases in the overview.
microservice/           --> all files of the microservice applications are located in this folder
    frontend/           --> all microservice frontend applications are located in this folder
        catalog/        --> an AngularJS frontend application that shows the product catalog and is used to create a cart is located in this directory
        checkout/       --> all files that are needed to glue the checkout form of the monolithic to the microservice catalog frontend
    service/            --> all business services are located in the folder
        cart/           --> a spring boot cart rest service is located in the folder
        navigation/     --> a java based restx navigation rest service is located in the folder
        product/        --> a scala spray product rest service is located in the folder
monolithic/             --> all files of the monolithic application are located in this directory
You need some dependencies to run the application cluster or to add add own services to the showcase application.
###Running
You need at least 16 GB RAM to run the whole cluster that emulates a whole development environment like you can find it in the must professional software development projects. Furthermore you have to install the following software dependencies on your machine. If you want to run the shop applications with lower memory you has to uses Docker or Kubernetes.
The provisioning should work on other systems as well but is only tested on MacOSX 10.10. That is the reason because the whole instructions that are shown, are related to MacOSX.
- Git home (download, documentation) is a distributed revision control system.
- A good place to learn about setting up git is here
- You should install Git with Homebrew
brew install git
- Vagrant creates and configures lightweight, reproducible, and portable development environments. You do not have to
learn much about Vagrant, but you should be able to install it and execute the following commandline:
vagrant up - Vagrant (download, documentation)
- You should install Vagrant with Homebrew
brew tap caskroom/cask
brew install brew-cask
brew cask install virtualbox
brew cask install vagrant
brew cask install vagrant-manager
- Ansible (download, documentation) is a tool for automating infrastructure orchestration. You must not know Ansible, but you have to install Ansible otherwise Vagrant is not able to create the virtual machines.
- You should install Ansible with Homebrew
brew install ansible
###Boot up the cluster
The only thing you have to do to run the whole microservice cluster is to execute the following commands:
git clone git@github.com:zutherb/AppStash.git appstash
cd appstash/vagrant
vagrant plugin install vagrant-cachier
vagrant plugin install vagrant-hostsupdater
vagrant up
Vagrant will provision each node in the cluster with all the necessary components (e.g. Monitoring, Build, Database, Debian repository and Application Server). The initial setup can take a few minutes.
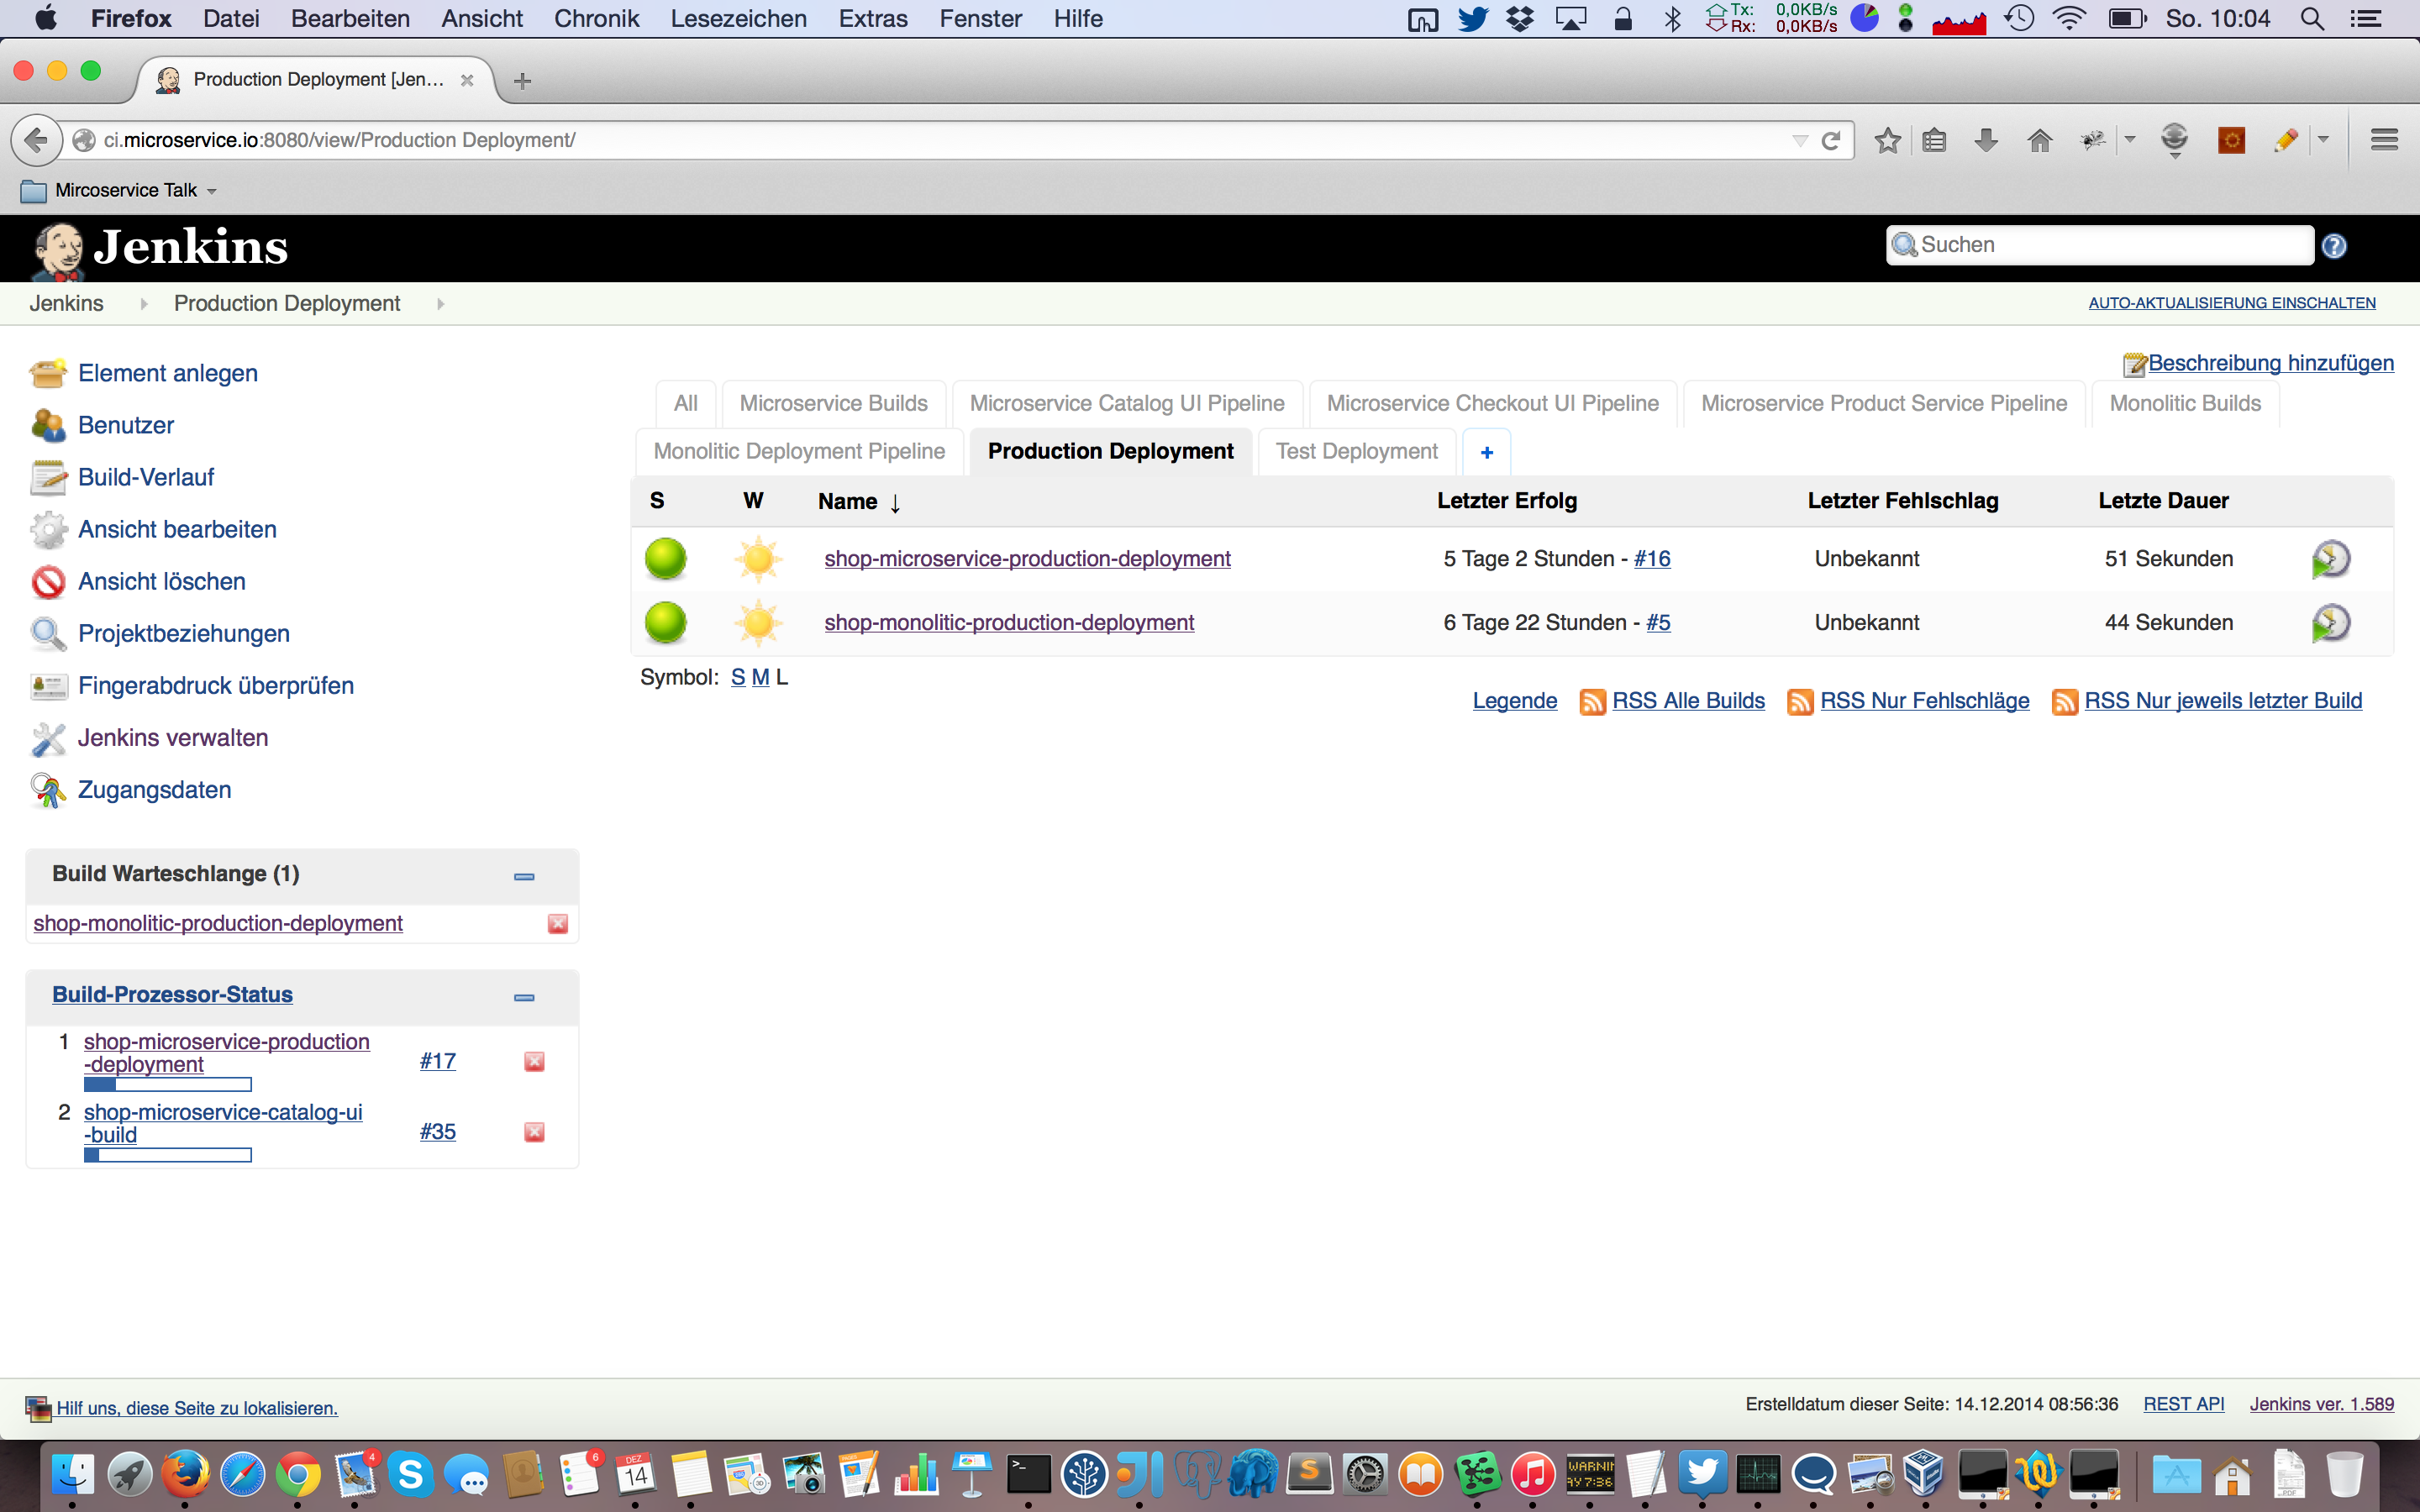
You have to execute the Production Deployment Builds on the Jenkins CI Server after you have boot up the cluster. Otherwise you can not use the production urls that are given in the next section. Therefore you have to execute the following two builds:
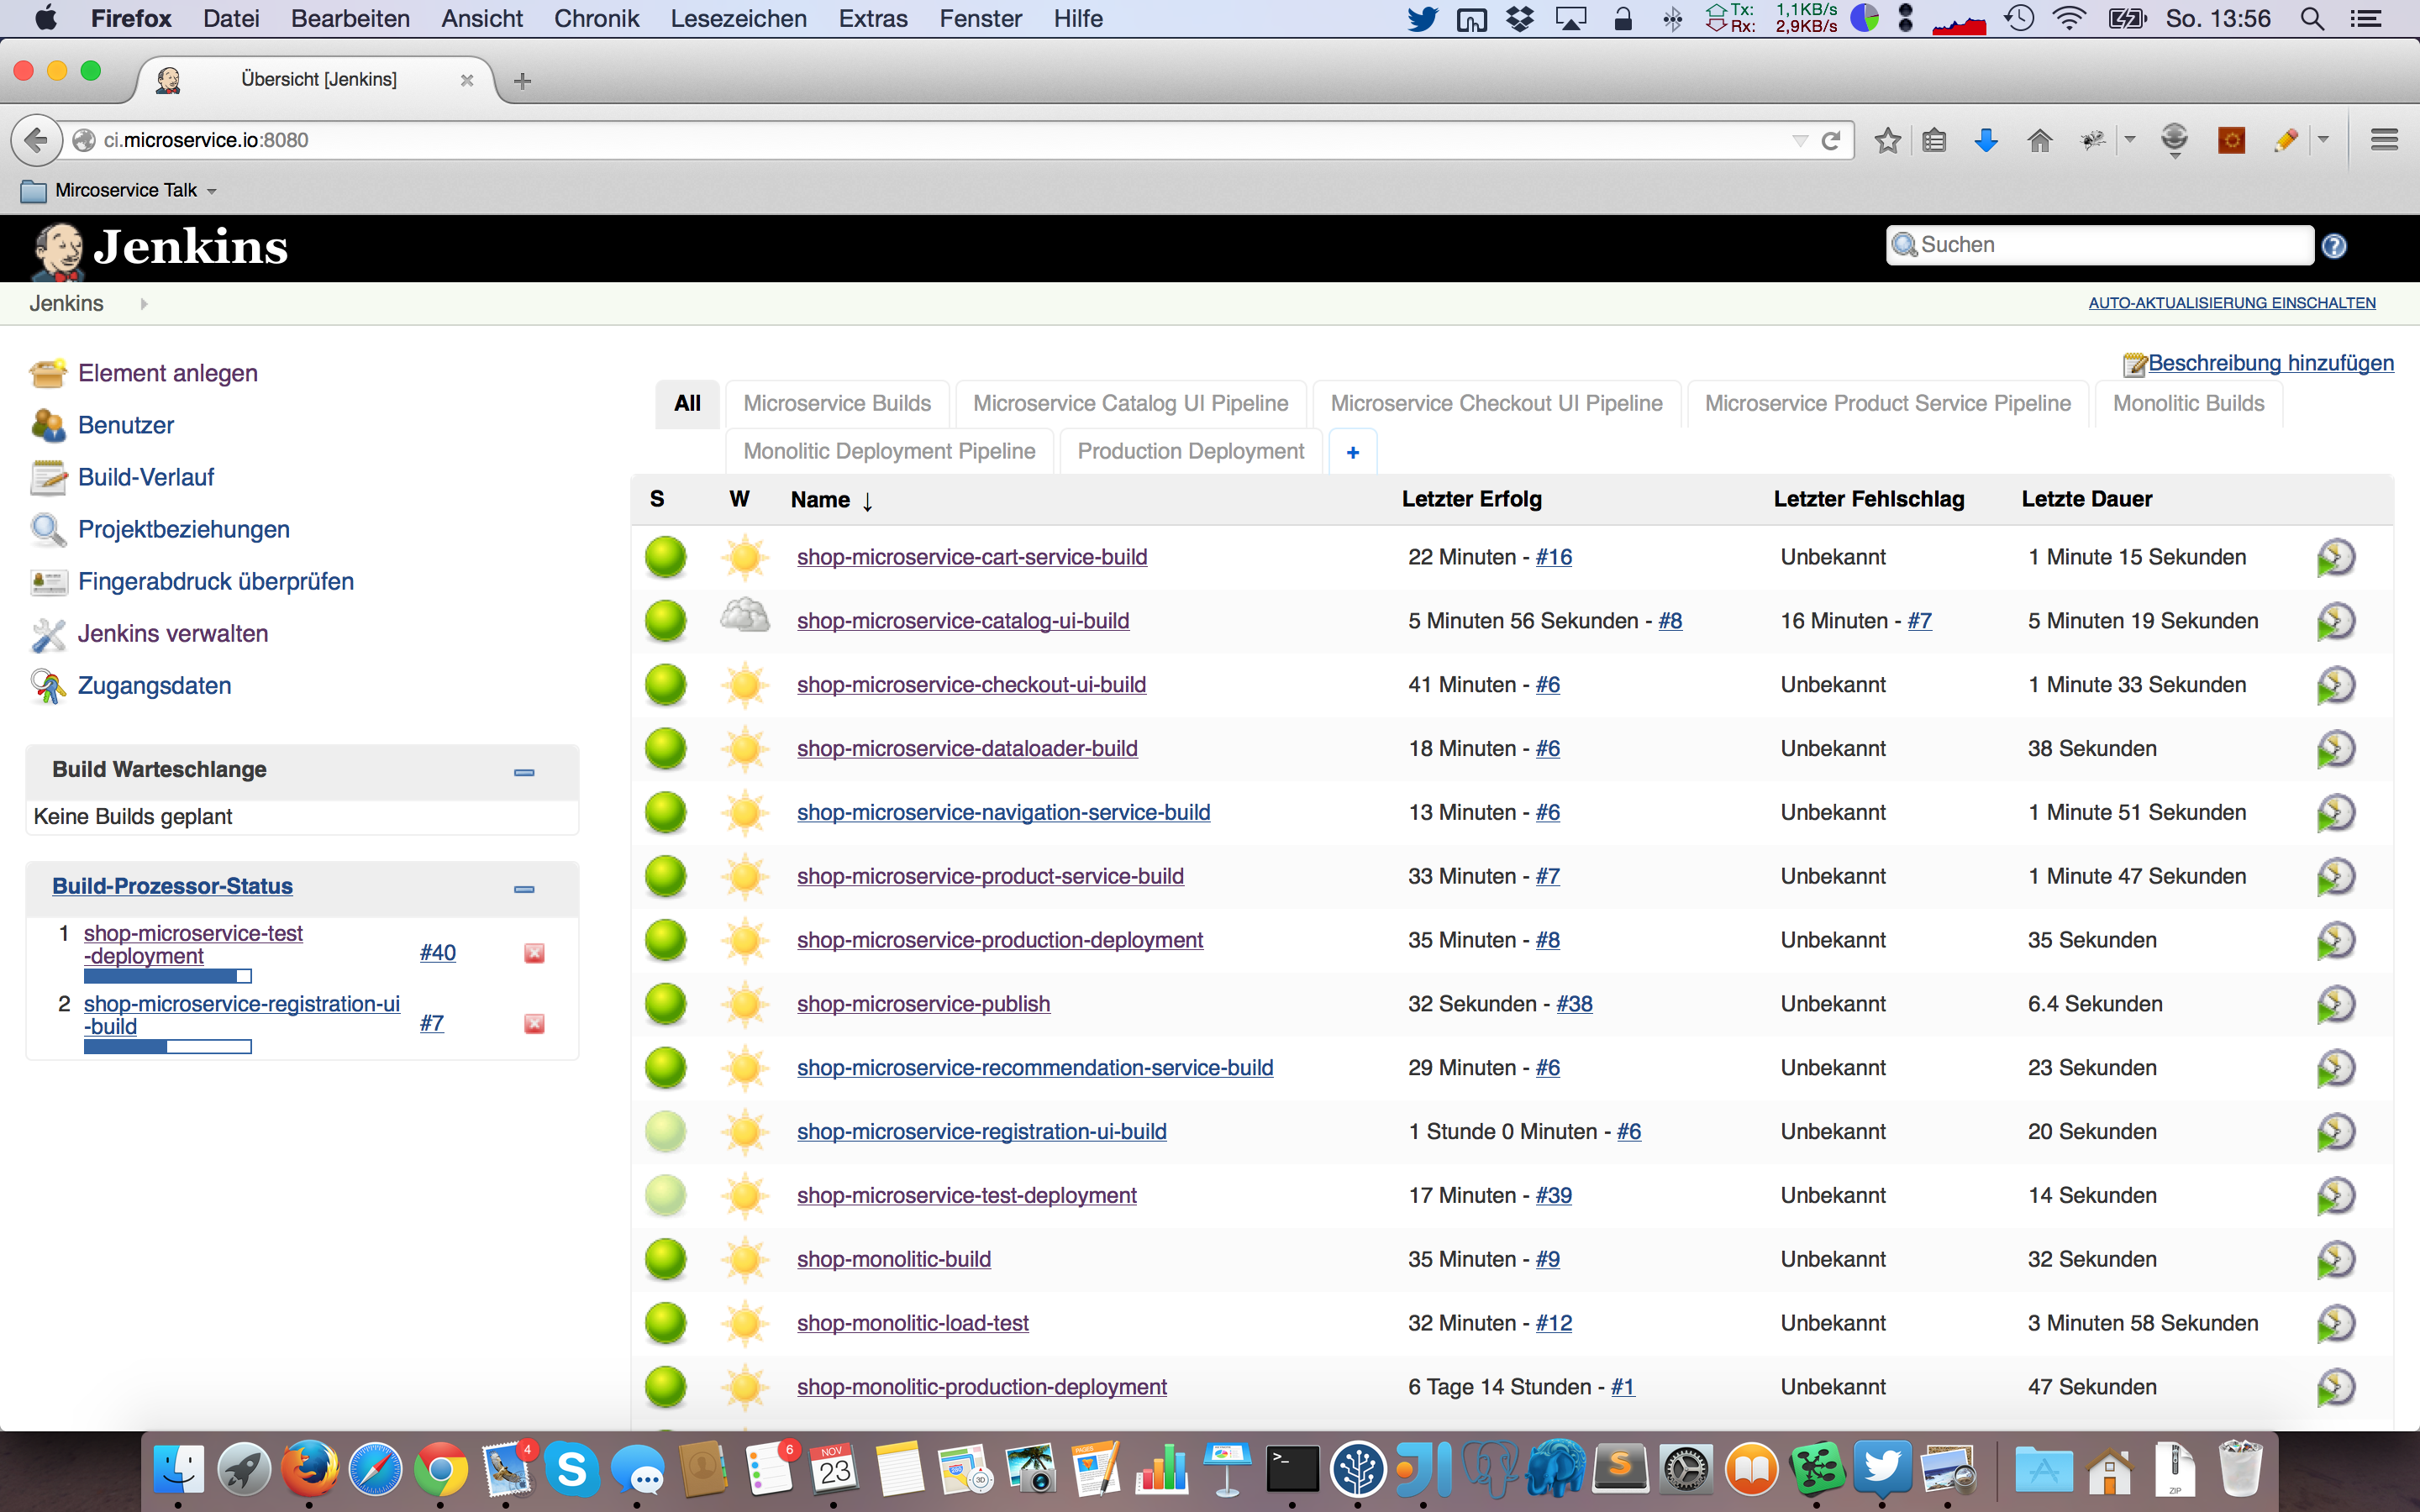
Please check if all builds are green sometimes the catalog ui build fails and must be re run untill it is green.
After you have complete this, the cluster is fully installed and you can start to work with it.
The Cluster contains of the following nodes:
| Vargrant-Name | IP | Hostname | Application | Forward |
|---|---|---|---|---|
| buildserver | 10.211.55.200 | ci-node | Jenkins | http://ci.microservice.io:8080/ |
| reposerver | 10.211.55.201 | ci-repo | Artifact Repository (NGINX) | |
| dbserver | 10.211.55.202 | mongodb-node | MongoDB | localhost:27017 |
| dbserver | 10.211.55.202 | redis-node | Redis | localhost:6379 |
| appserver1 | 10.211.55.101 | app-server-node-1 | Legacy Shop | http://test.monolith.io:8080/shop/ |
| appserver1 | 10.211.55.101 | app-server-node-1 | Probe | http://test.monolith.io:8080/probe/ (admin / topsecret) |
| appserver2 | 10.211.55.102 | app-server-node-2 | Legacy Shop | http://shop.monolith.io:8080/shop/ |
| appserver2 | 10.211.55.102 | app-server-node-2 | Probe | http://shop.monolith.io:8080/probe/ (admin / topsecret) |
| appserver3 | 10.211.55.103 | app-server-node-3 | Microservice Shop | http://test-shop.microservice.io/ |
| appserver3 | 10.211.55.104 | app-server-node-4 | Microservice Shop | http://shop.microservice.io/ |
| elasticsearch | 10.211.55.100 | monitoring-node | Kibana | http://monitoring.microservice.io/ |
| elasticsearch | 10.211.55.100 | monitoring-node | Nagios | http://monitoring.microservice.io/nagios3/ (nagiosadmin / admin123) |
| elasticsearch | 10.211.55.100 | monitoring-node | Icinga | http://monitoring.microservice.io/icinga/ (icingaadmin / admin123) |
###CI-Node
A Jenkins build server is running on the CI-Node. Jenkins is an open source continuous integration tool written in Java that provides a continuous integration services for software development which supports diffent SCM tools. Furthermore Jenkins can execute different build scripts like Gradle as well as arbitrary shell scripts and Windows batch commands.
You can reach the jenkins that builds and deploy the monolith and microservice application under the following url http://ci.microservice.io:8080/.
###Monolith Appserver
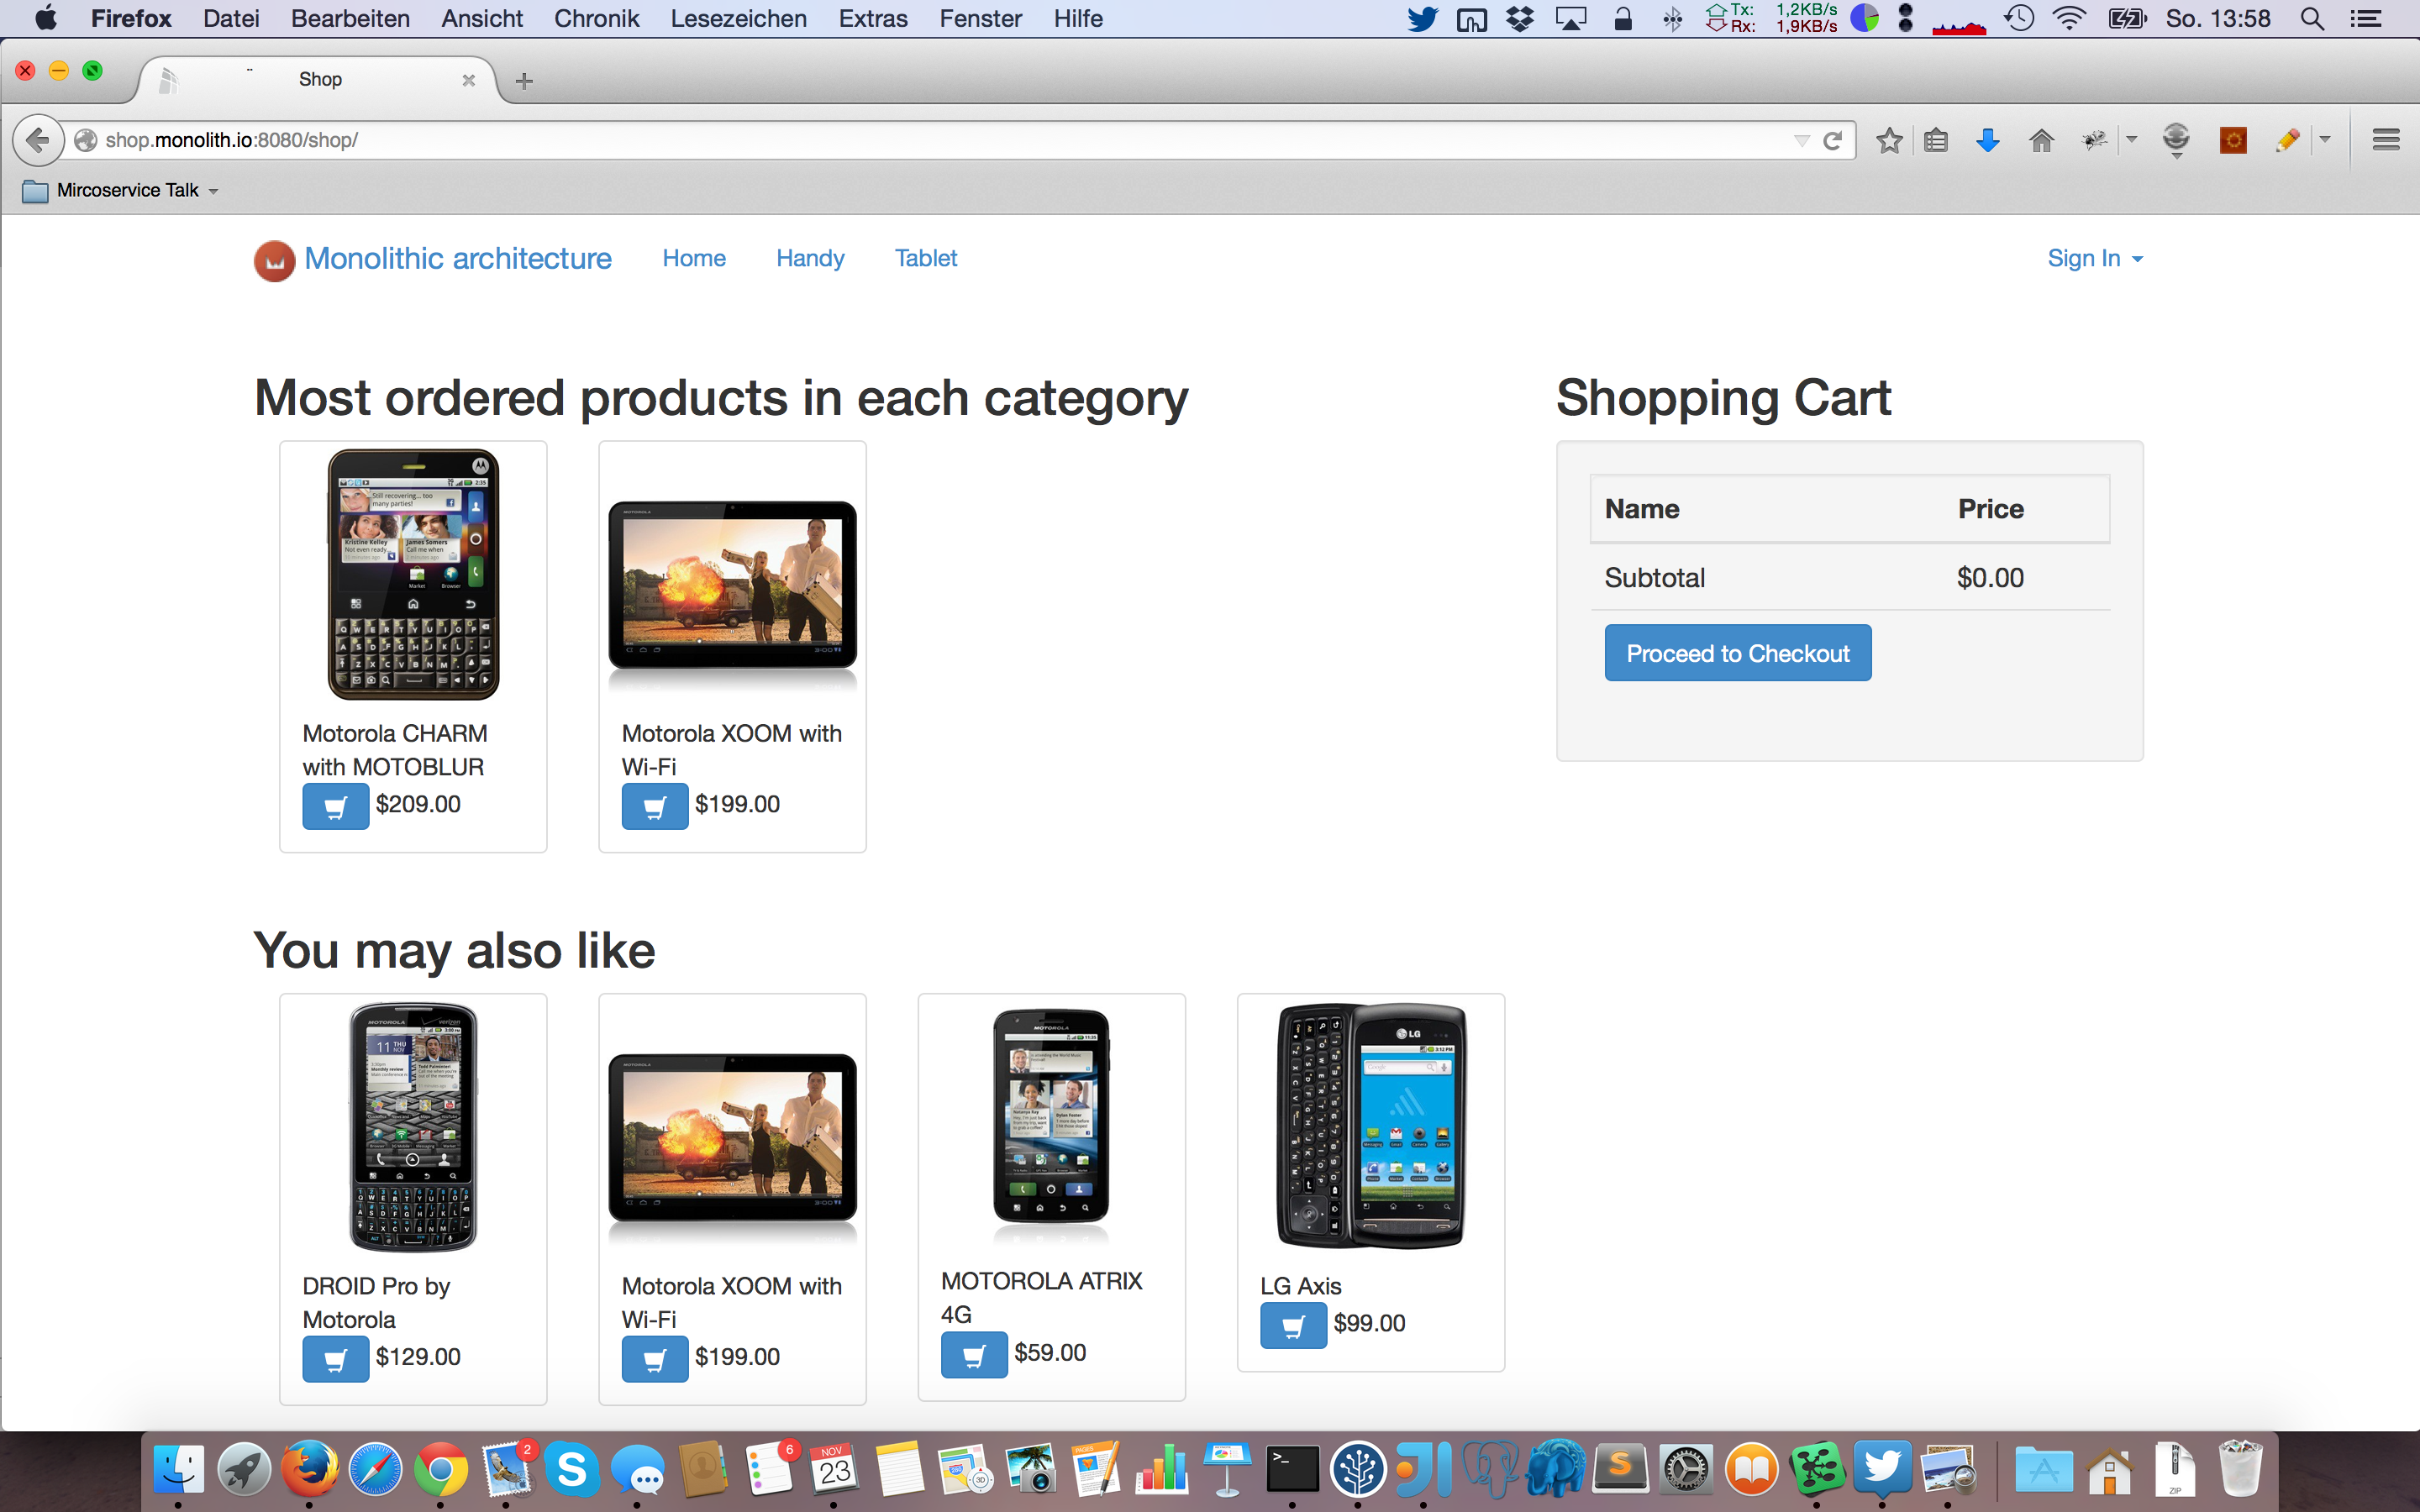
The monolith online shop is deployed on the Monolith Appserver which is a reference implementation for the given use cases in the Overview. You can reach the online shop under the following url http://shop.monolith.io:8080/shop/ .
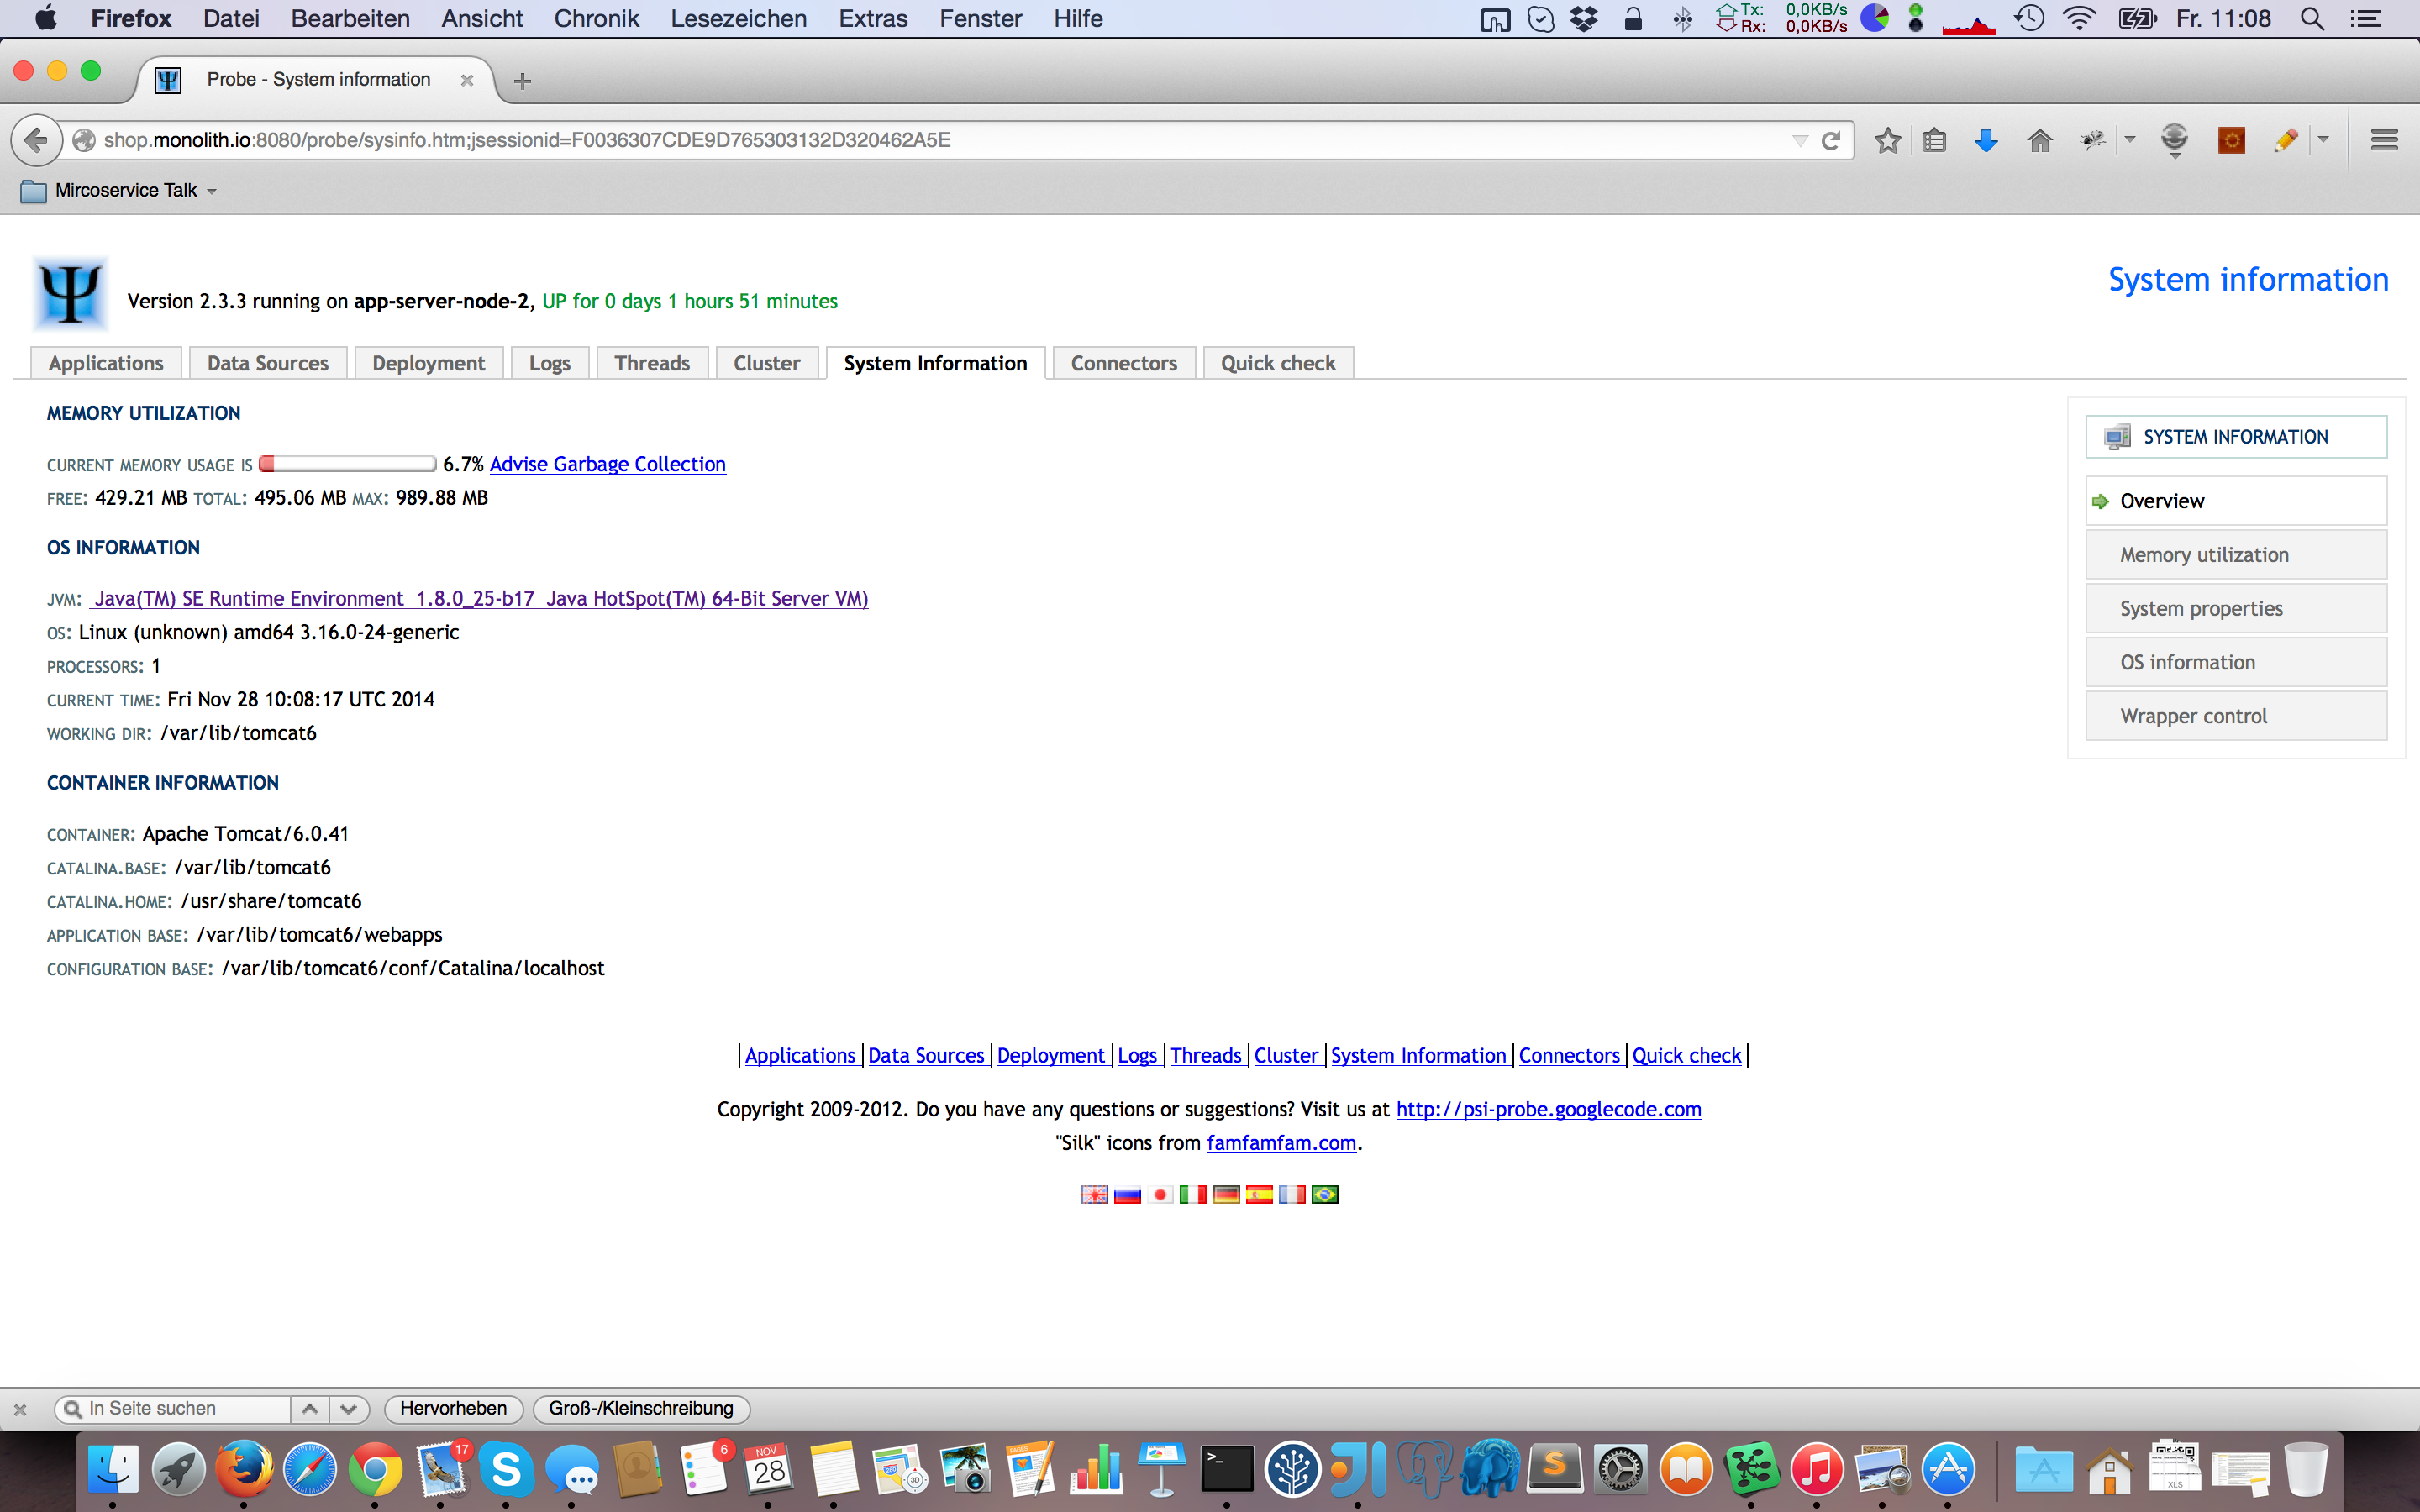
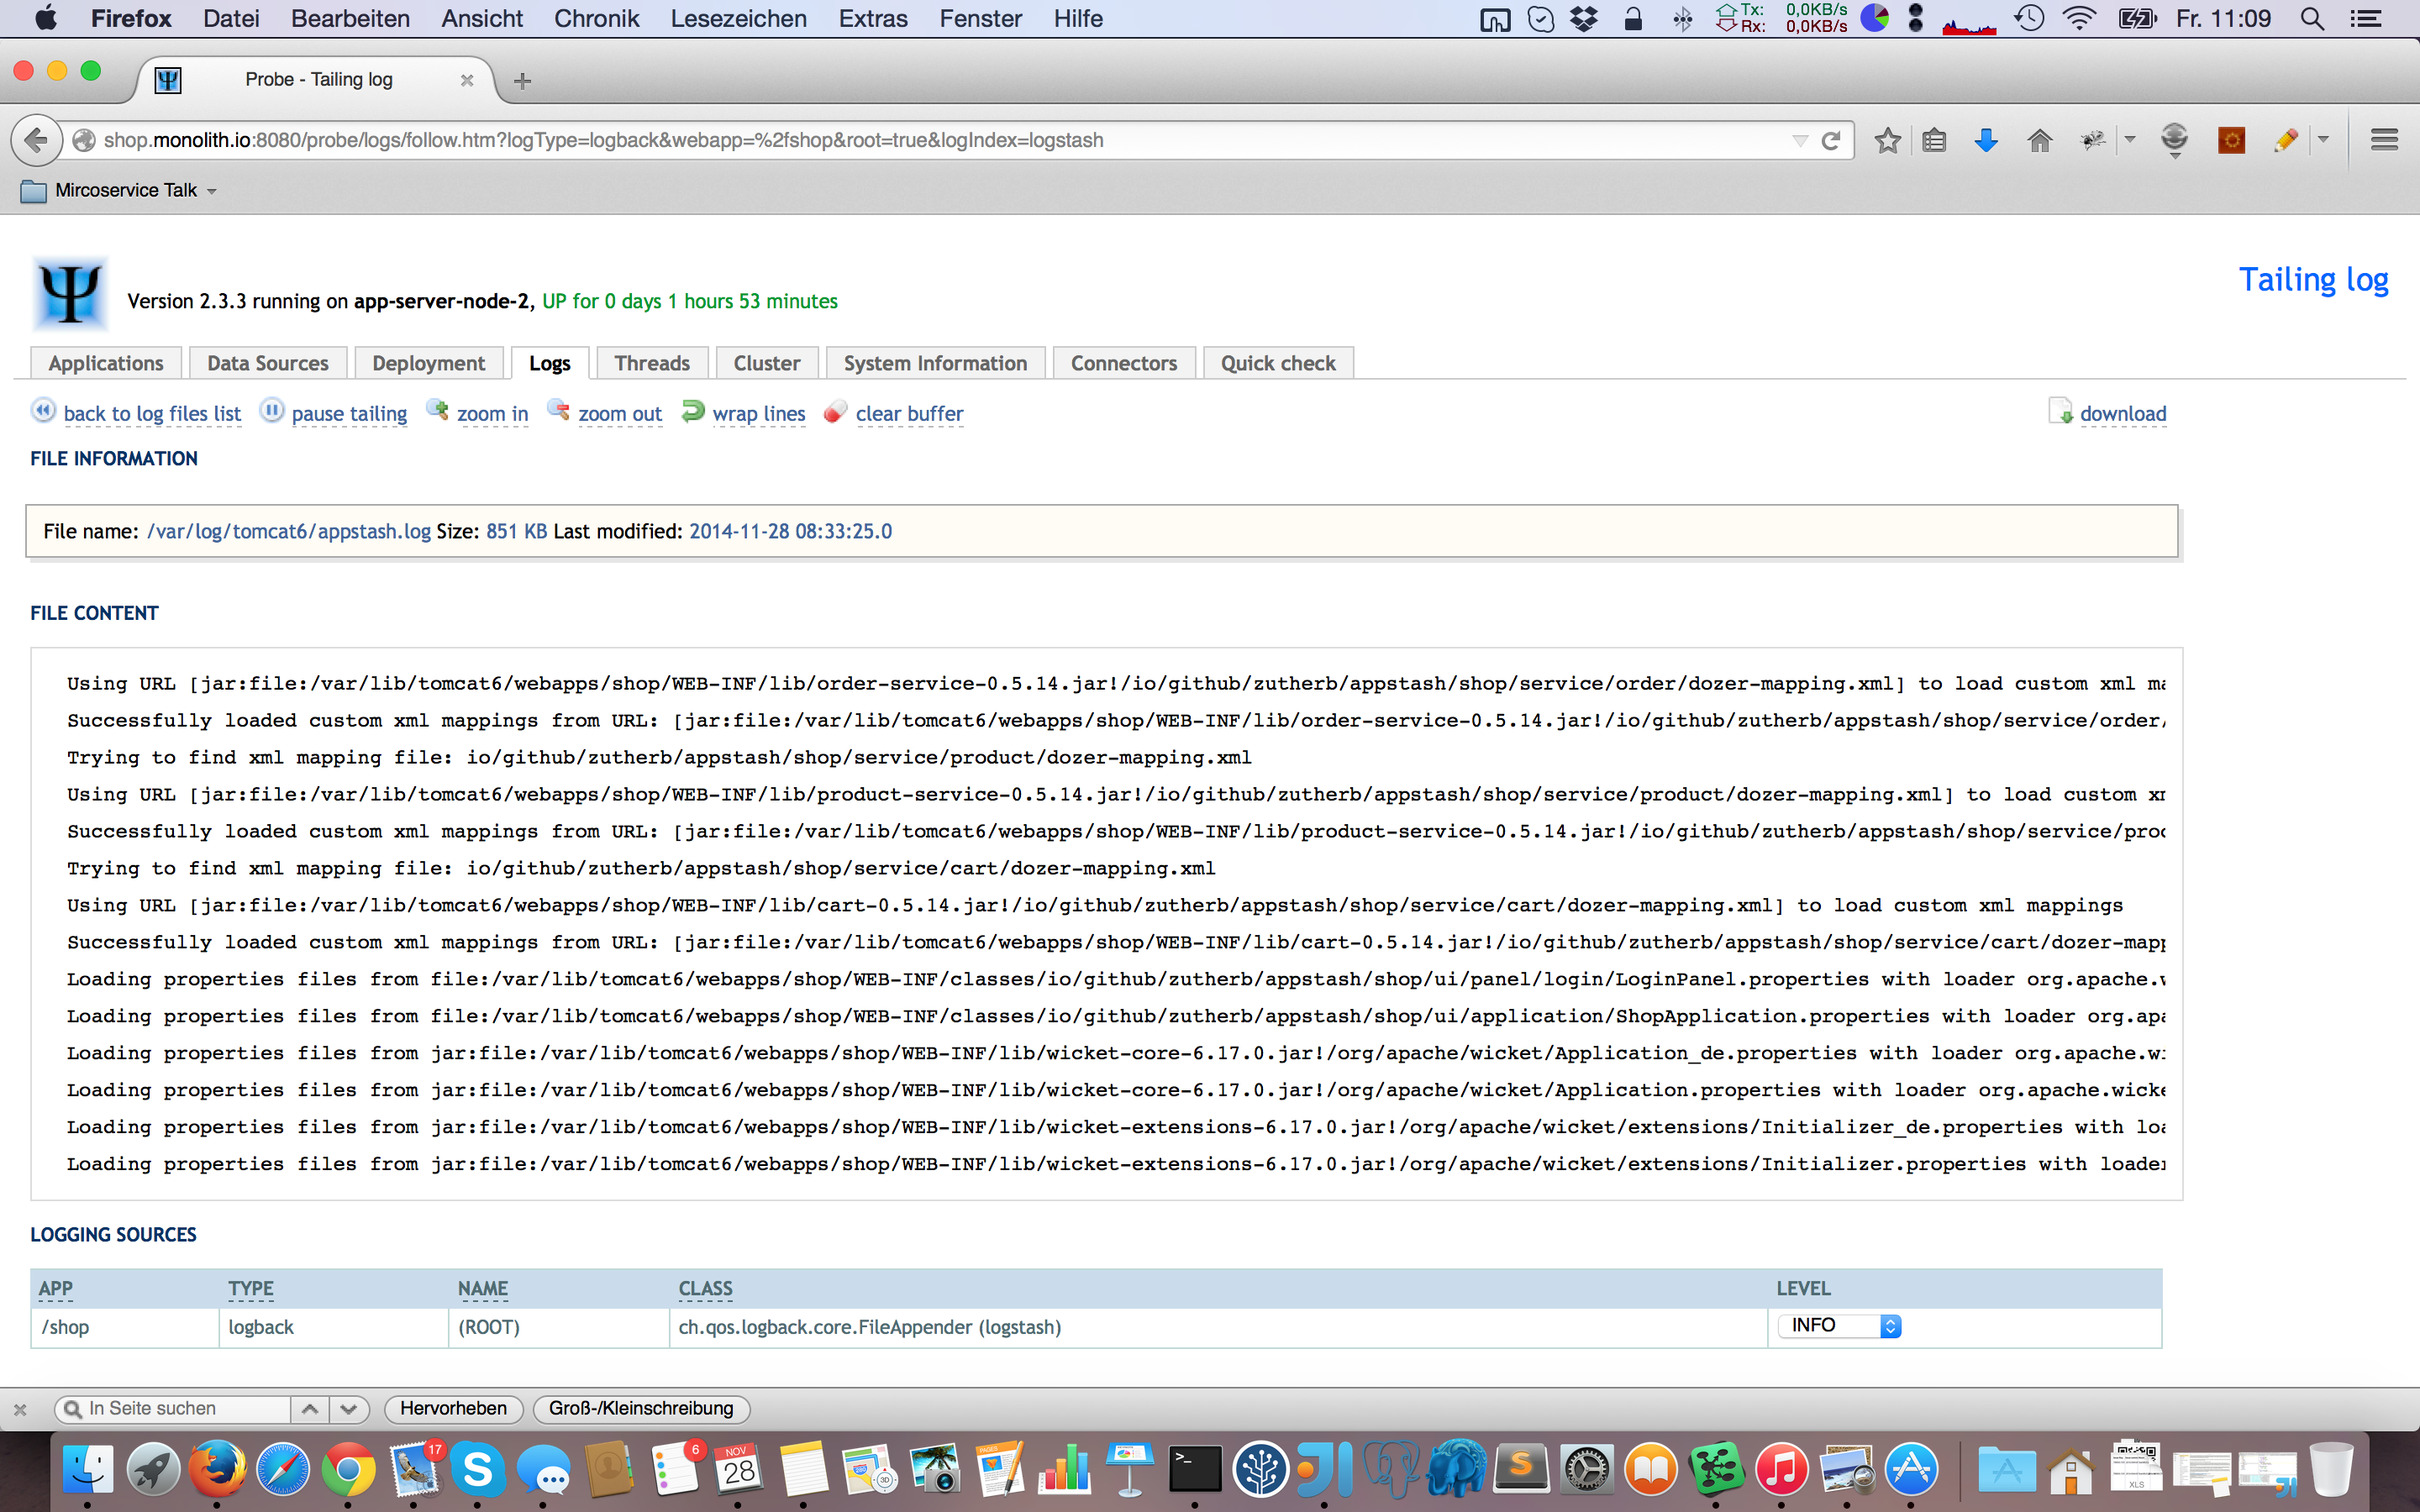
Furthermore you can reach the PSI Probe monitoring and log analysis services under the following url http://shop.monolith.io:8080/probe/. The user credentials are admin / topsecret.
PSI Probe is a community-driven fork of Lambda Probe, which is intended to replace the Tomcat Manager and should make it easier to manage and monitor an instance of Apache Tomcat. PSI Probe does not require any changes to an existing app and it provides many features through a web-accessible interface that becomes available simply by deploying it to your server. These features include:
- Requests: Monitor traffic in real-time, even on a per-application basis.
- Sessions: Browse/search attributes, view last IP, expire, estimate size.
- Logs: View contents, download, change levels at runtime.
- Threads: View execution stack, kill.
- JVM: Memory usage charts, advise GC.
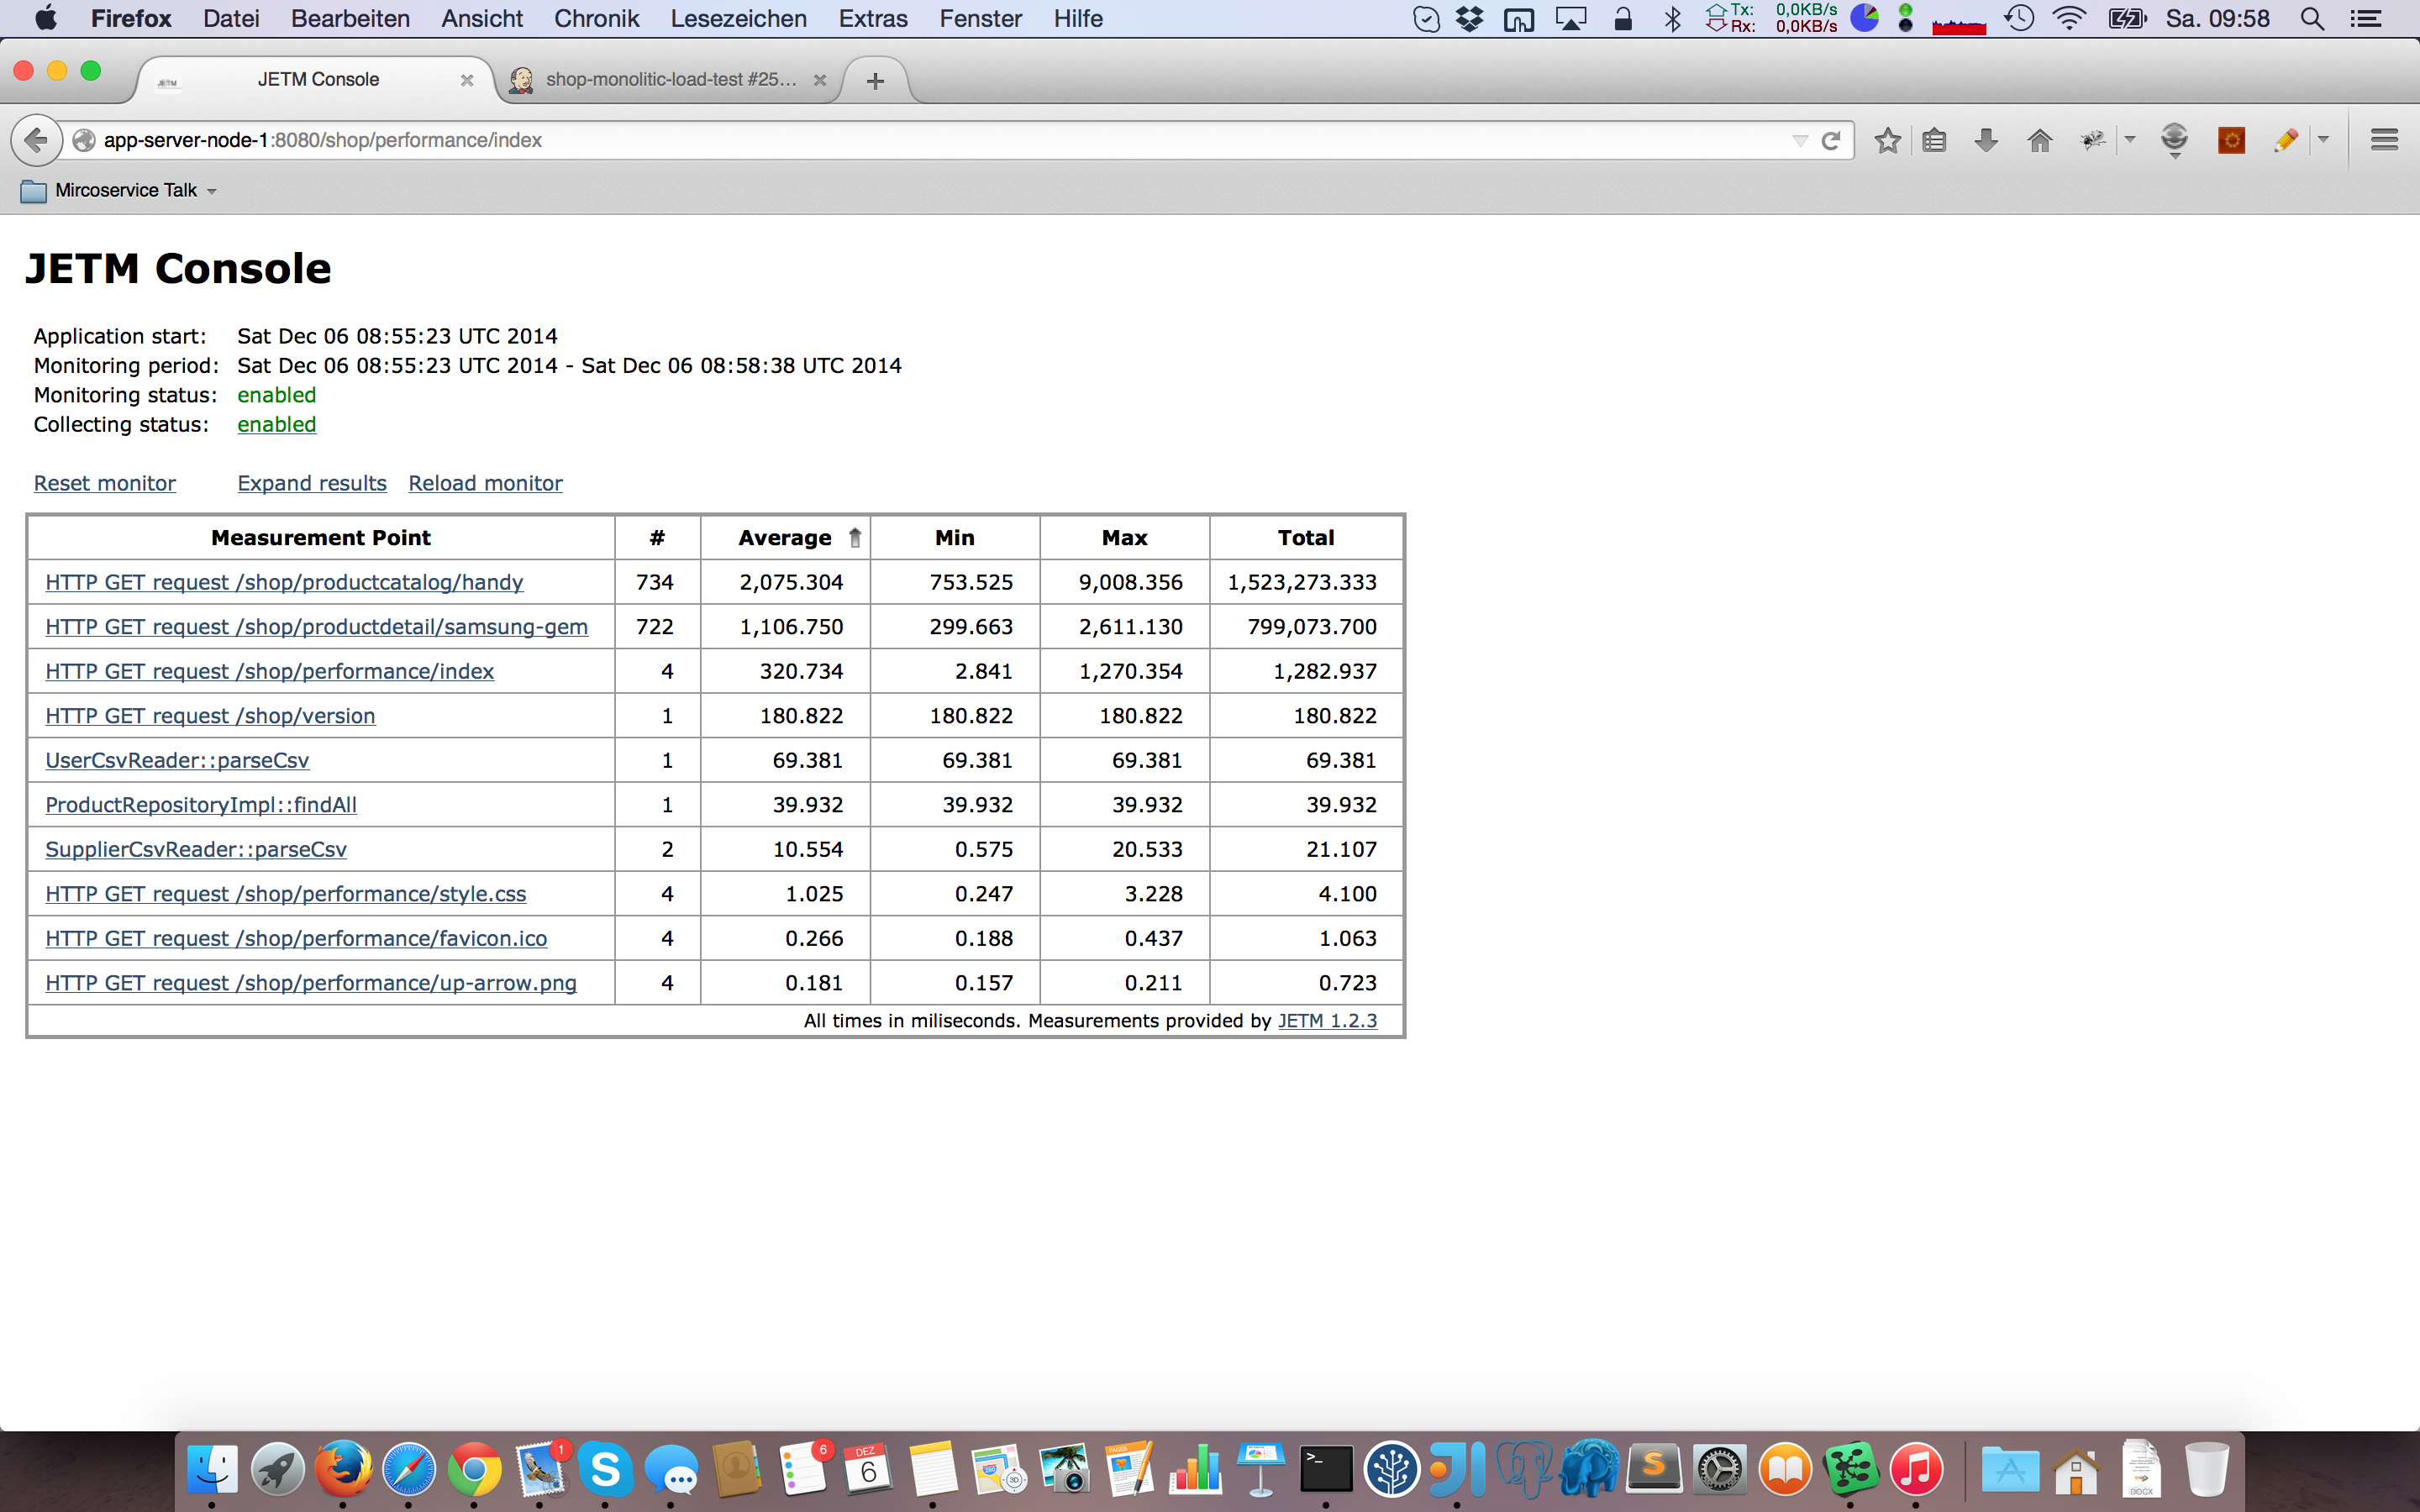
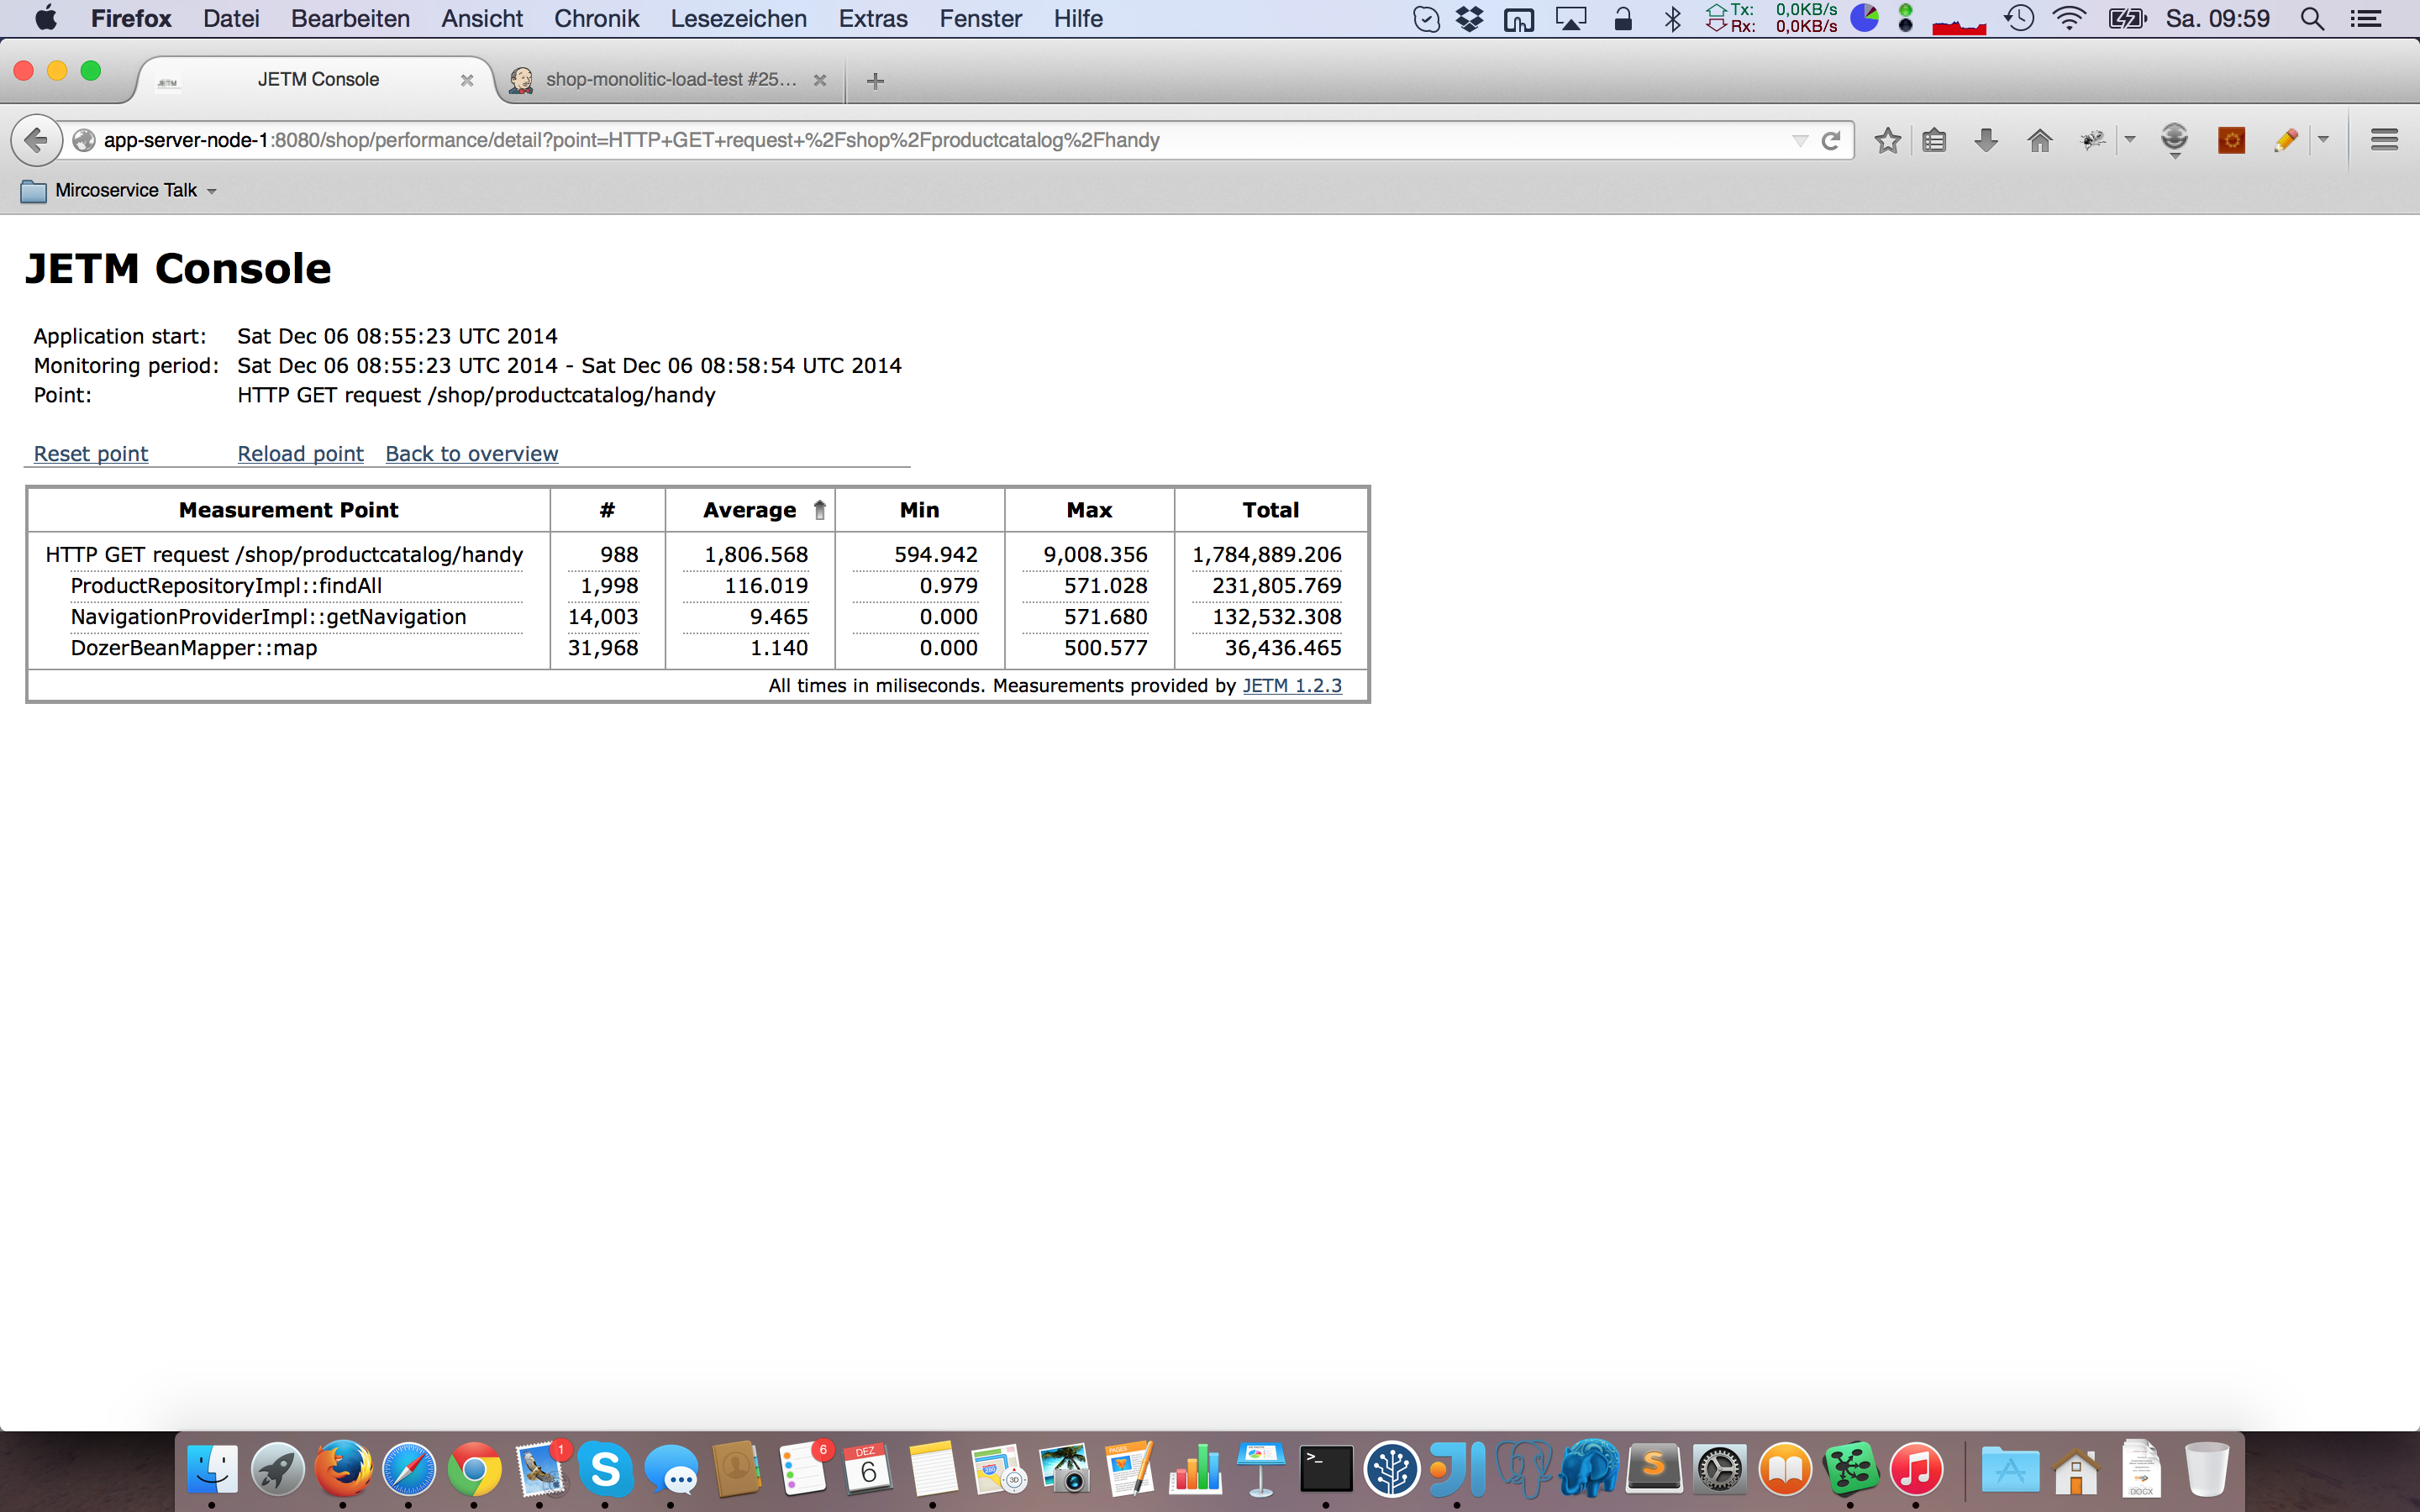
Moreover you access the performance monitor JETM under the following url http://shop.monolith.io:8080/shop/performance/ which is a small and free library that is included in the monolith online shop, that helps locating performance problems in existing Java applications. JETM enables developers to track down performance issues on demand, either programmatic or declarative with minimal impact on application performance, even in production.
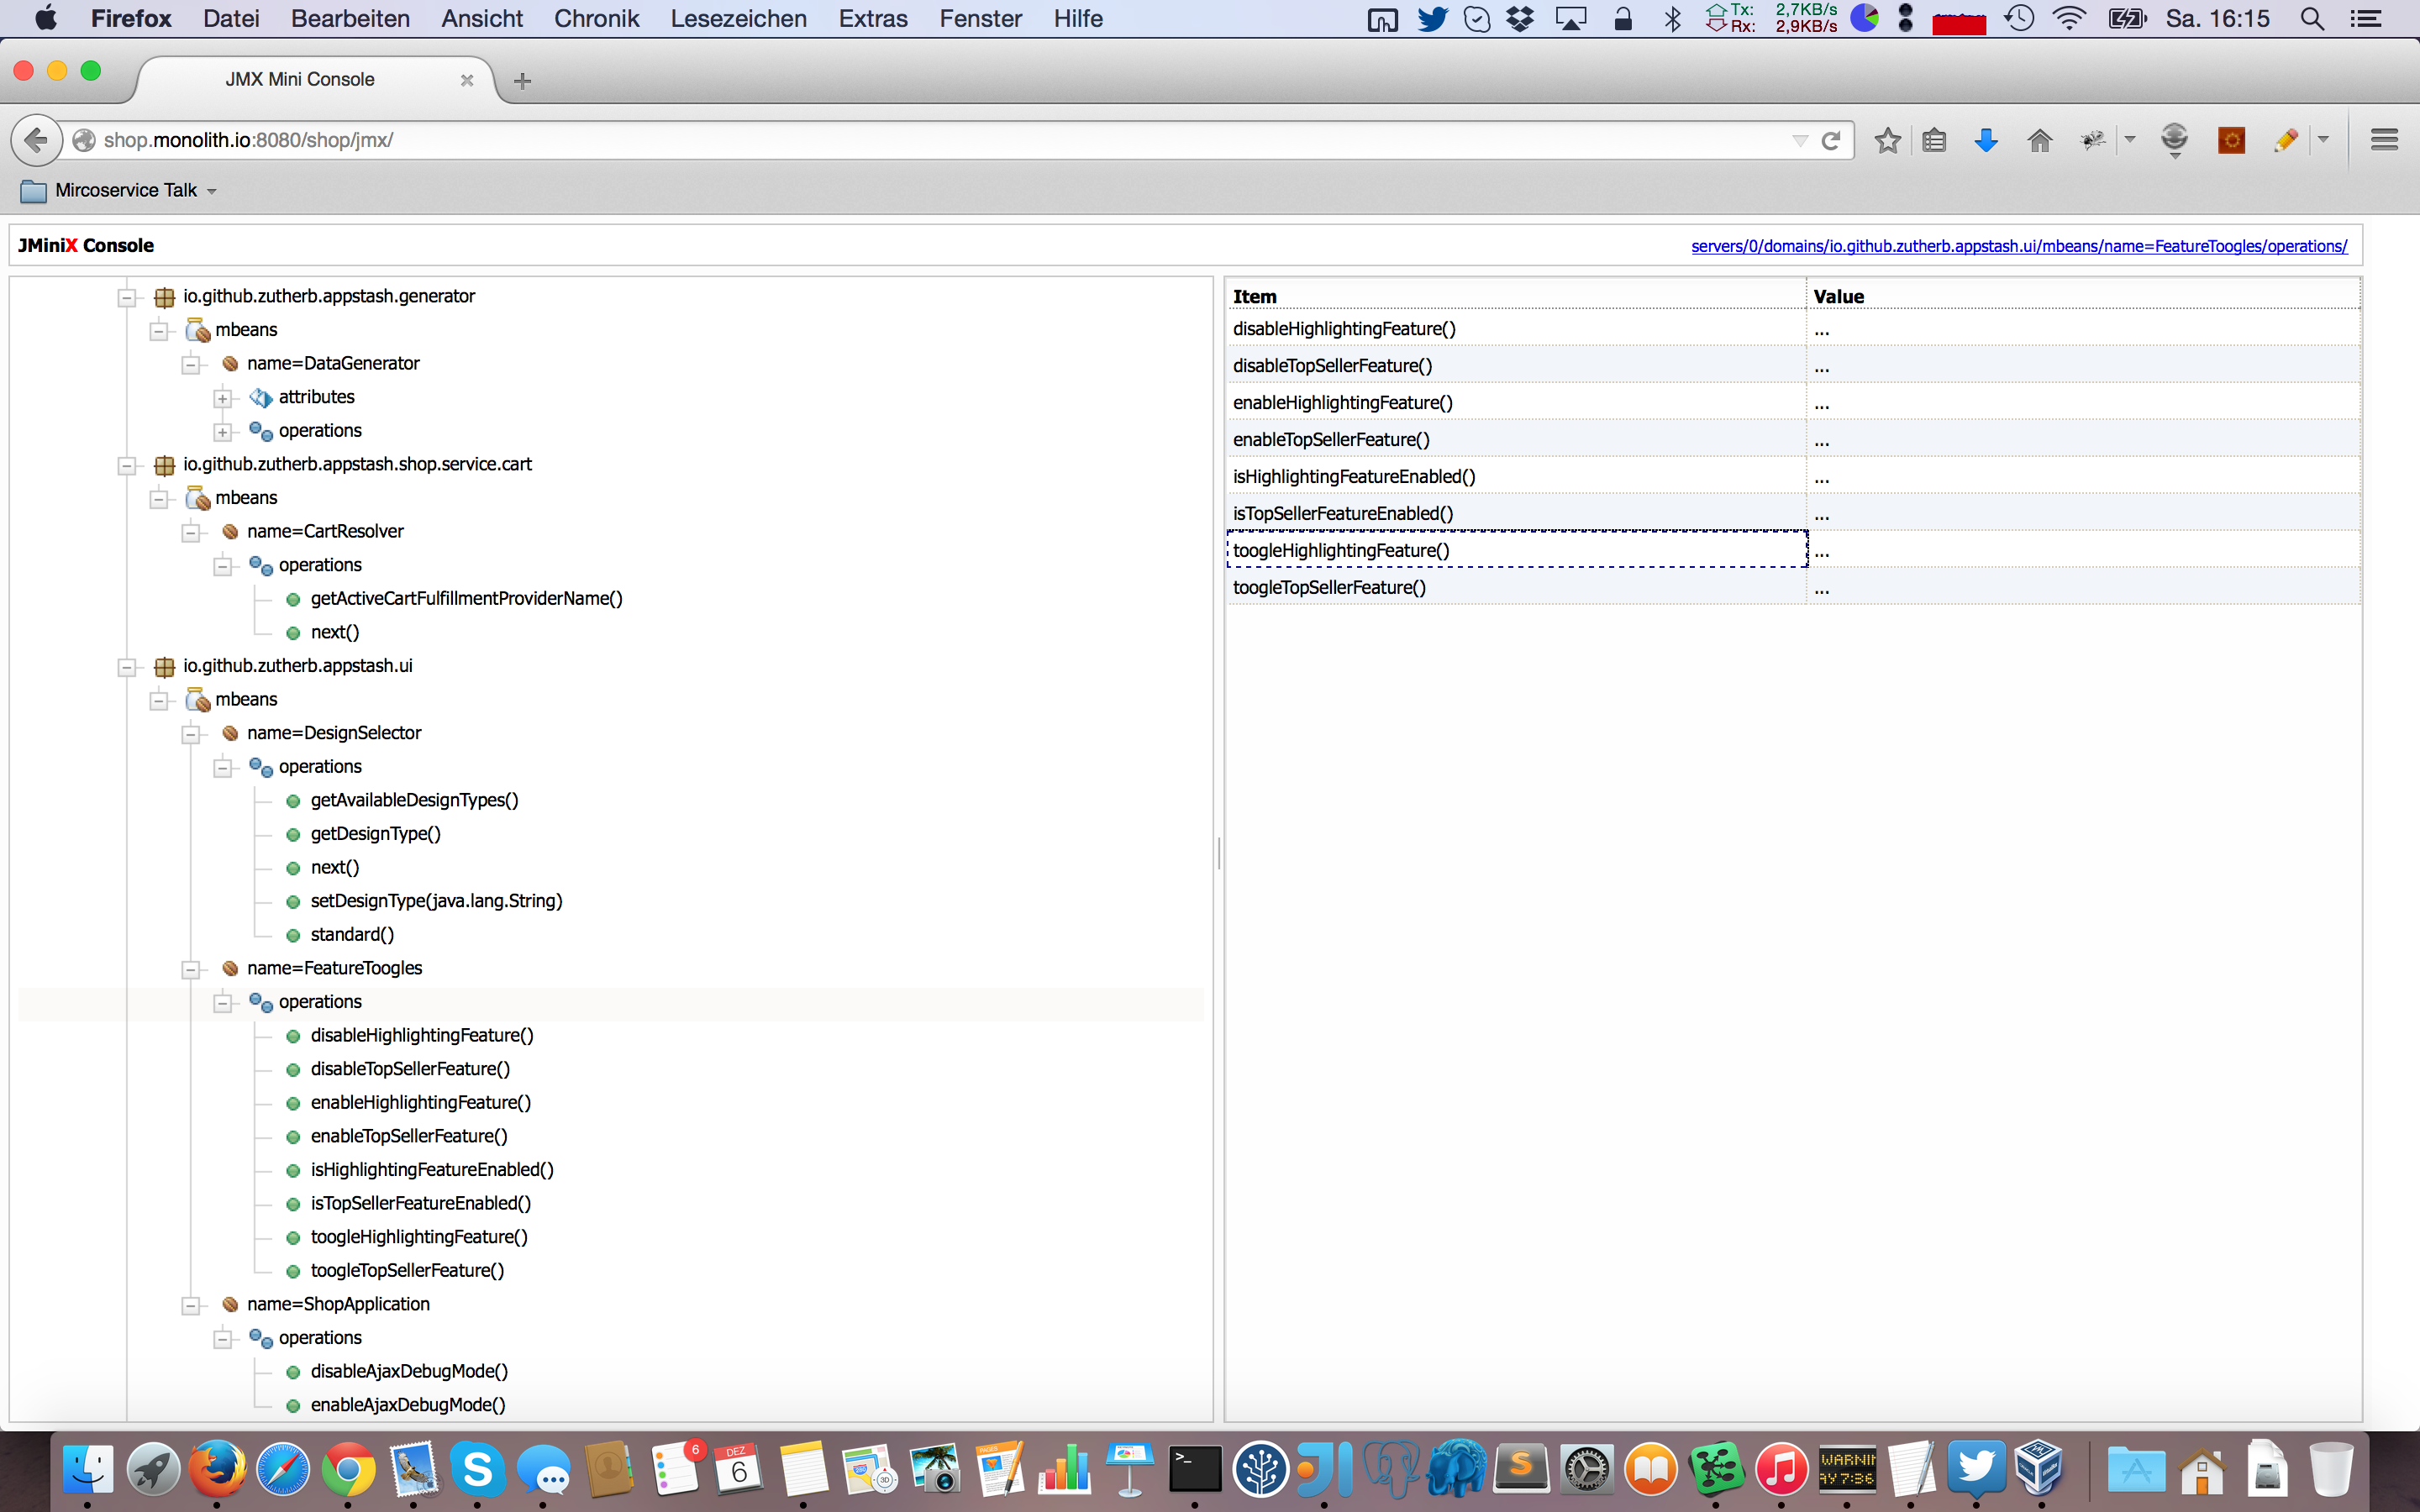
JMX is a natural way to have access to technical management, e.g. for tuning, statistics, log levels and so on. Unfortunately, it lacks a lightweight tool to expose mbeans and to browse them securely on any application and environment without heavy infrastructure setup. JMiniX provides such a feature. You can reach JMiniX under the following url http://shop.monolith.io:8080/shop/jmx/.
###Microservice Appserver
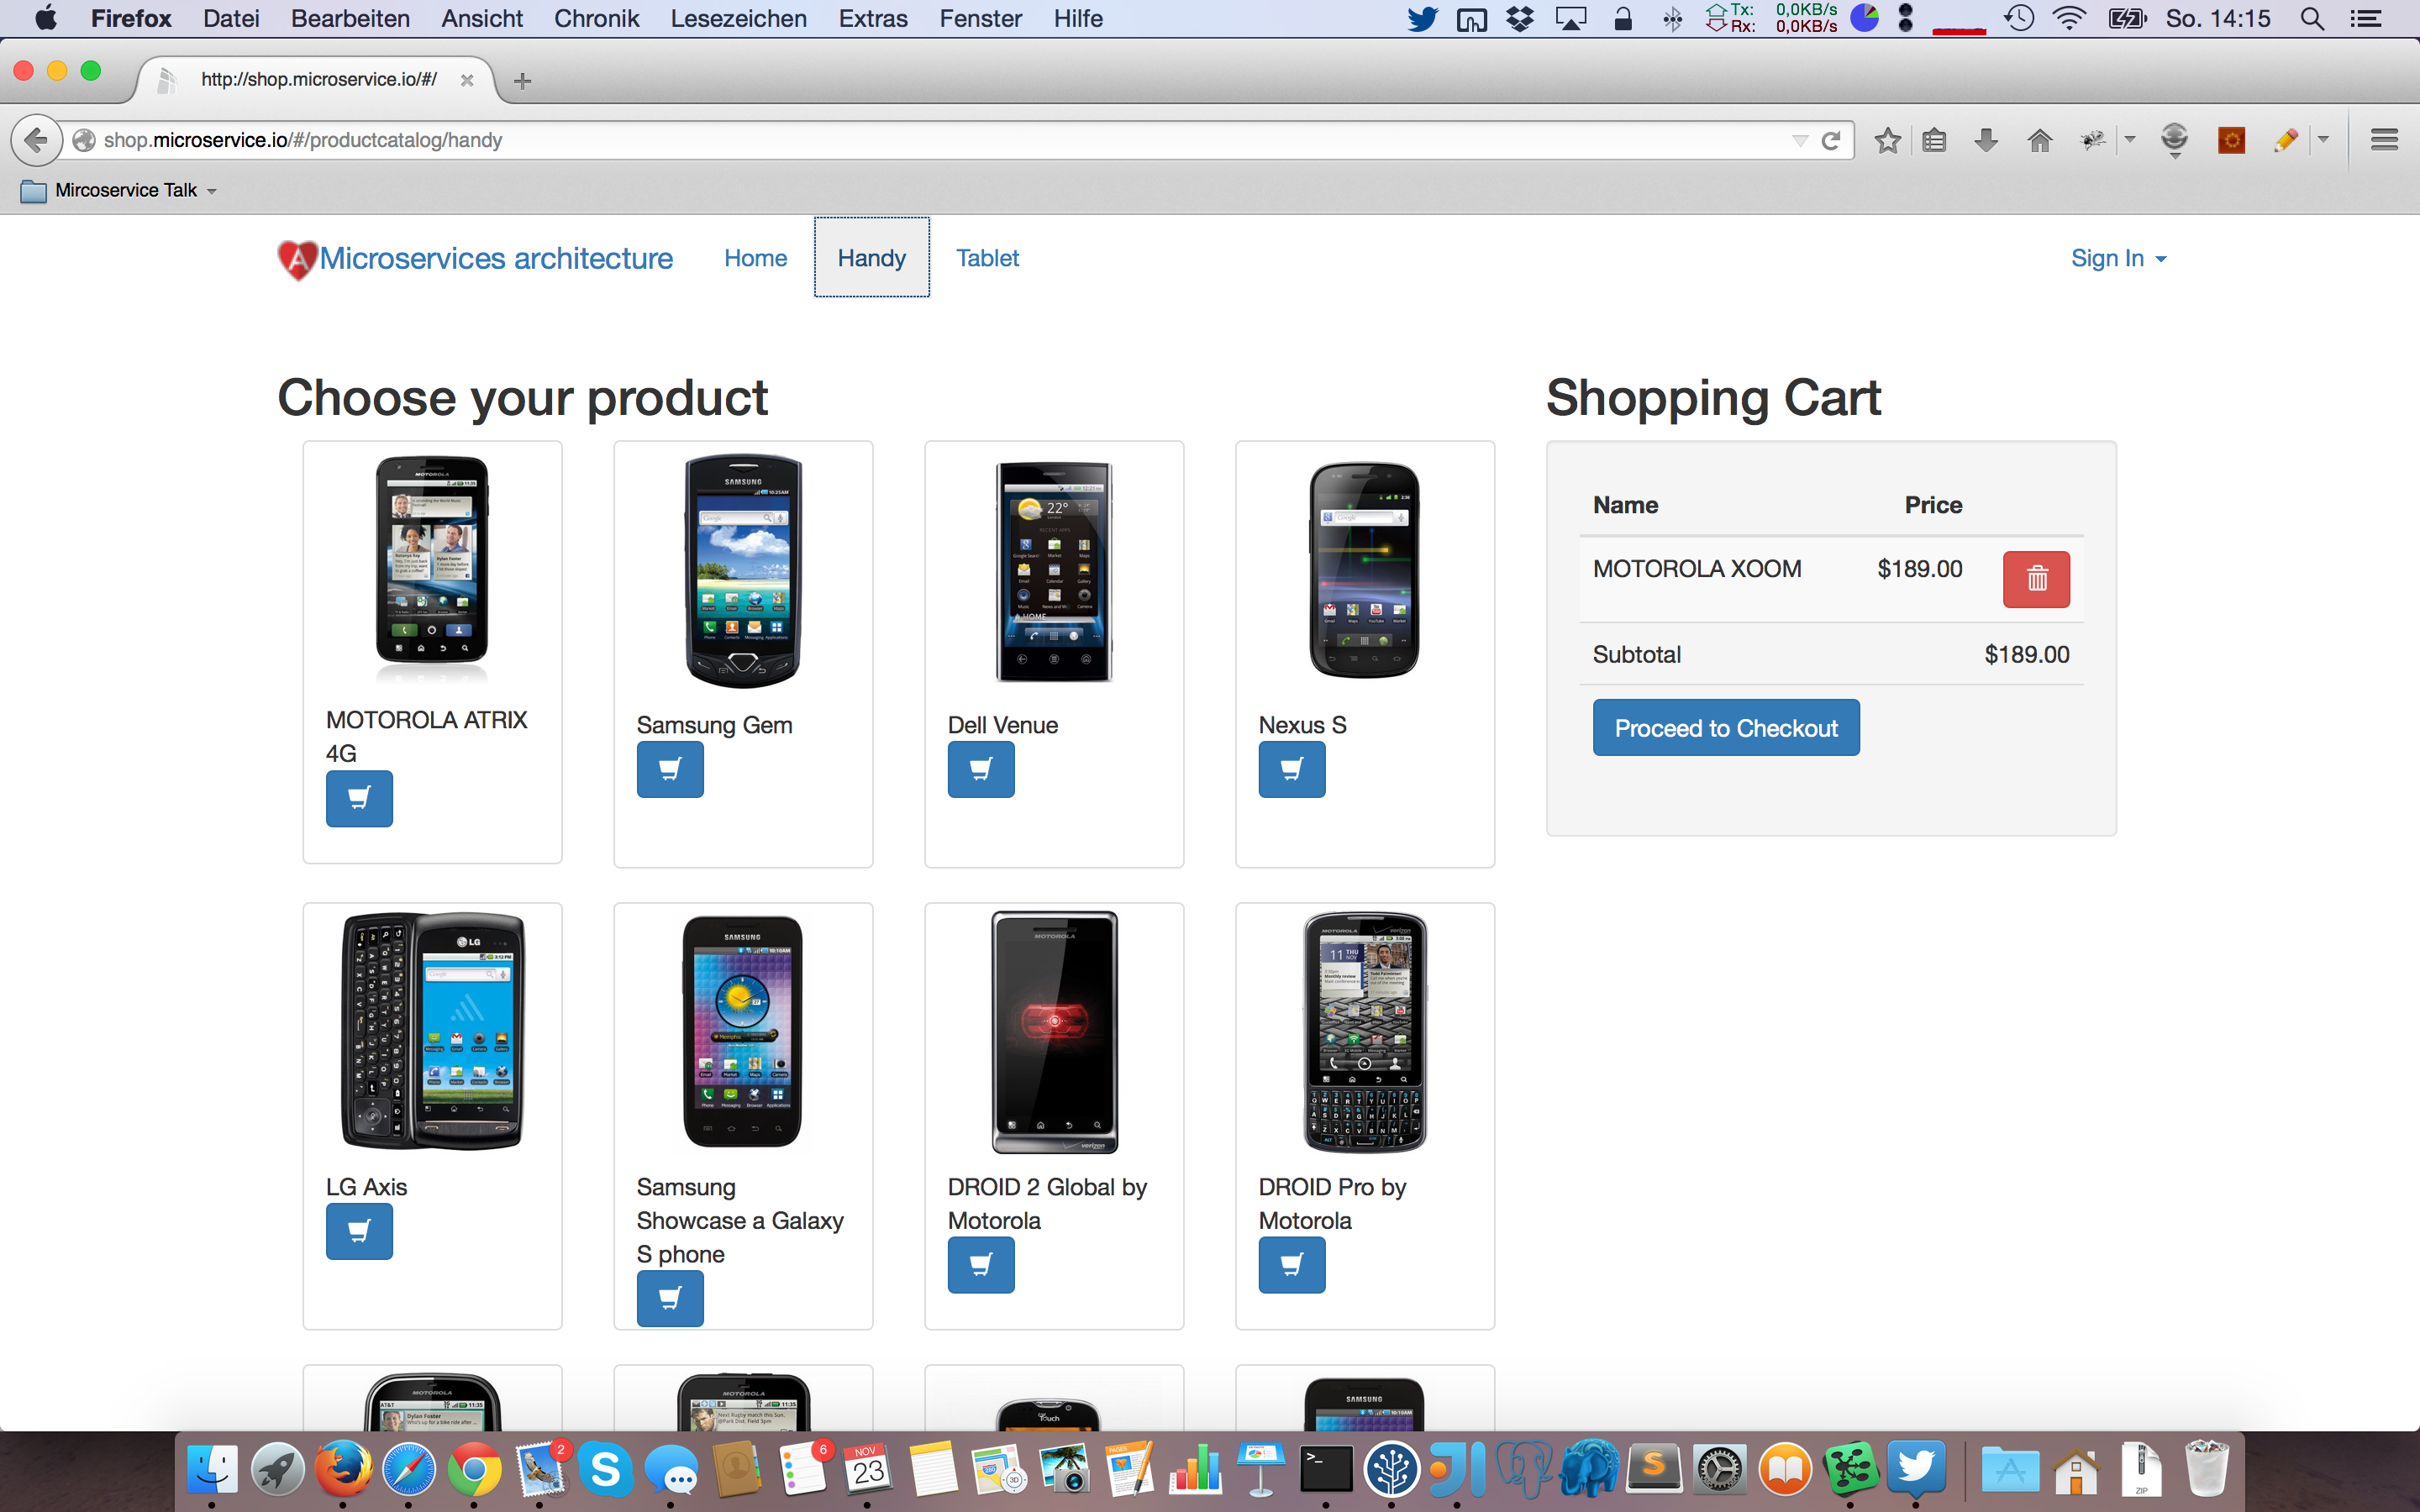
The microservice based online shop is deployed on the microservice appserver which is a reference implementation for the given use cases in the Overview. You can reach the online shop under the following url http://shop.microservice.io/ .
The microservice based online shop consists of two frontend parts as you can see in the deployment diagram in the overview section. The first part is an AngularJS Catalog Frontend that makes it possible to see a catalog for mobiles as well as a catalog for tablets. Furthermore a user is able to create a cart. If a user wants to order a created cart there is same clue logic in the monolithic web application that a cart which was created in the AngularJS Catalog Frontend can be order with the checkout of the Wicket online shop on the monolith appserver.
###Monitoring Server
Monitoring a monolithic web application is no major pain as you can see in the monolith appserver section. A distributed web application, like it is shown in the microservice appserver section, is not so easy to monitor. In this small example there is a Ngnix web server that logs all request that comes into it. The Ngnix deliveries a AngularJS Catalog Frontend that represents a A single-page application (SPA). A SPA is a web application that fits on a single web page with the goal of providing a more fluid user experience akin to a desktop application. In addition to the SPA there are the three rest services a cart, product and a navigation service which are need for the different uses cases and are implemented in the programming languages Groovy, Scala and Java. This services must be alive that an user can see the products or create a cart. Furthermore there is a legacy JEE web application which is deployed in a Tomcat Webserver. An user can order its cart with that legacy JEE web application.
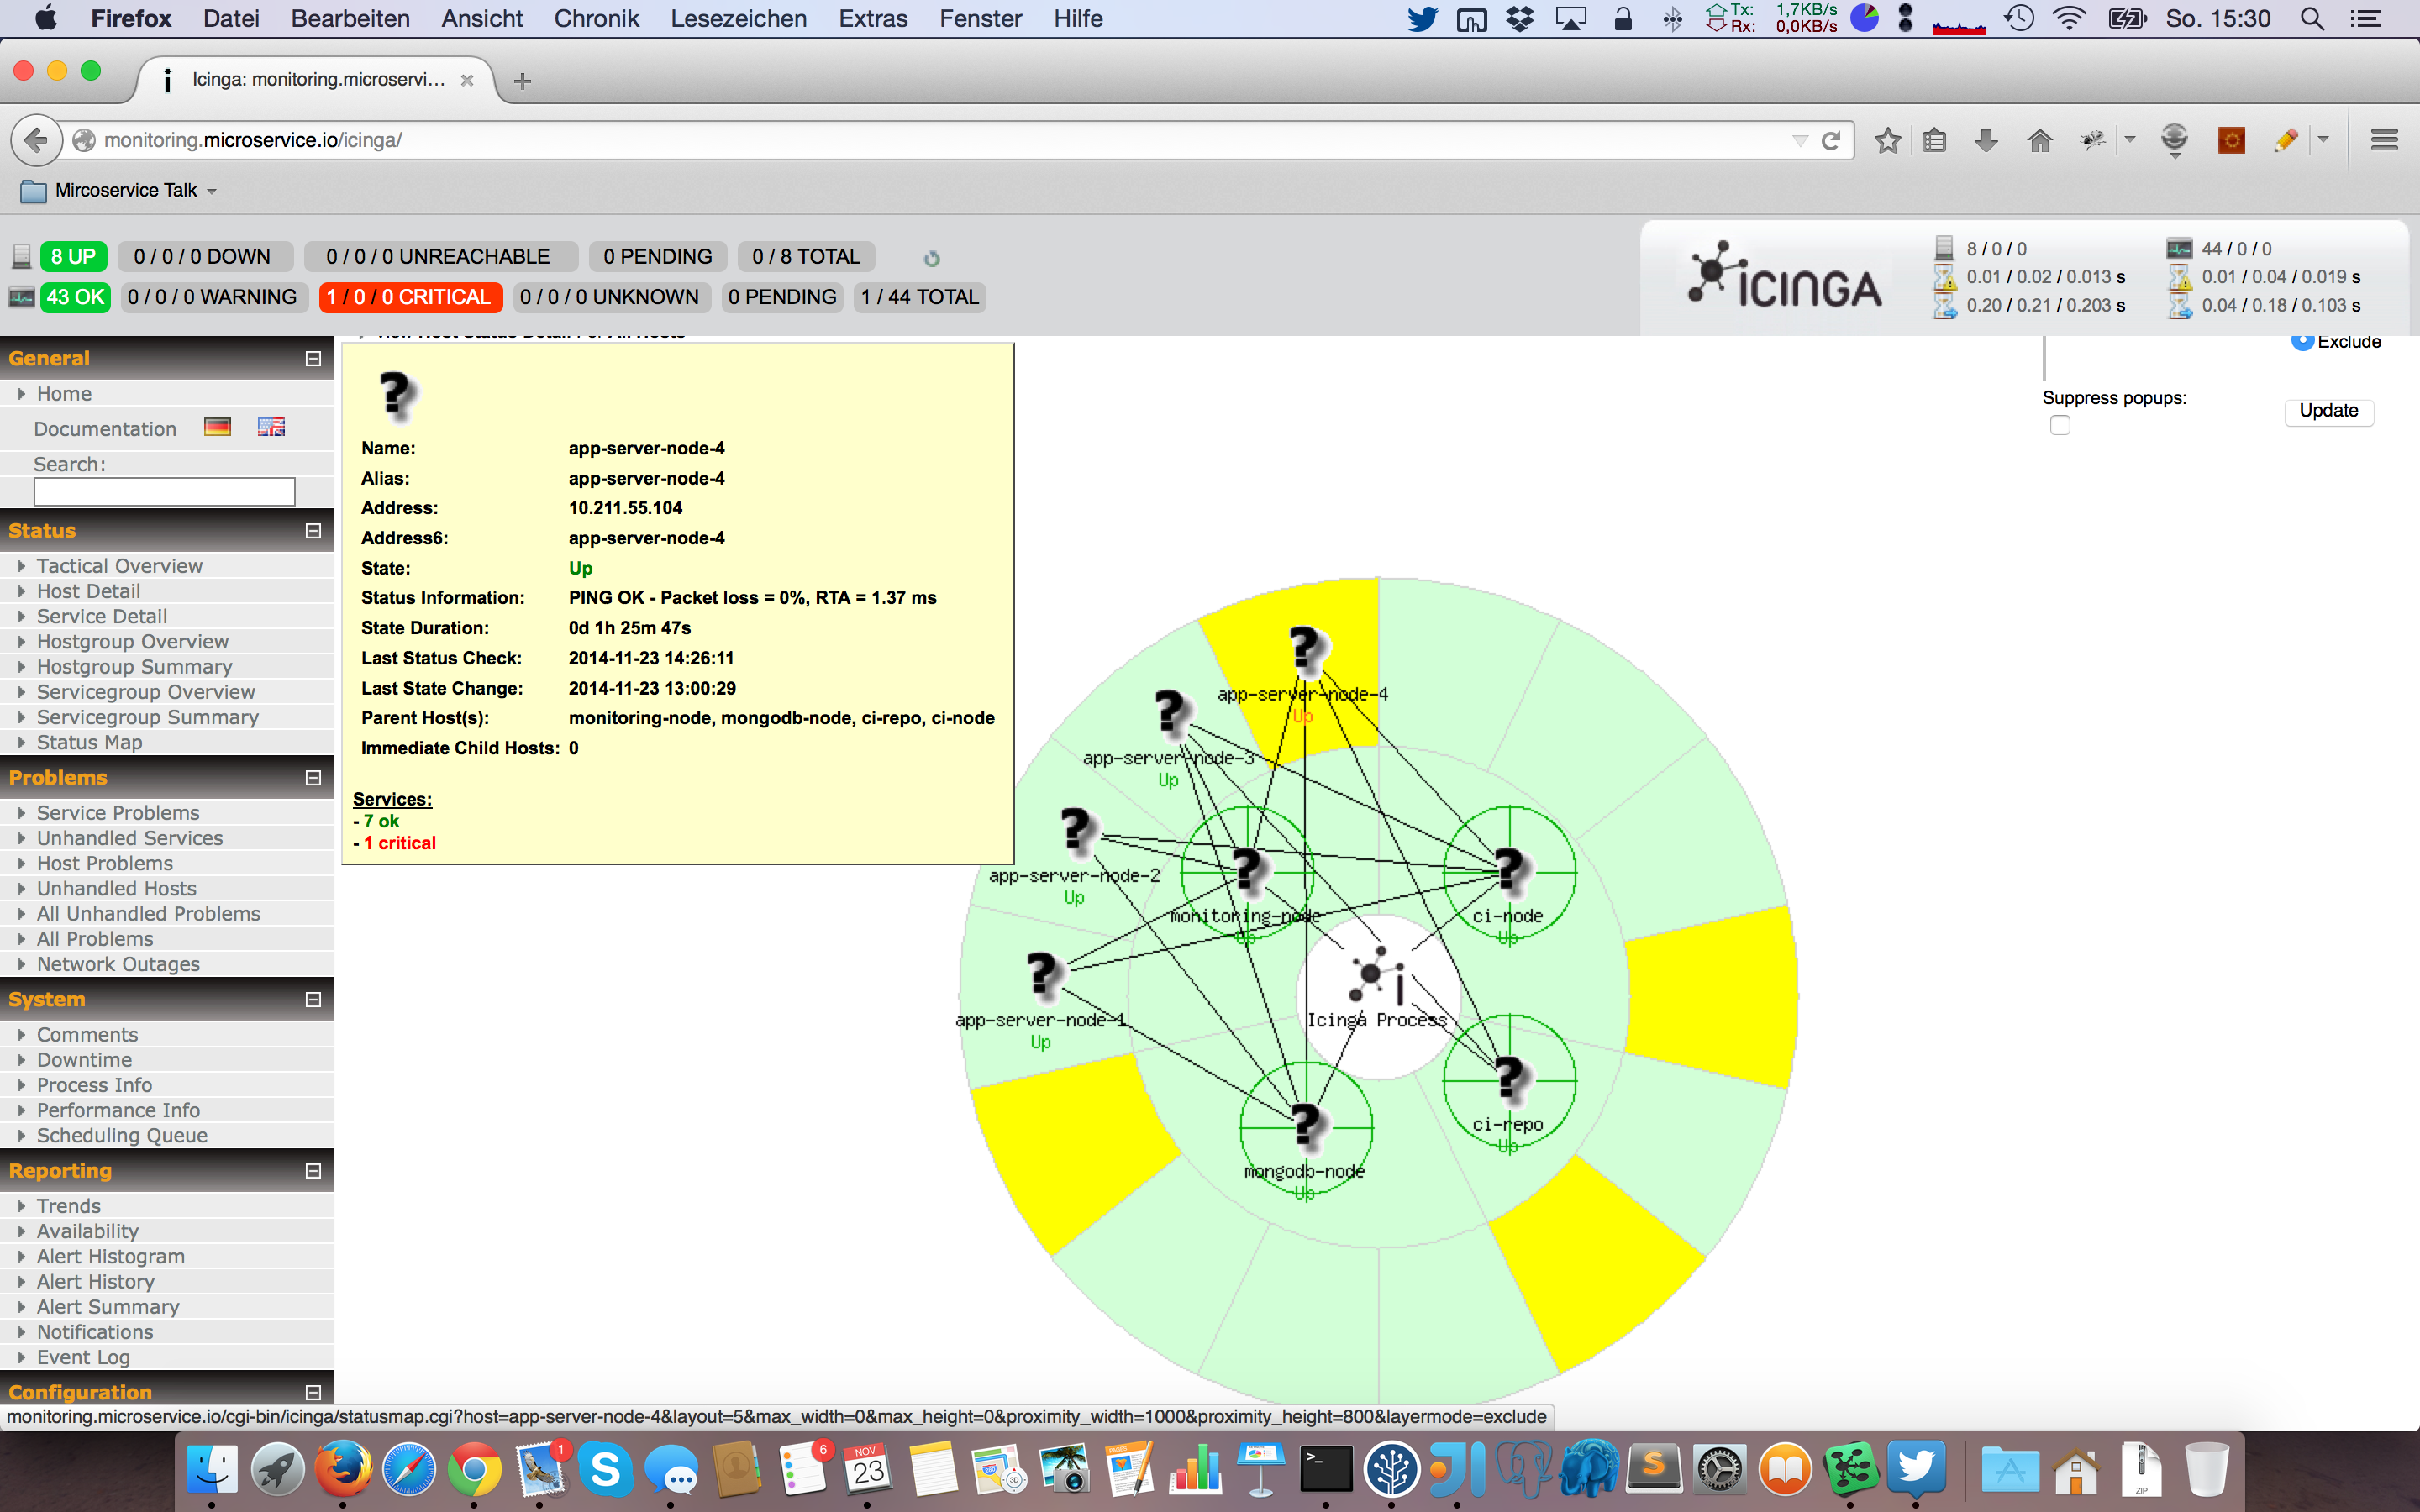
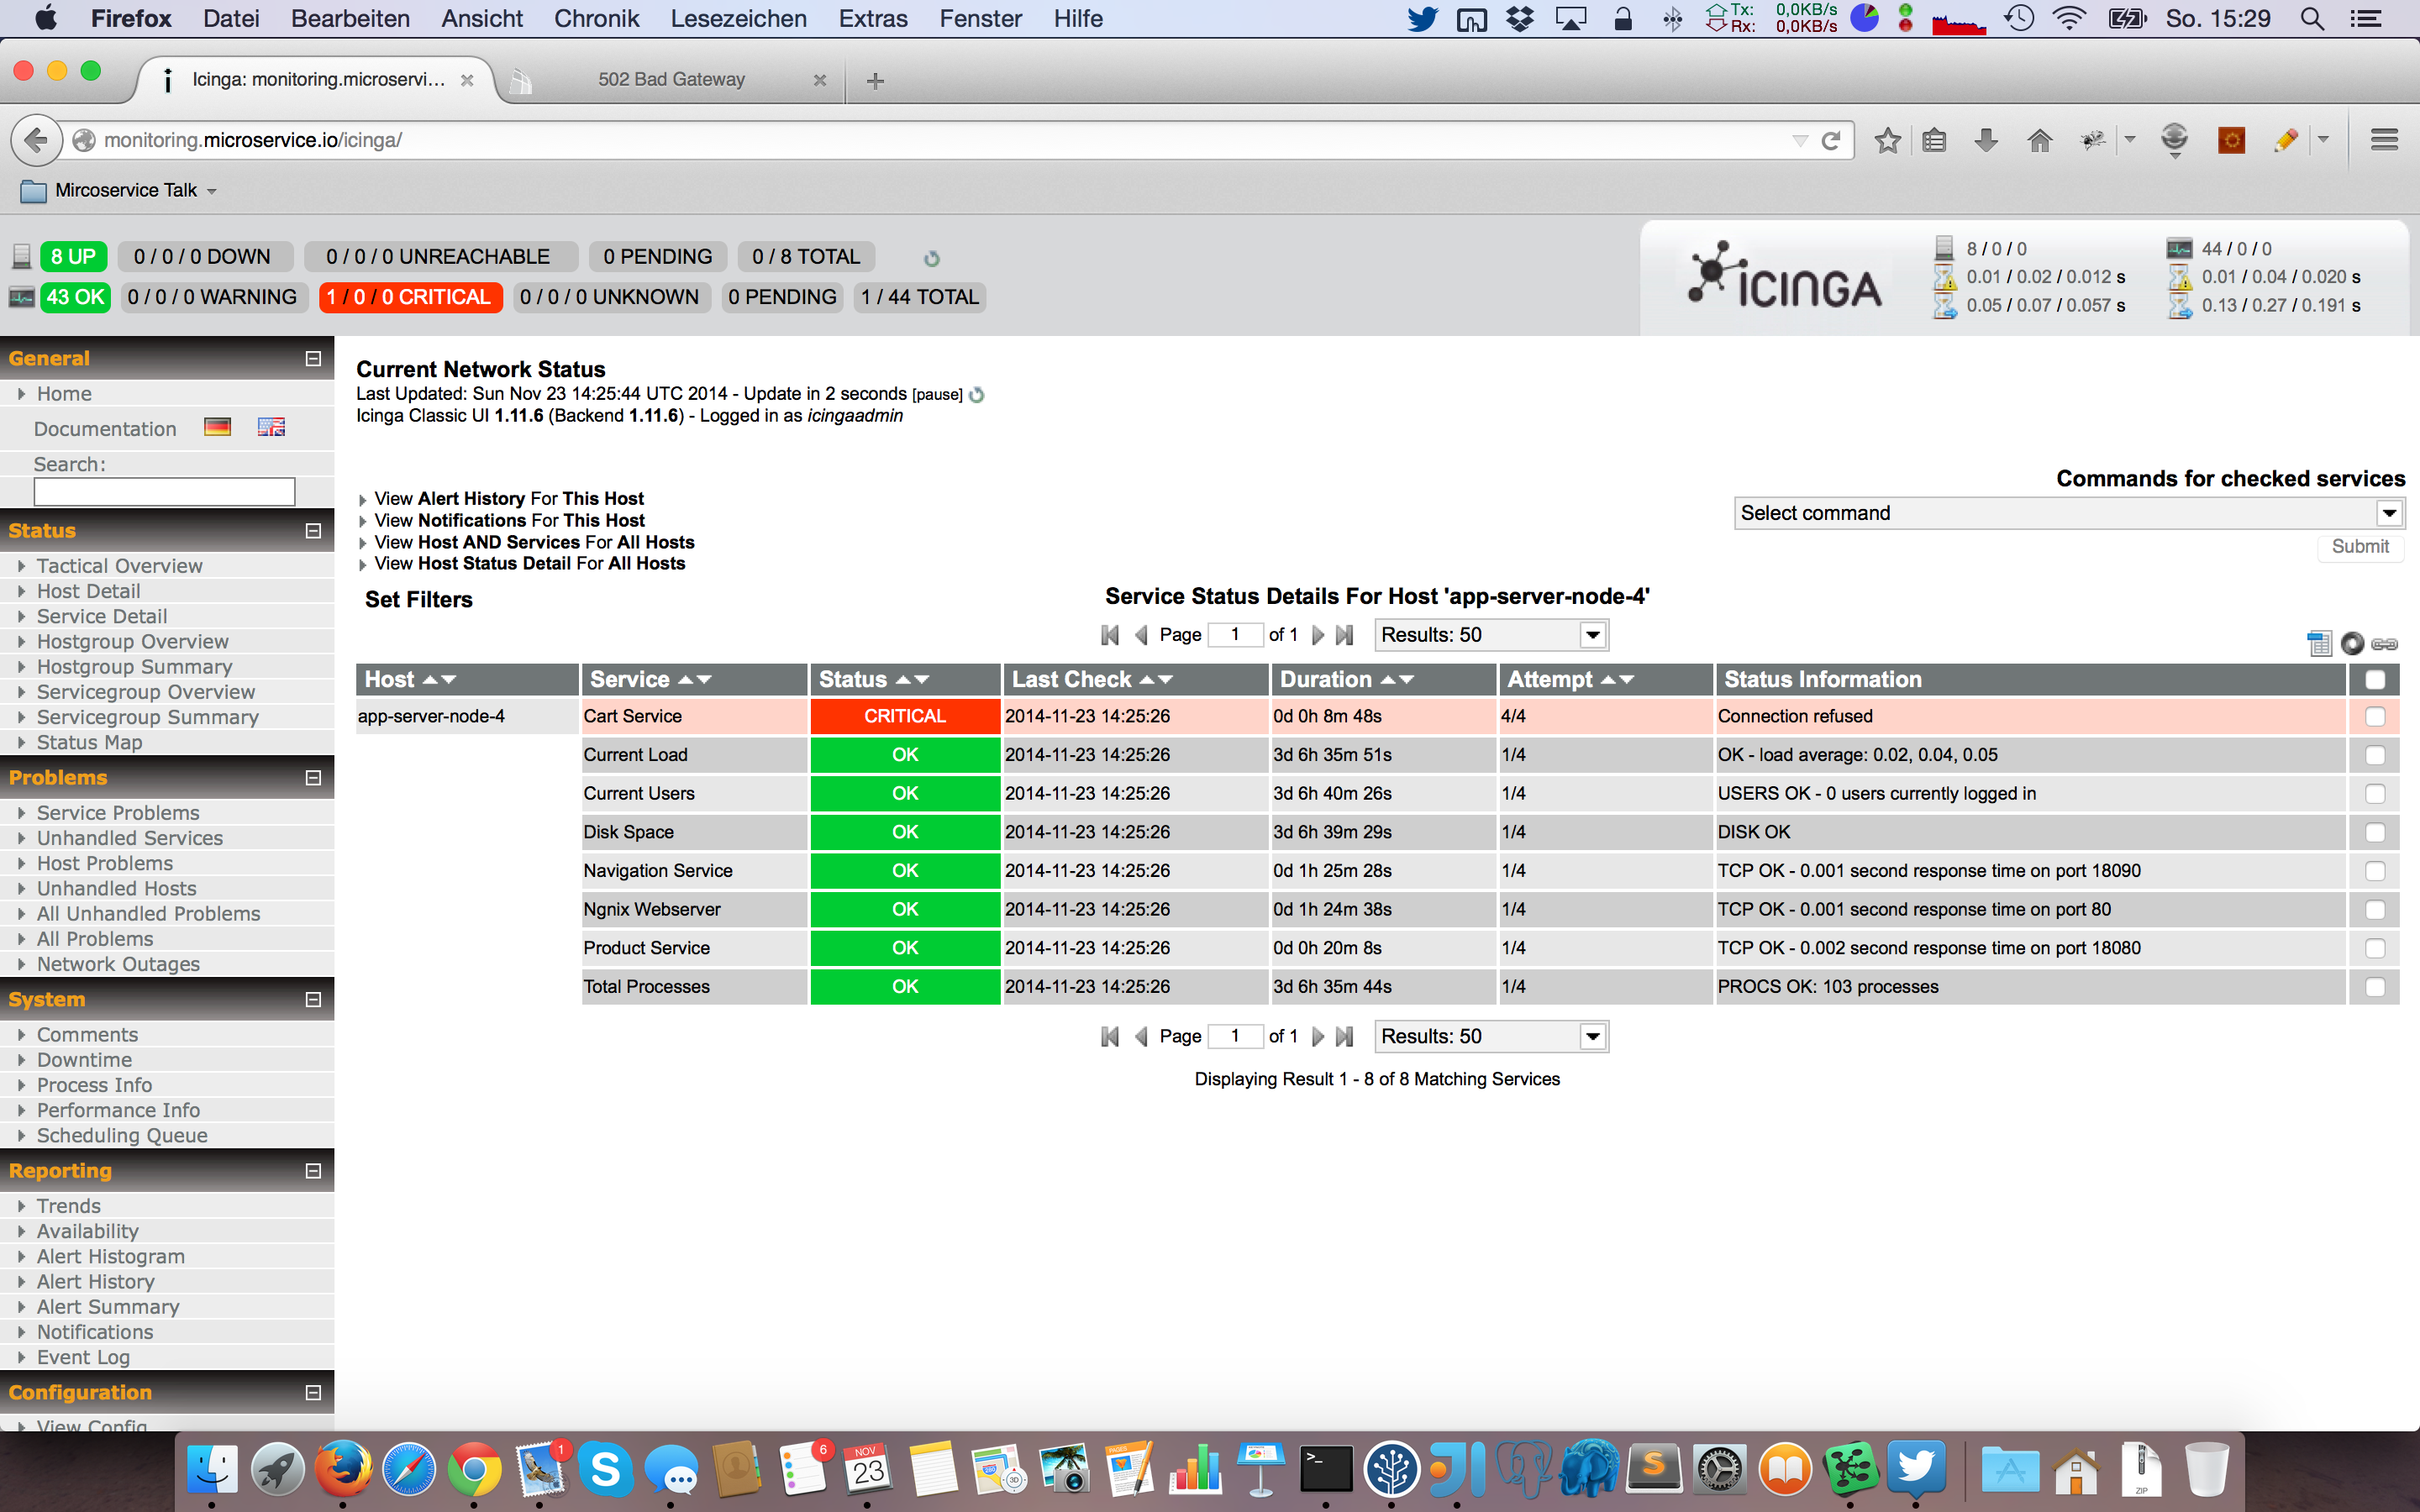
Icinga is an open source network and computer system monitoring application. It was originally created as a fork of the Nagios system monitoring application. Icinga is attempting to get past perceived short-comings in Nagios development process, as well as adding new features such as a modern Web 2.0 style user interface, additional database connectors, and a REST API that lets administrators integrate numerous extensions without complicated modification of the Icinga core.
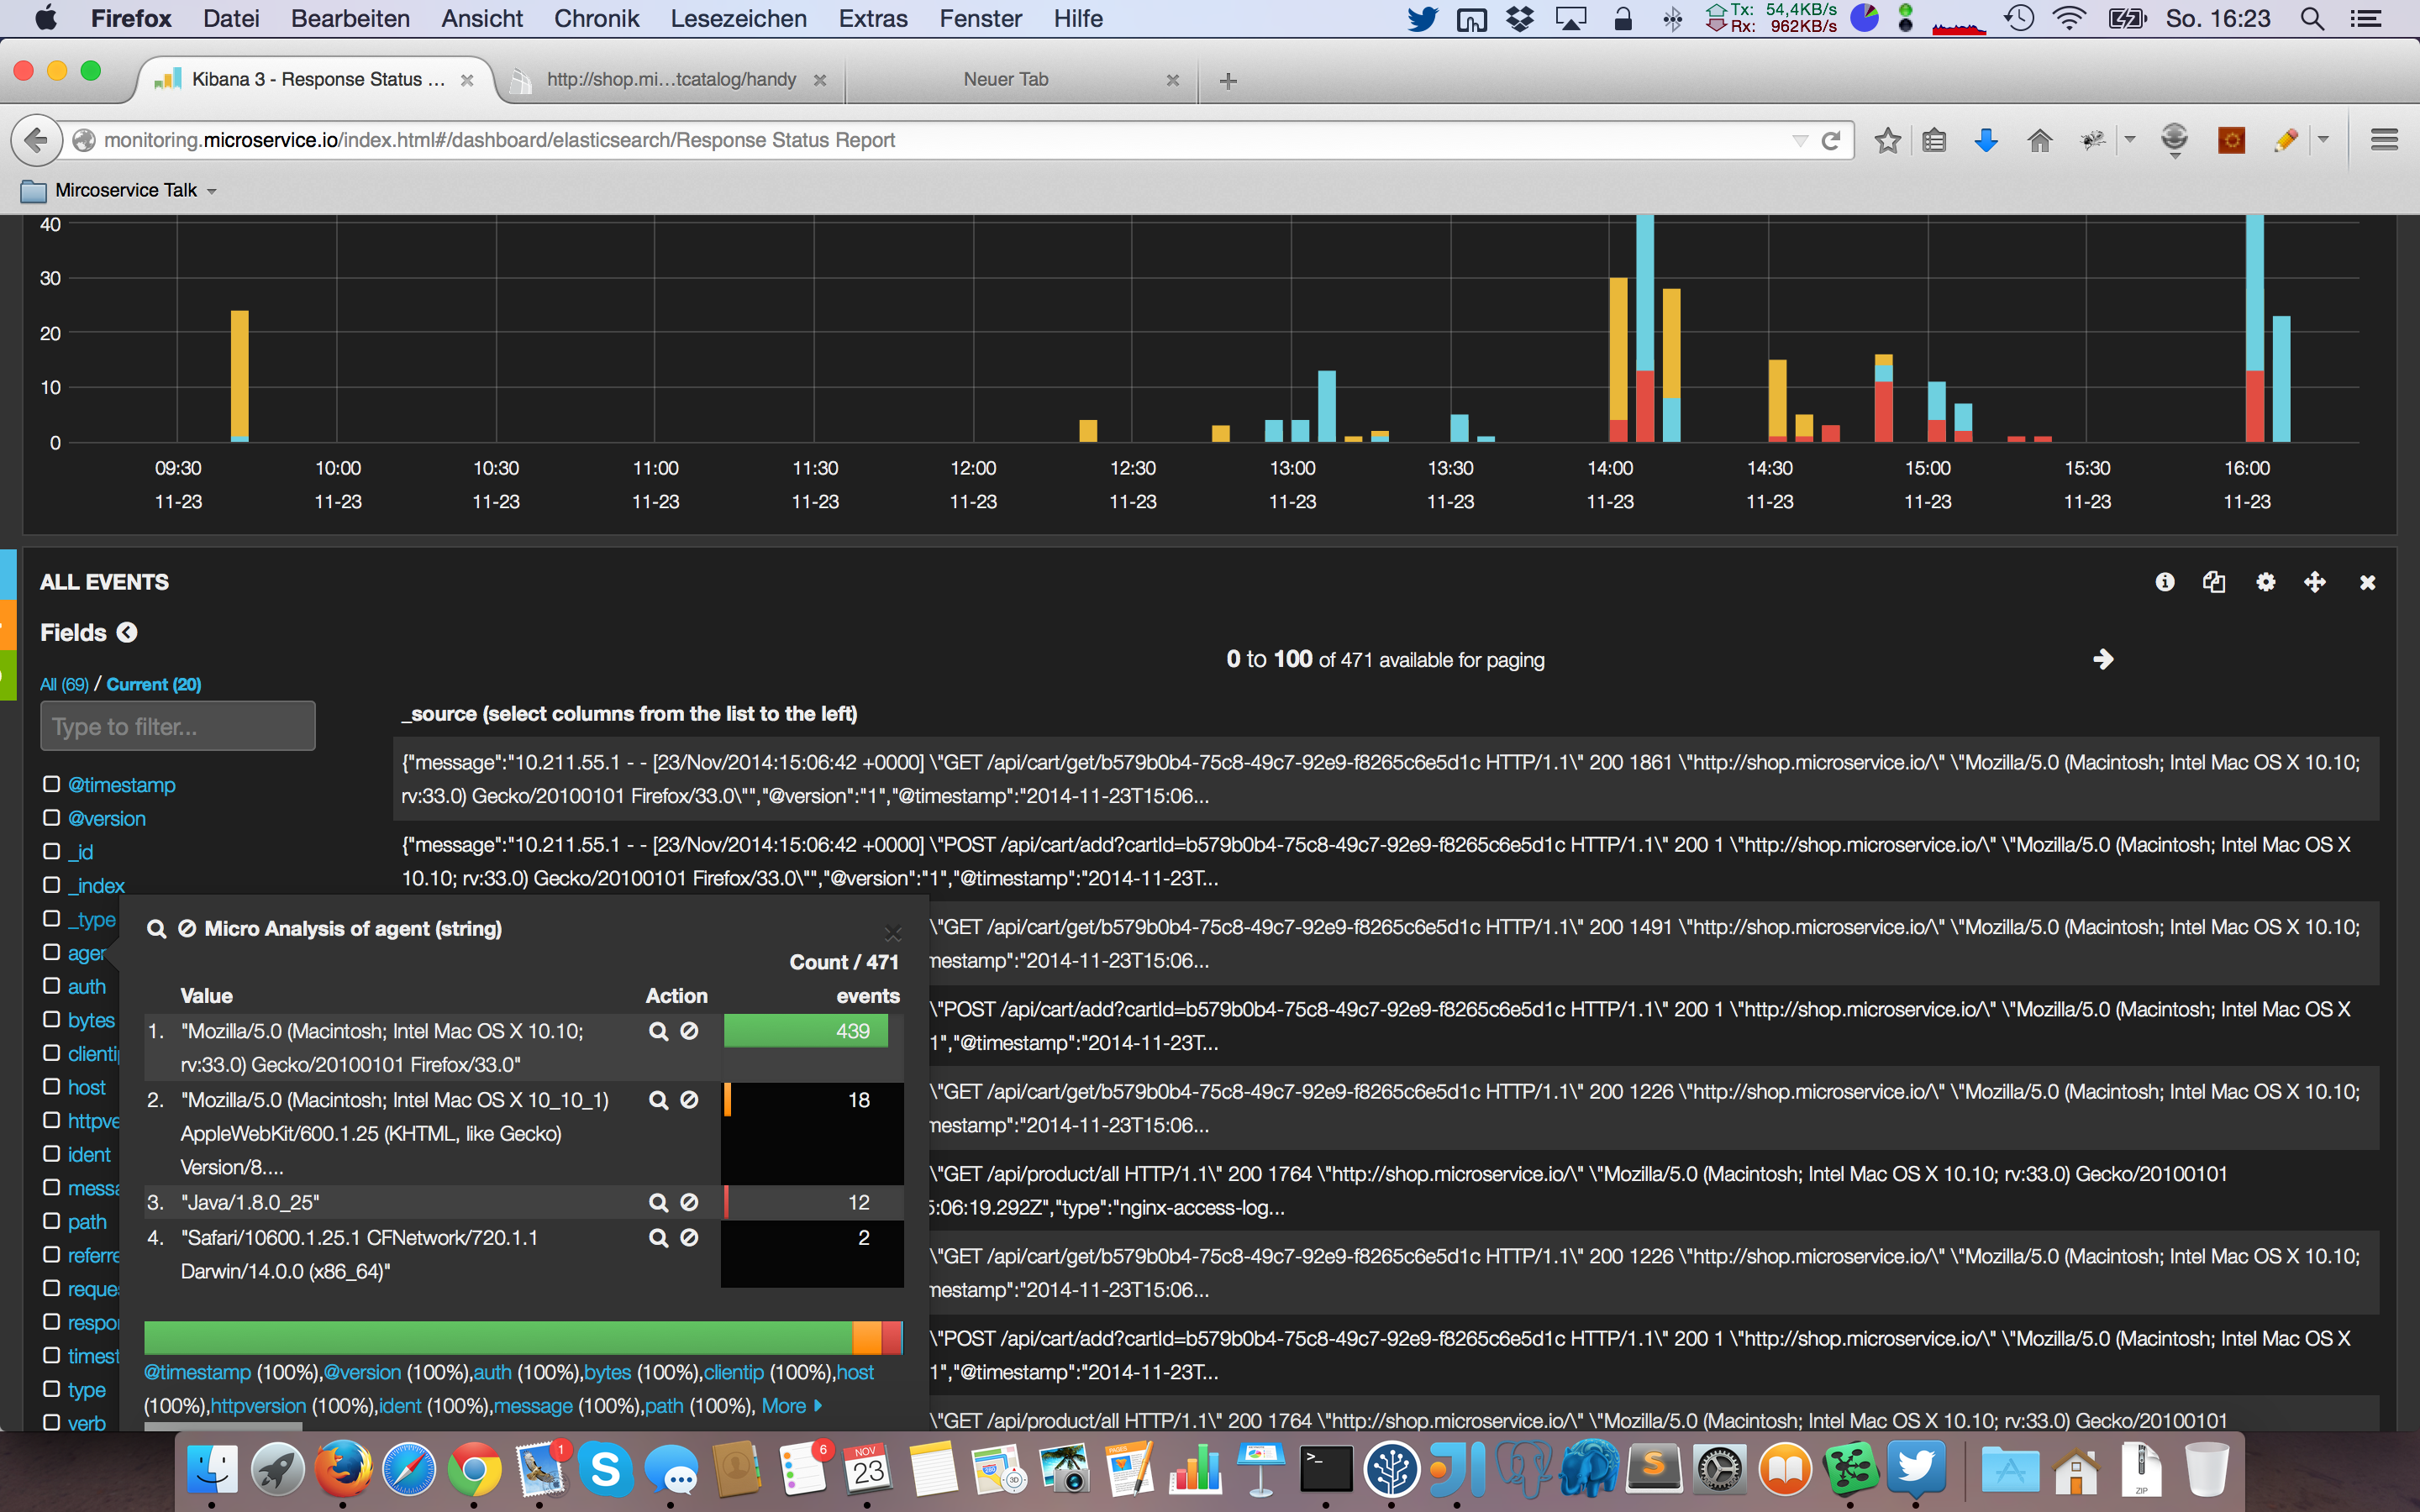
Kibana is a browser based analytics and search interface for Elasticsearch that was developed primarily to view Logstash event data. Logstash is a tool that can be used to collect, process and forward events and log messages. Collection is accomplished via number of configurable input plugins including raw socket/packet communication, file tailing and several message bus clients. Once an input plugin has collected data it can be processed by any number of filters which modify and annotate the event data. Finally events are routed to output plugins which can forward the events to a variety of external programs including Elasticsearch, local files and several message bus implementations.
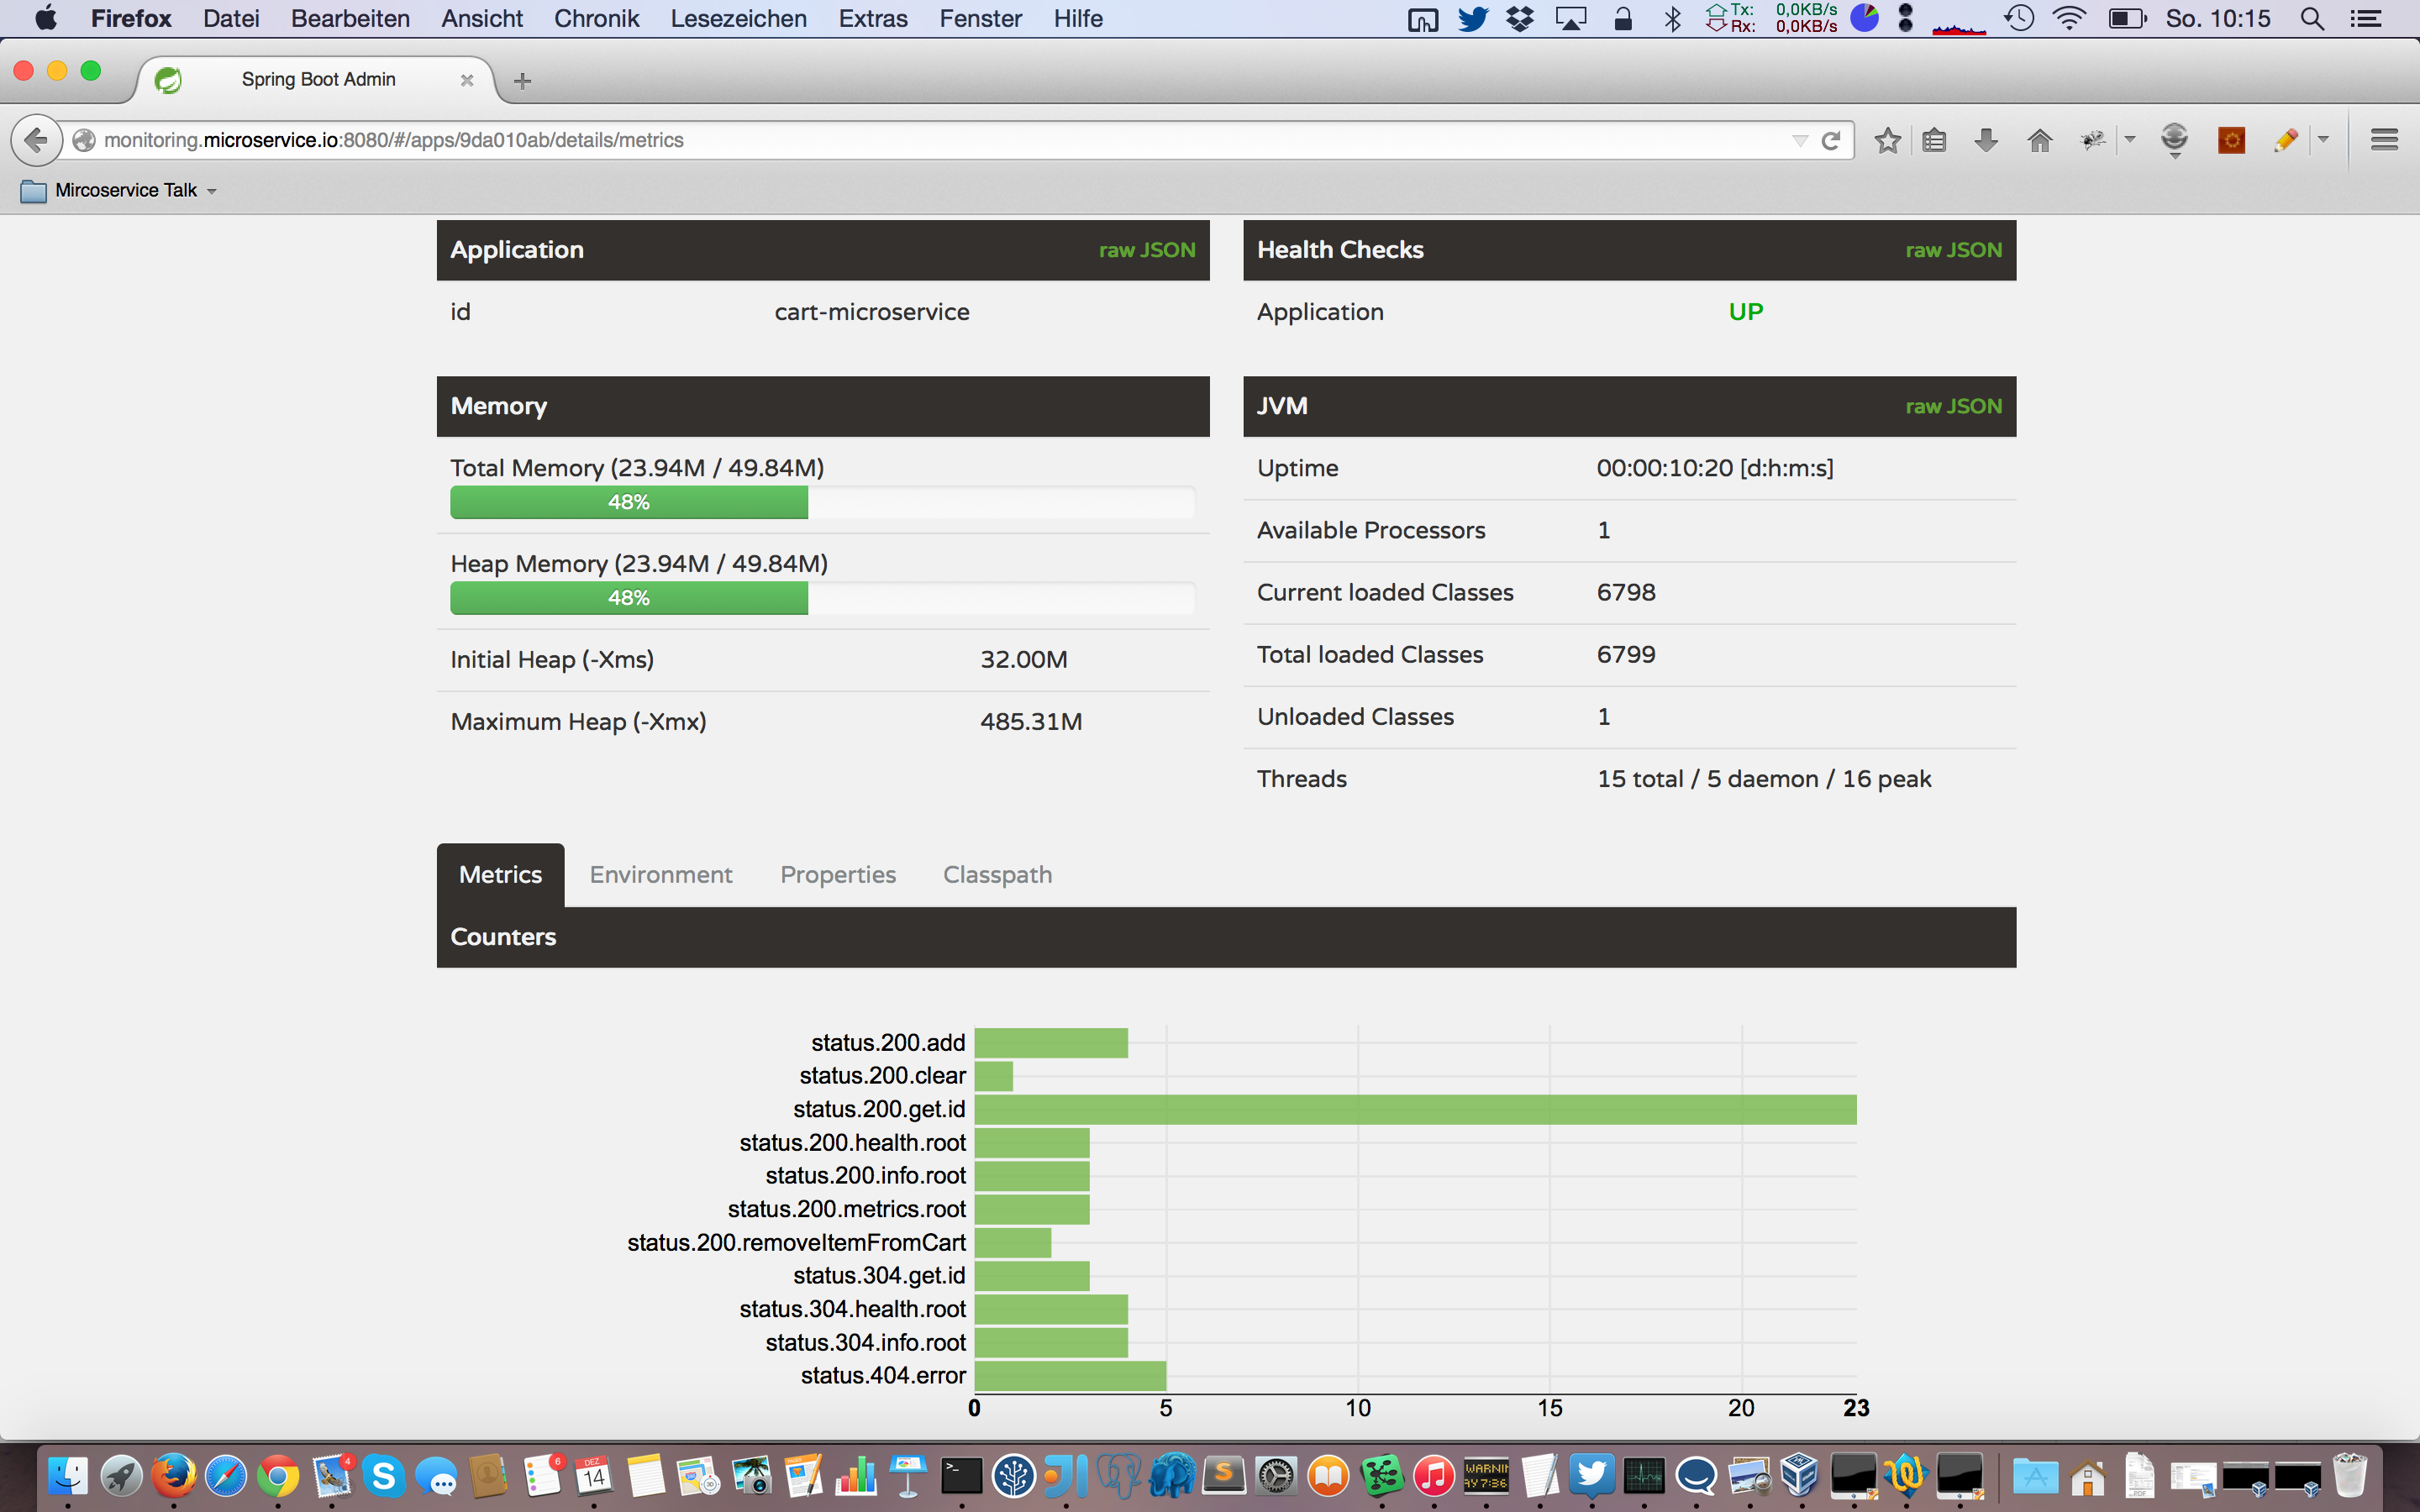
The Spring Boot Admin is a simple admin interface for Spring Boot applications.
This application provides a simple GUI to administrate Spring Boot applications in some ways. At the moment it provides the following features for every registered application.
- Show name/id and version number
- Show online status
- Download main logfile
- Show details, like
- Java system properties
- Java environment properties
- Memory metrics
- Spring environment properties
If you have any questions or remarks, please don't hesitate to contact me. For feature requests or general feedback, you can also use the issue tracker
This work is open source, and is licensed under the Apache License, Version 2.0.
