This project has been coded as a class project for CS595 taught by Dr. Xin Chen at the Illinois Institute of Technology.
Input: LIDAR point cloud data of a stretch of road
Output: road boundaries, lane markings, lane geometry
This project is developed in Python and requires the following packages:
- numpy
- sklearn
- mpl_toolkits
- matplotlib
The implemented method is divided in three steps:
- preprocess the data: remove points that are "useless" to find road boundaries.
- remove the remaining noise using clustering
- fit polynoms to describe the geometry of the road
The idea here is to reduce the amount of points in the point cloud (13 GB) to make it more easy to process.
To do so, points that are considered as useless to find the road boundaries are going to be removed.
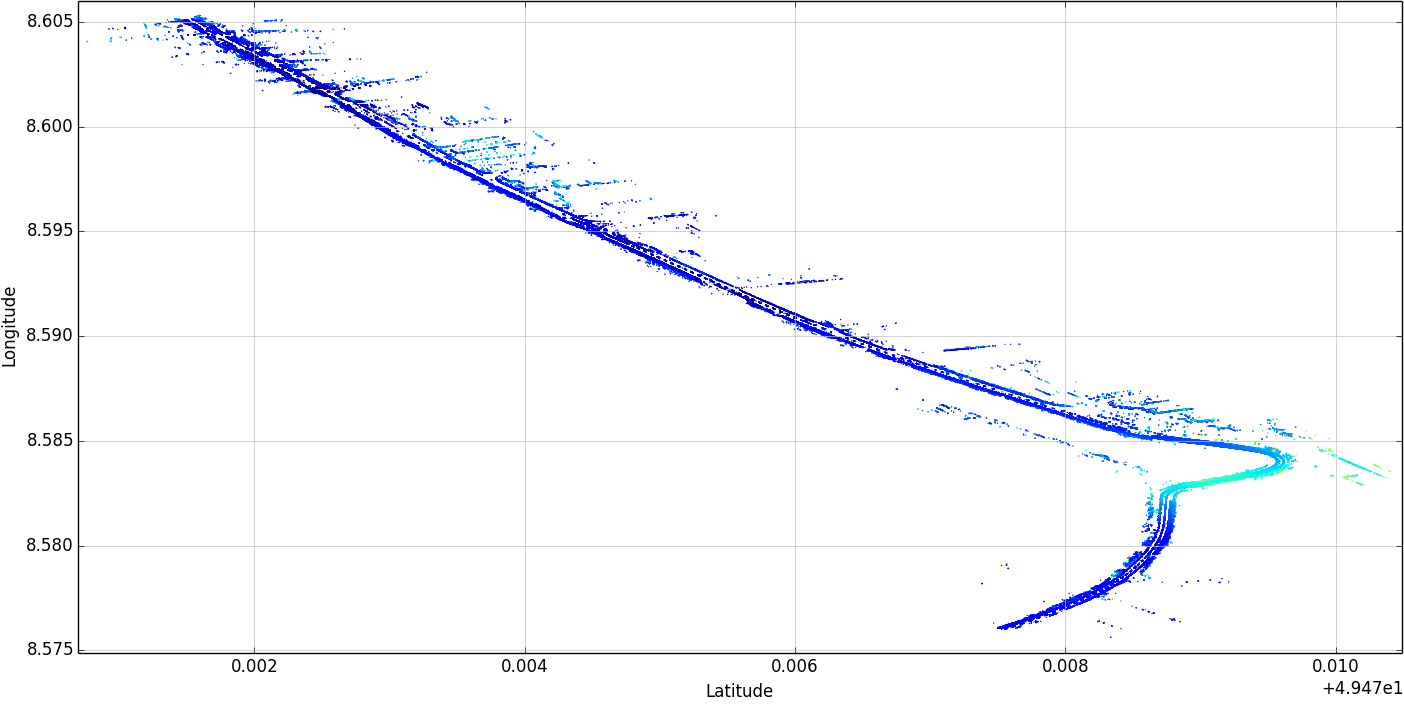
- Road boundaries are white reflective lines. Therefore, points that are describing a road boundary will have a high intensity value in the point cloud: this is the first filter to remove points. If a point has an intensity value less than a threshold T=180, then this point is removed from the point cloud.
- Road boundaries are also on the ground. Therefore, points that are 5 ft above or below the ground are not interesting. They probably describe buildings or other elements of the environment but are useless to detect the road boundaries. This is the second filter to remove points: we consider a subset of N points and only keep points that have an elevation between the 35th percentile and the 65th percentile for these N points. This allows us to have a dynamic threshold on elevation by processing the whole data by small chunks.
After preprocessing the 13 GB of data with these filters, the remaining data takes only 74 MB of storage: this is way easier to process!
In this step, the goal is to delete the noise that remains on the previous results to improve the process of line fitting.
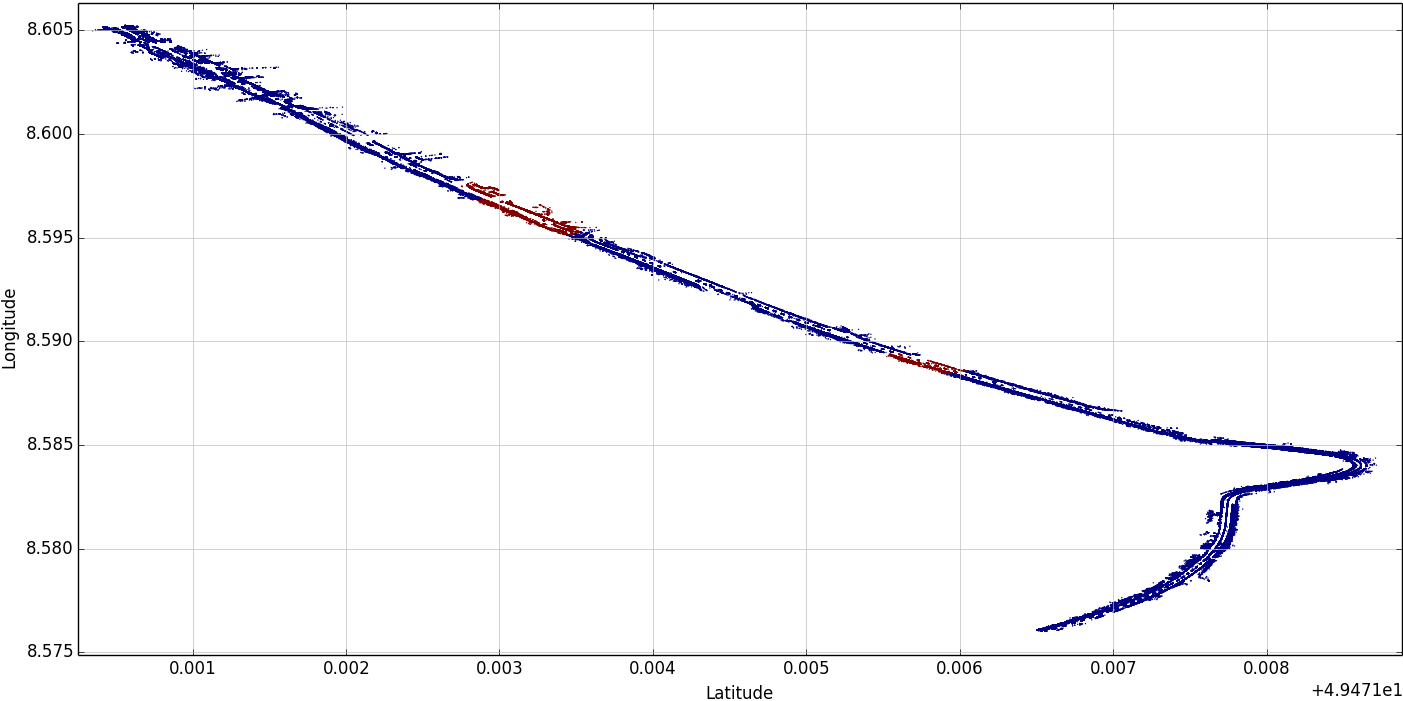
Using the scikit-learn toolkit, clustering is used to remove noise. The algorithm is the following:
- Divide the points in N subsets
- For each subset, keep the points as if they were in the plane latitude/longitude (i.e. remove the elevation) and run a clustering algorithm
- Keep the largest clusters
The scikit-learn toolkit several possibilities for clustering algorithms: choice amongst K-Means, Affinity Propagation, DBSCAN, Ward, and Mean Shift.
A right algorithm for our application must match with the following properties:
- it does not take the required number of clusters as an input.
- it scales well with a large amount of data.
These two criterions led to the use of DBSCAN as the clustering algorithm.
After noise removal, the data size is down to 36 MB.
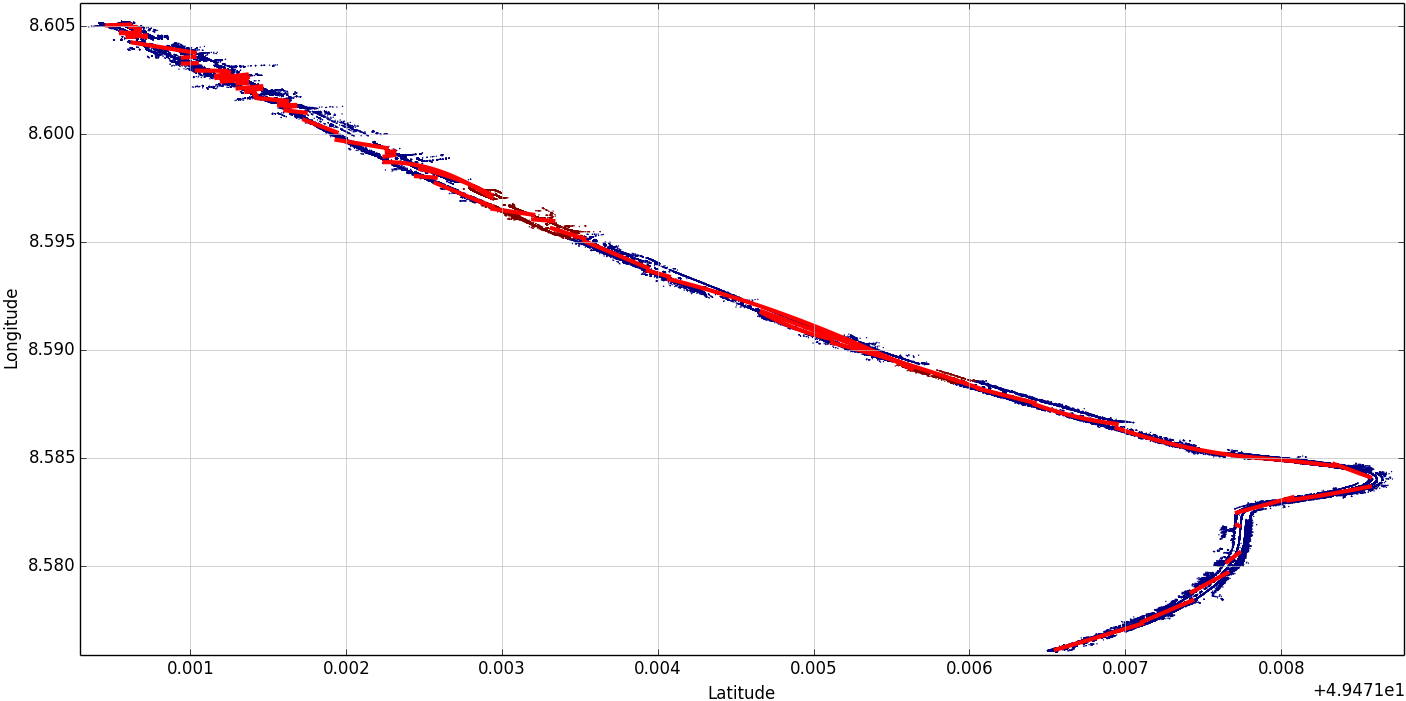
This last step aims to find a piece-wise polynom that fit the curve of the road. The method is the following:
- Divide the points in N subsets.
- For each subset, fit the points with a third degree polynom with np.polyfit.
- Display the polynoms over the point cloud.
The main part of this project is to make the data easier to fit with polynoms by preprocessing it and removing the noise.
Even if the road boundaries are not detected in this implementation, the data preprocessing is effective when using DBSCAN clustering to remove noise and it is possible to describe the curve of the road using polynoms.
This project could be improved by sampling the point cloud into an image and apply Hough line fitting to detect the road boundaries and road lane markings.


