This repo contains a series of usable functions to plot and visualize geological and hydrogeological datasets.
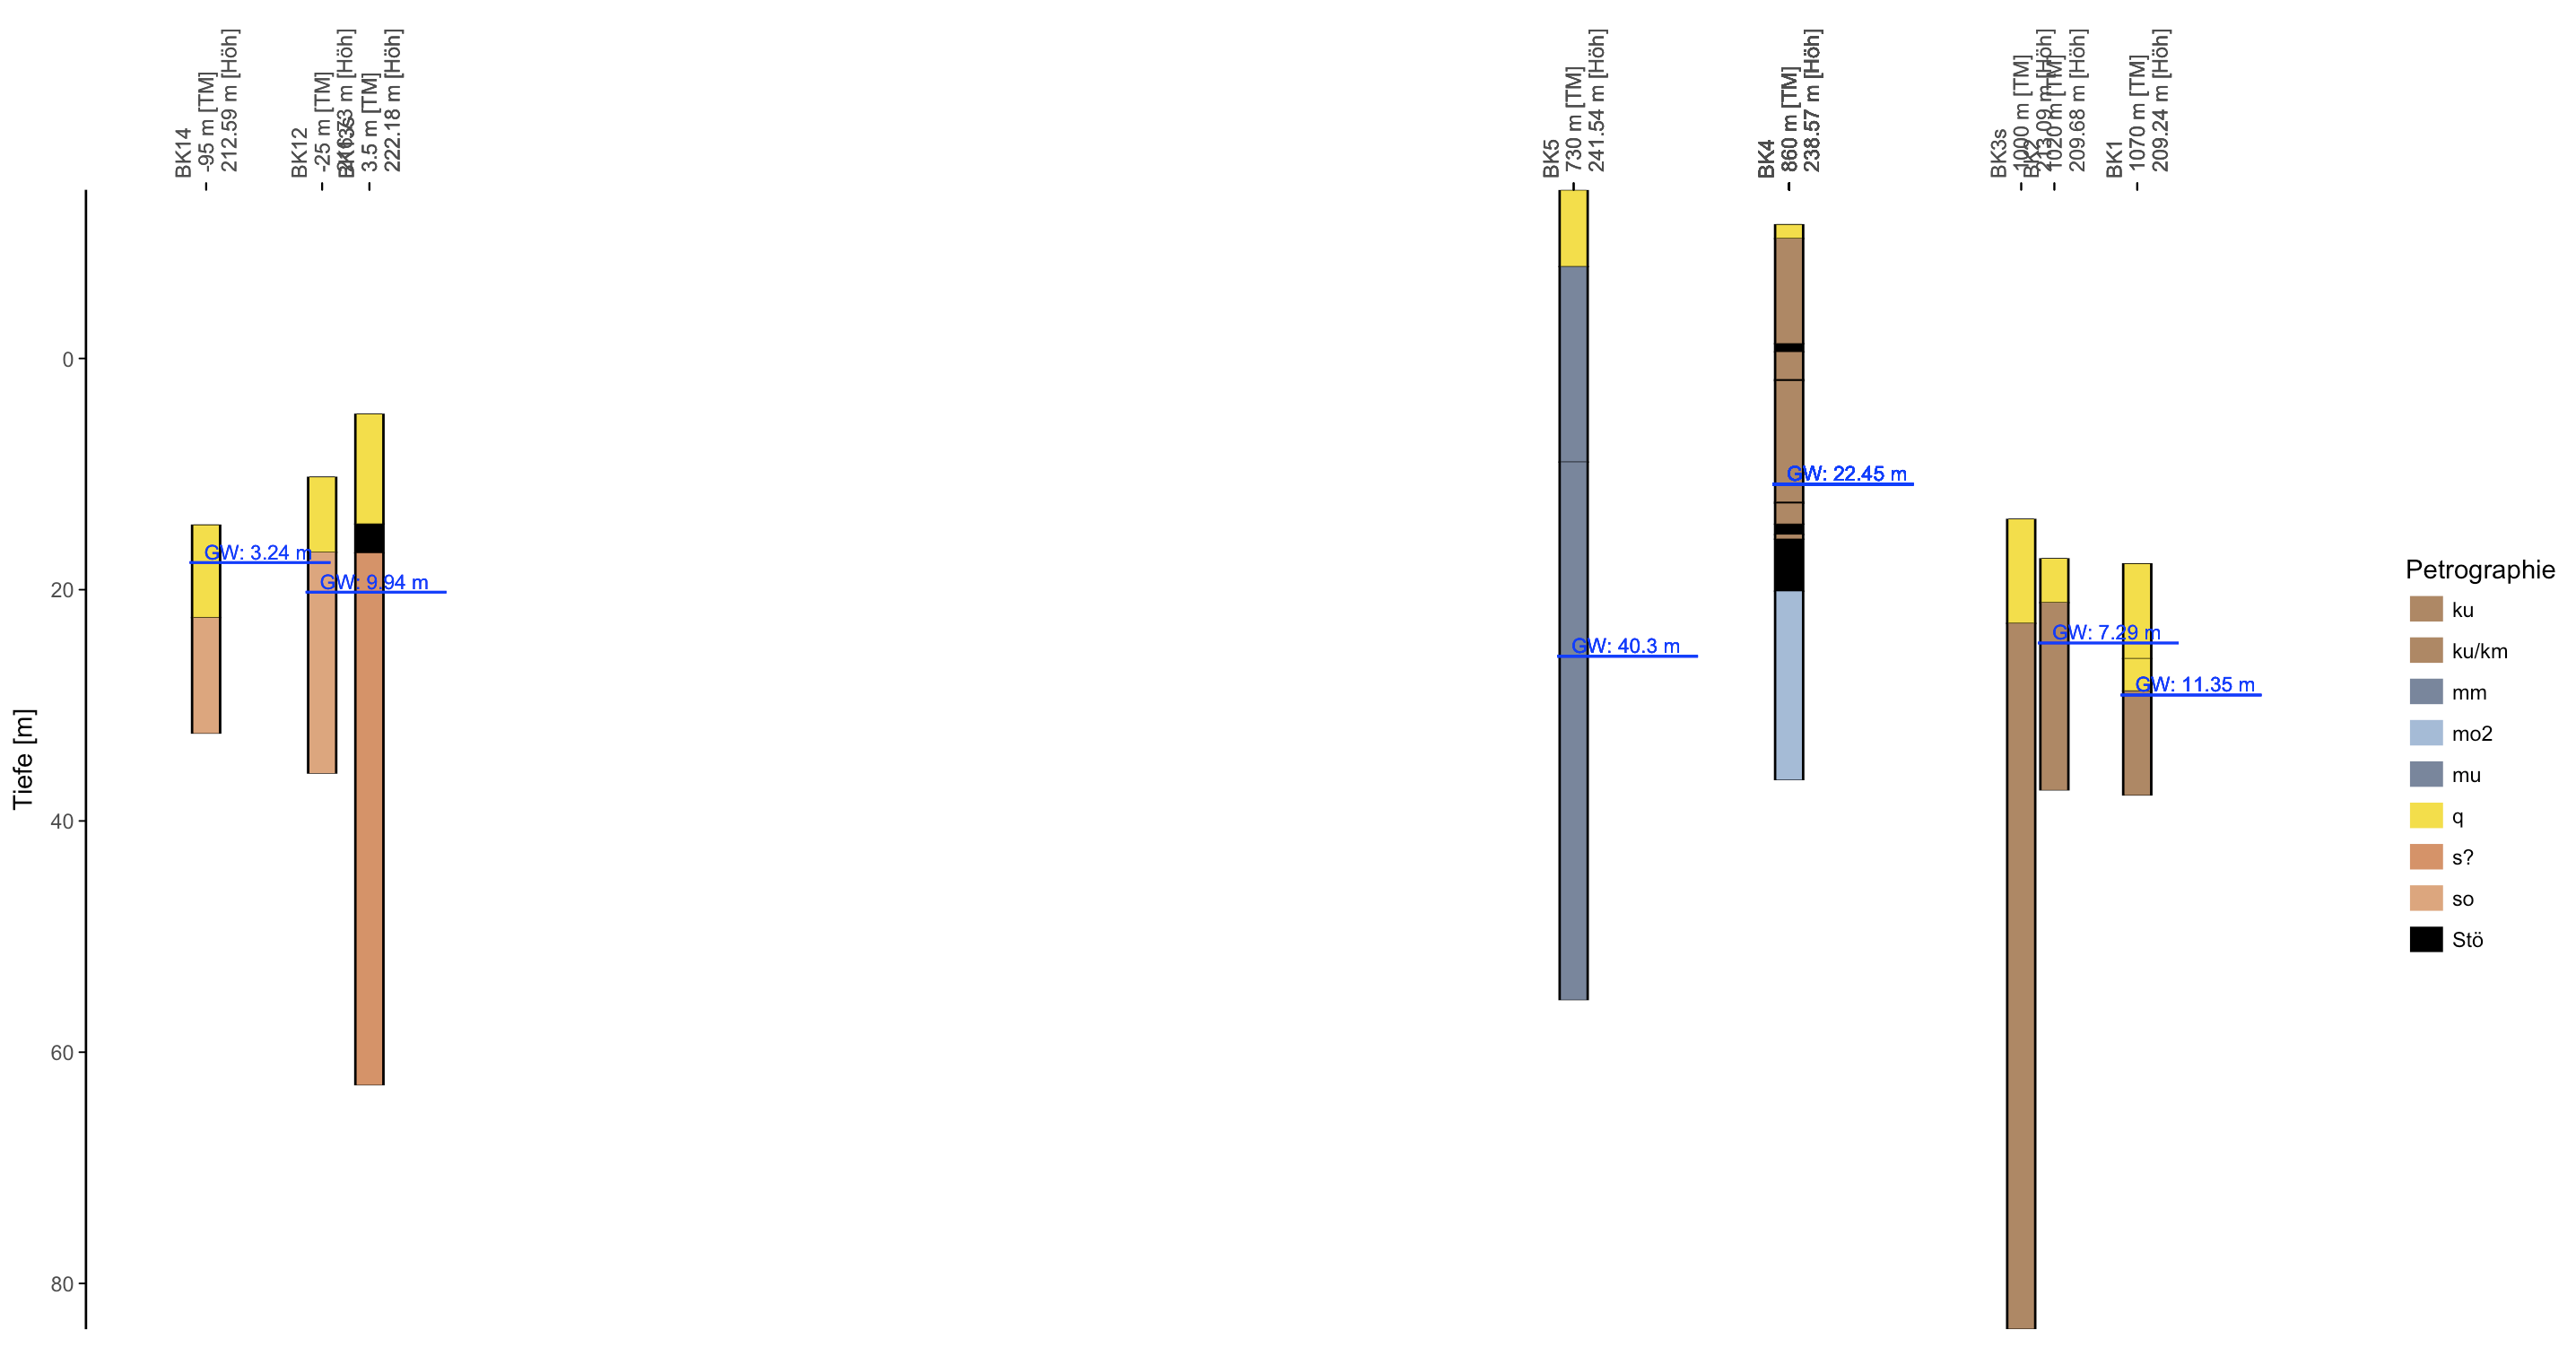
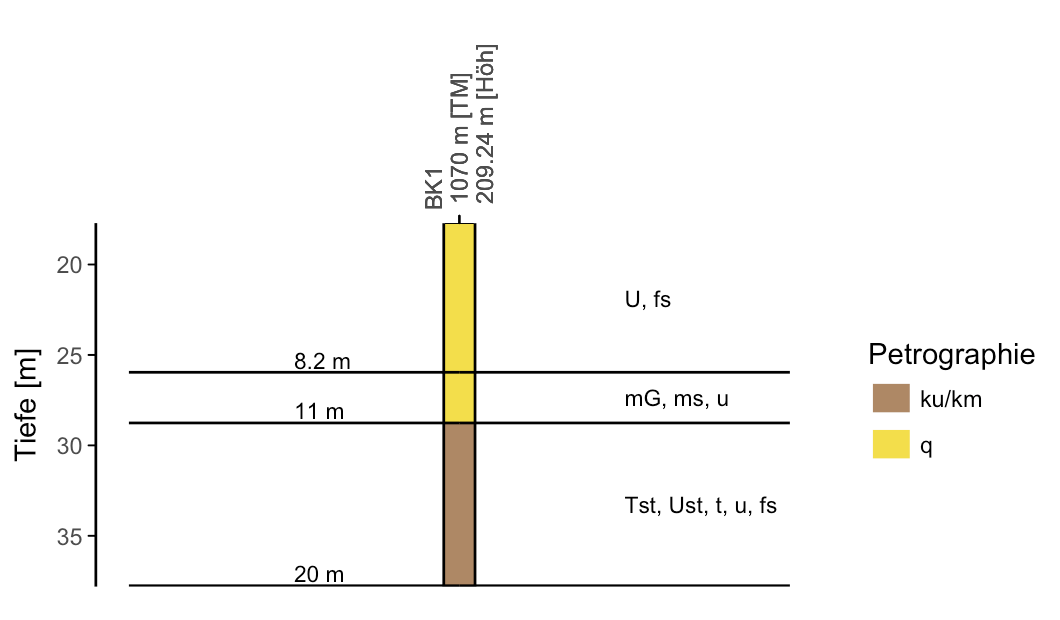
To create geotechnical profiles (crosssections) run the function create_profile(). The function reads in borehole data which has to be stored in a specific formatted excel table. An Example can be found here: Excel Example File.
- Create Only 1 borehole profile
- Create A series / crosssection of borehole-plots with corrected X (e.g. meter from beginning of tunnel) and Z values (Offset from surface)
- Annotate drilling plots with explorated geology
- Add detected groundwater tables
- Add consistency of explorated geological layers
- Add in situ density of explorated geological layers
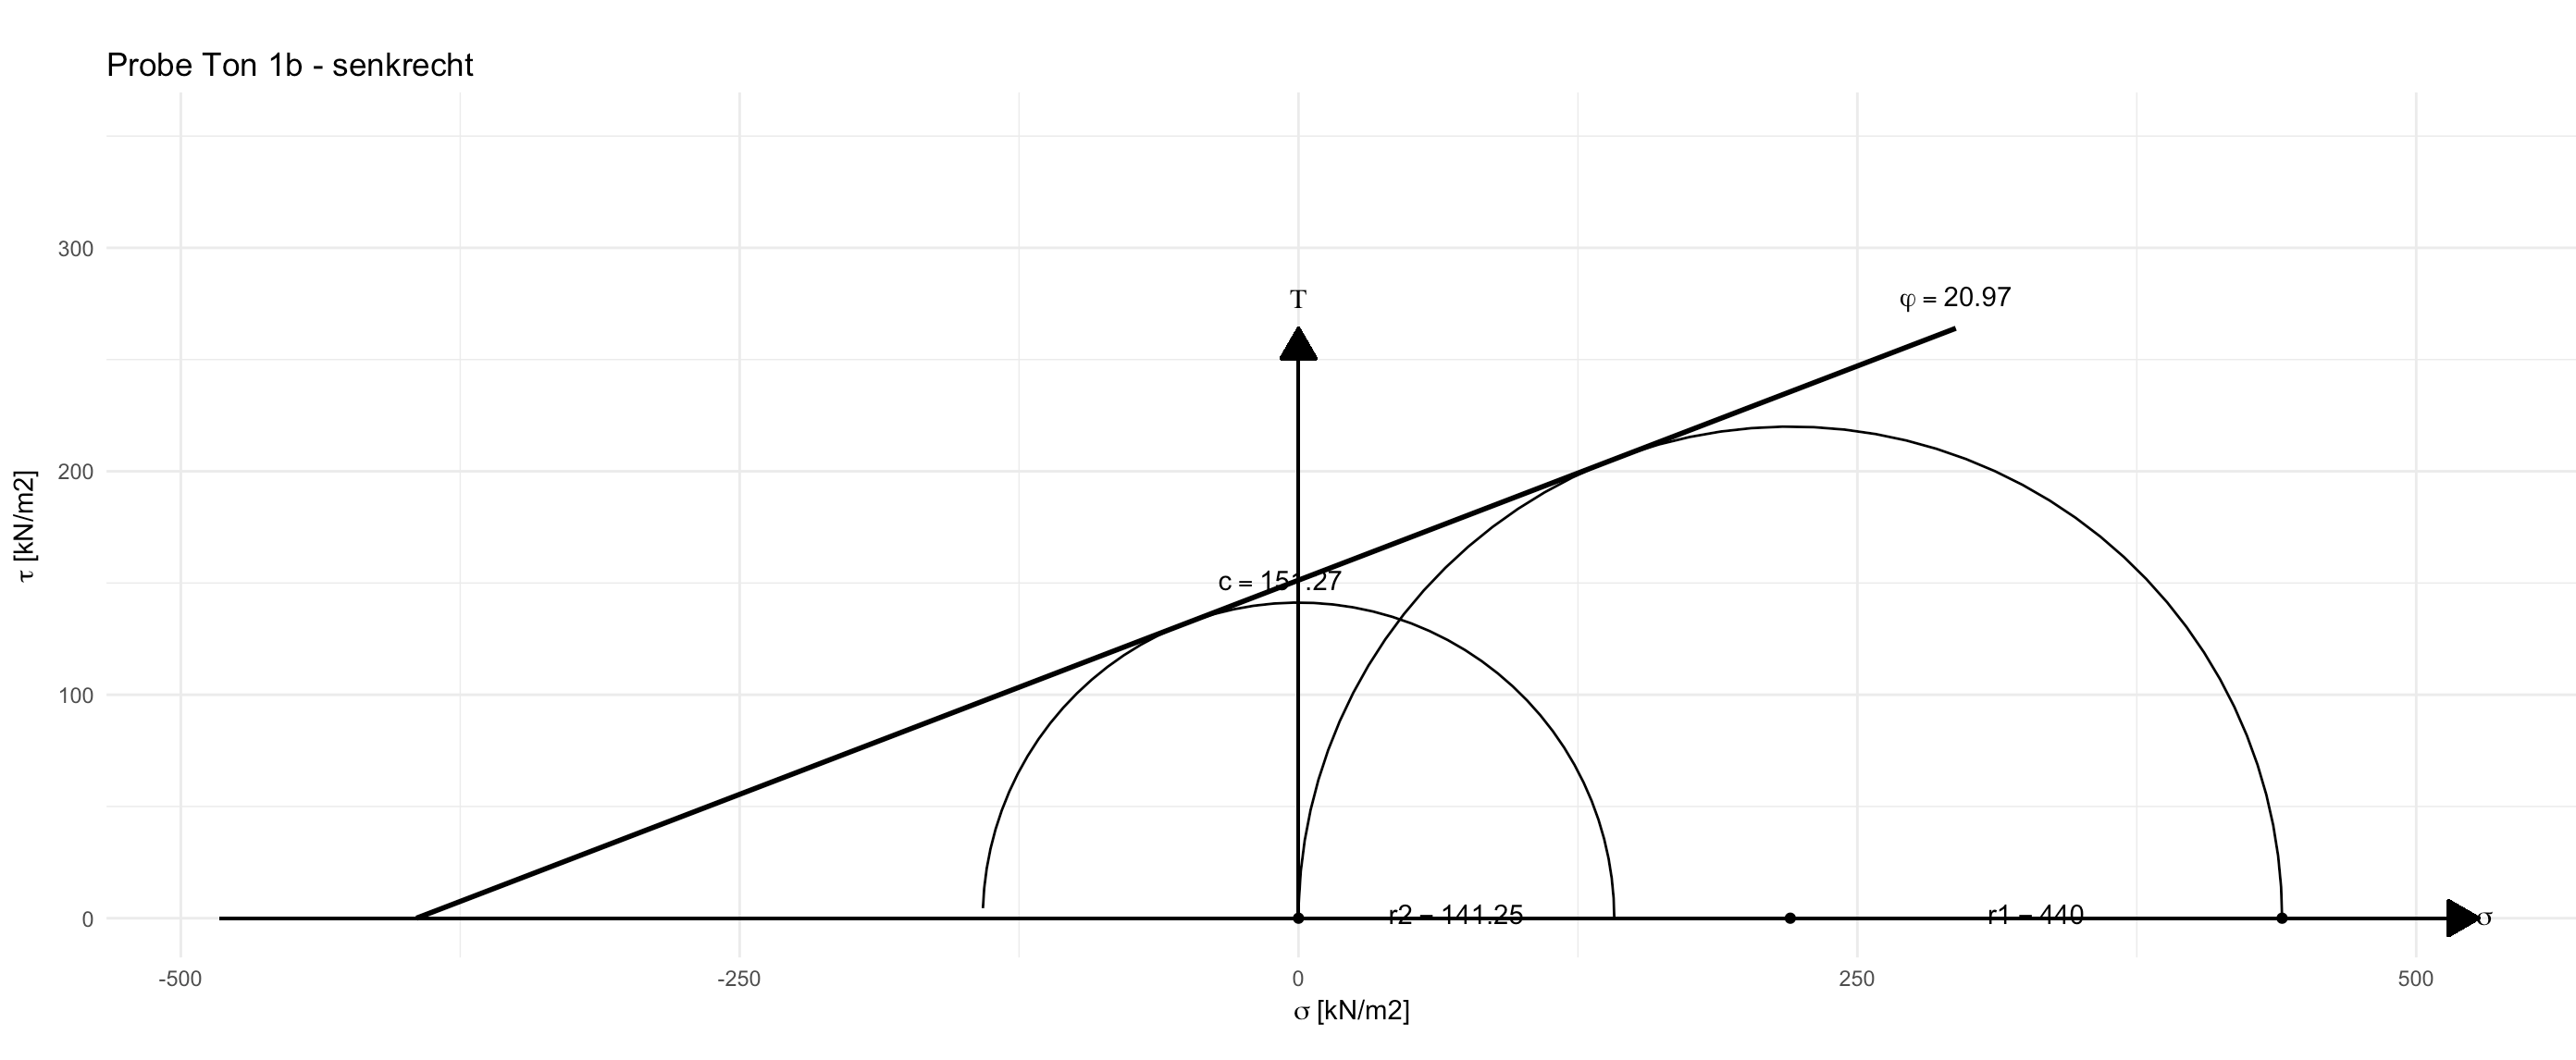
Run following Code to display a nice Mohr-Coulumb Plot:
# Input data for sand:

kN_penetrometer_1b_parallel <- mean(c(325,360,250,450,375))
kN_penetrometer_1b_perpendicular <- mean(c(250,450,440,425,400))

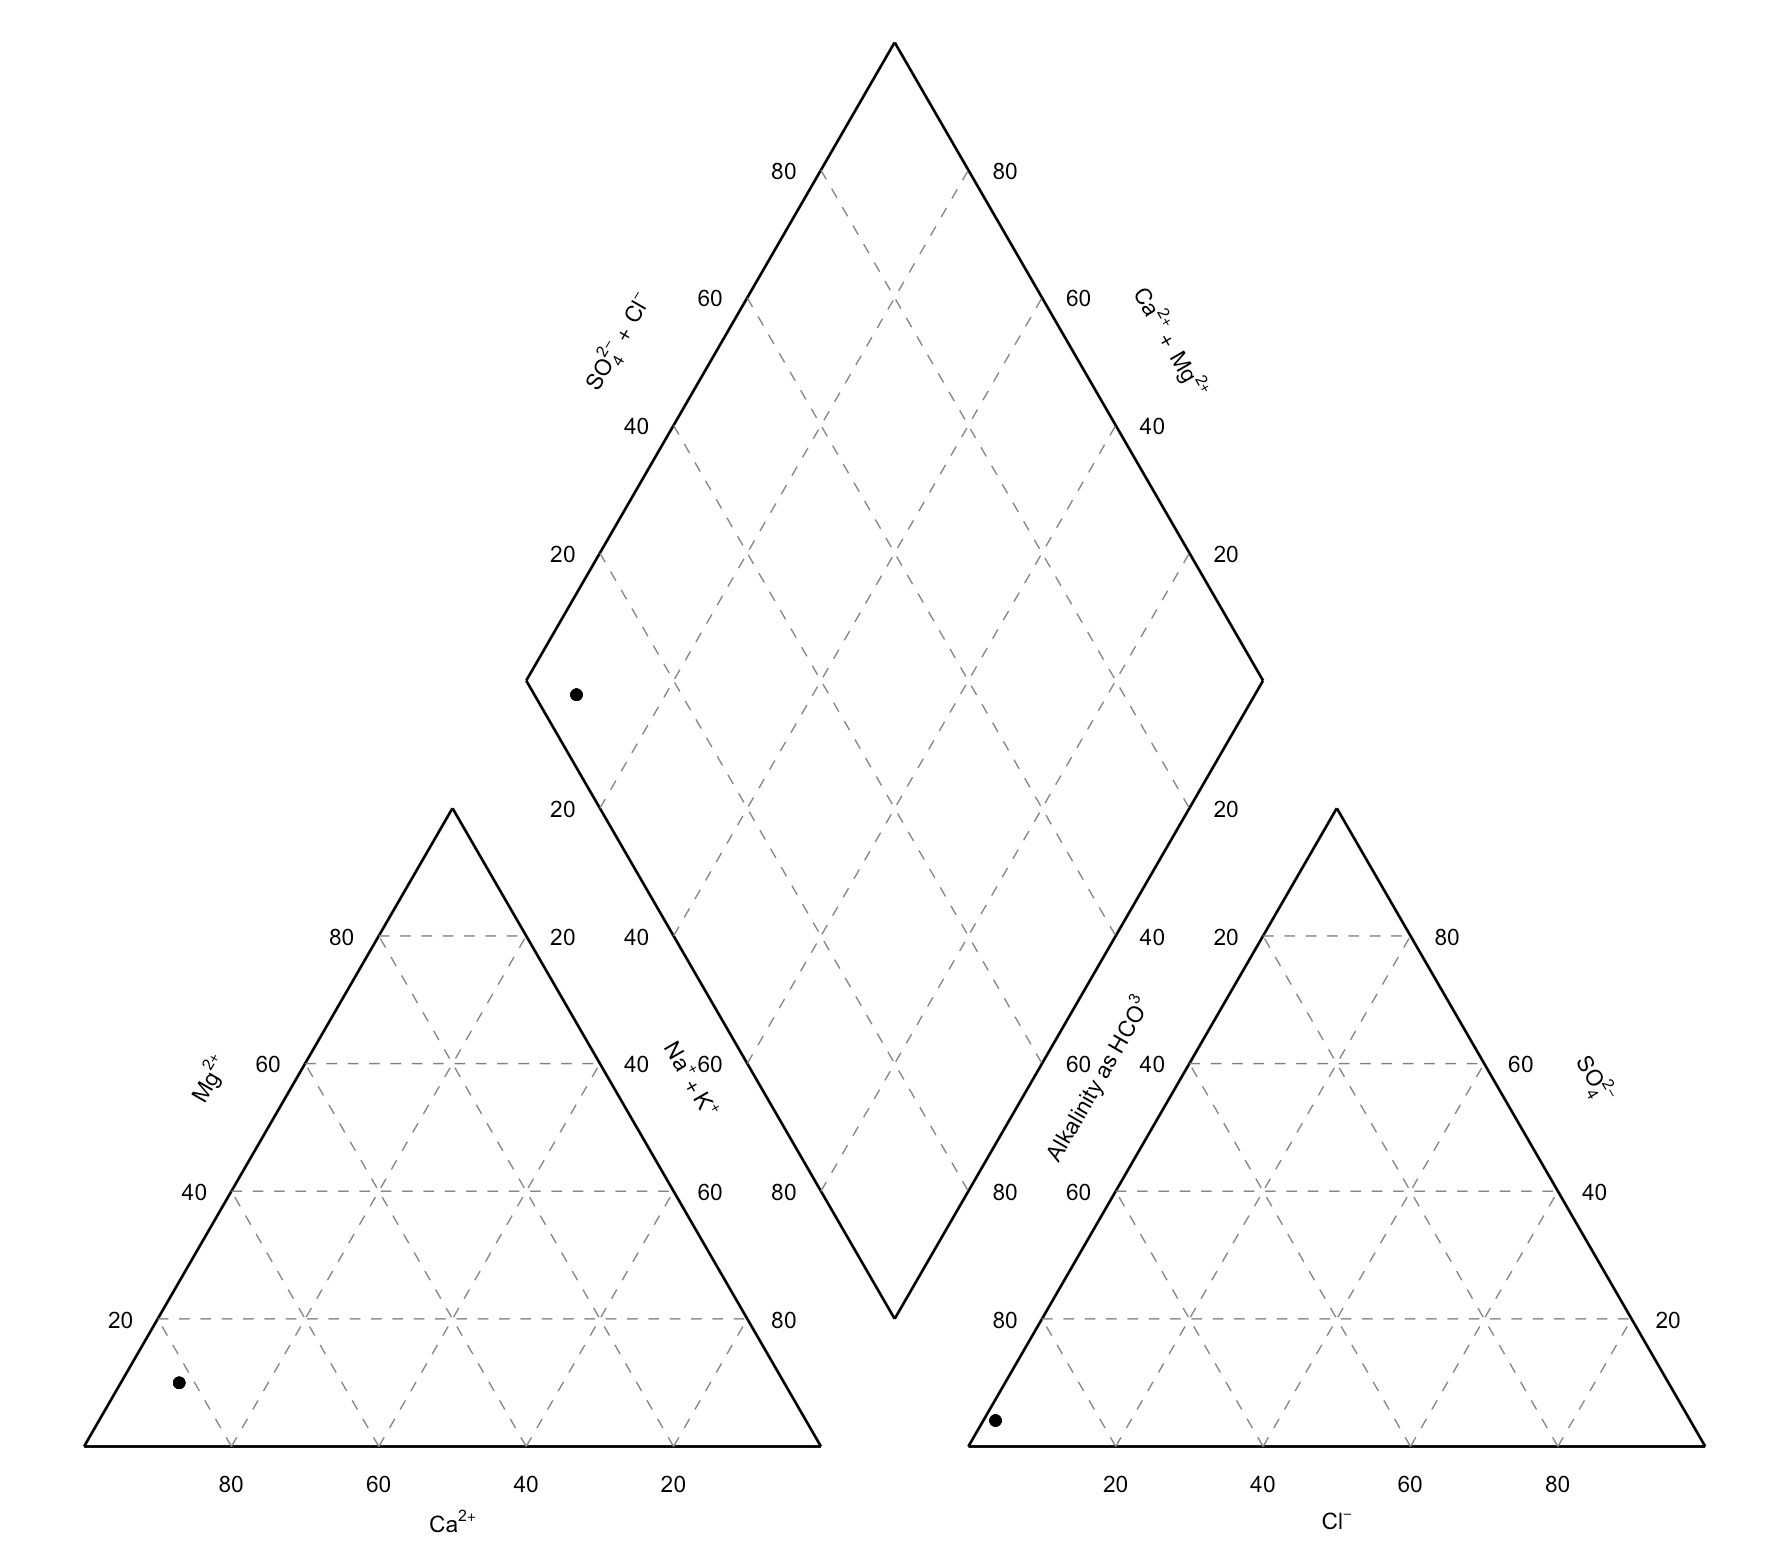
plot <- mohrAuswertung(shear = kN_shear_1b_parallel, penetrometer = kN_penetrometer_1b_parallel, title='Probe Sand 1b - parallel')Run following Code to display a black and white Piper-Plot:
createPiperPlot.R


