Migration Profiles
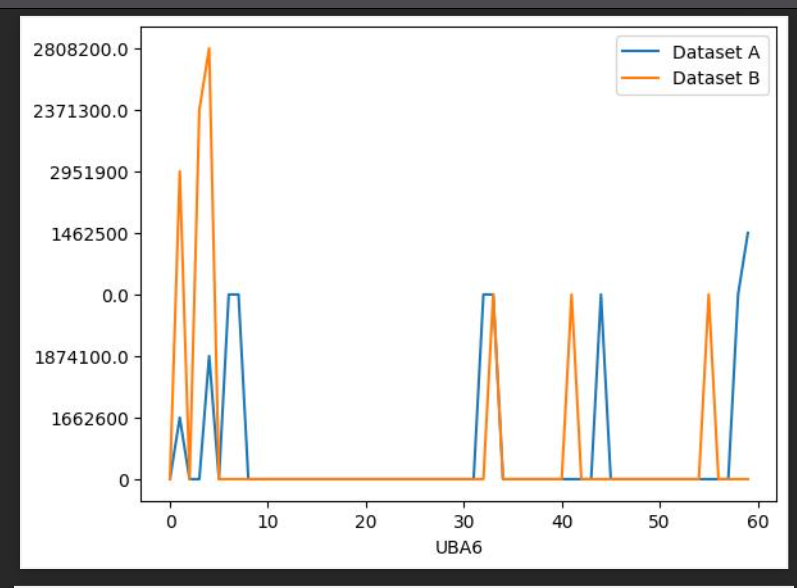
This python script generates migration profiles based on protein abundance distribution.
It will generate:
-
Figures as png
-
CSV Data with the abundance information

protein,max_index_a,max_index_b,difference,filename
LINC00493,22,11,11,./figures/LINC00493.png
PIGBOS1,0,0,0,./figures/PIGBOS1.png
- All images into a pdf report
Prerequisite
- Python3
- Pip3
Installation
- Clone this repository by using
git clone <repository url>in the terminal - Change into the directory by executing
cd <repo_dir> - Install the dependencies by executing
pip install -r requirements.txt
Usage
Please delete files in the /figures and /output folder if you have used this script earlier.
- Replace the protein data in the data folder
data/dataset_a.csvdata/dataset_b.csv
- In the terminal execute
python main.py - The results are written into
output/result.csvoutput/report.pdffigures/