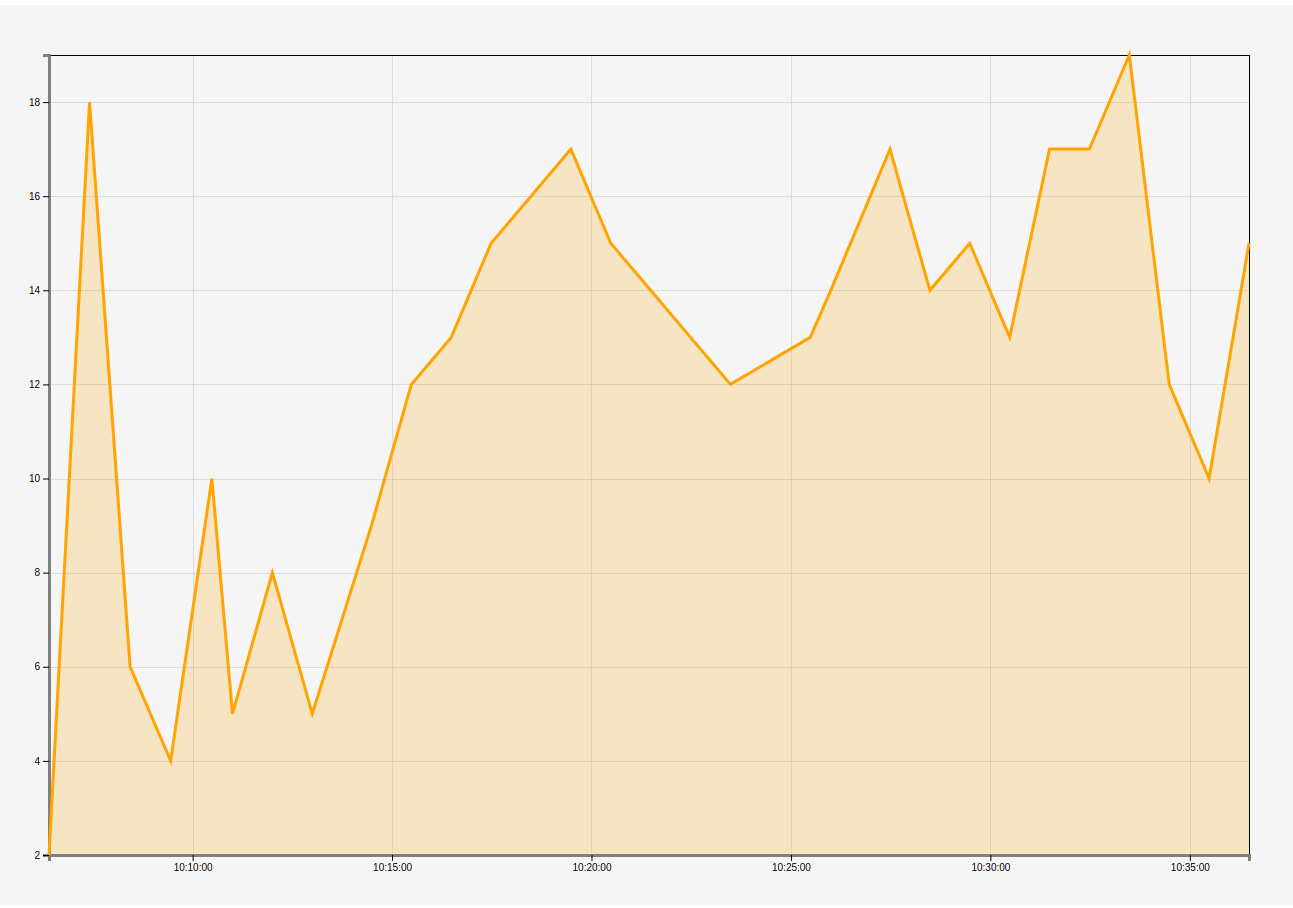
charts for finviz project


demo
const config = {
    height: /* in px */,
    width: /* in px */,
    margin: /* in px */,
    curve: /* eg. curveBasis default: urveCardinal */,
    resizeTime: /* resize animation time default: 0 */
};const data = [
{x: '10:6:24', y: 2},
{x: '10:7:25', y: 18},
{x: '10:8:26', y: 6},
{x: '10:9:27', y: 4},
{x: '10:10:29', y: 10},
{x: '10:11:00', y: 5},
{x: '10:12:00', y: 8},
{x: '10:13:00', y: 5},
{x: '10:14:29', y: 9},
{x: '10:15:29', y: 12},
{x: '10:16:29', y: 13},
{x: '10:17:29', y: 15},
{x: '10:19:29', y: 17},
{x: '10:20:29', y: 15},
{x: '10:21:29', y: 14},
{x: '10:22:29', y: 13},
{x: '10:23:29', y: 12},
{x: '10:25:29', y: 13},
{x: '10:26:00', y: 14},
{x: '10:27:29', y: 17},
{x: '10:28:29', y: 14},
{x: '10:29:29', y: 15},
{x: '10:30:29', y: 13},
{x: '10:31:29', y: 17},
{x: '10:32:29', y: 17},
{x: '10:33:29', y: 19},
{x: '10:34:29', y: 12},
{x: '10:35:29', y: 10},
{x: '10:36:29', y: 15},
];
new ChartClass('mount_element',config)
.initChart()
.provideData(normalizeData(data))
.drawChart();
chartObj.resize(width,height);
- AreaEffect
- DataPointEffect
- mouseTrackingEffect
chart.effects.add('mousetracking', new MouseTrackingEffect({/*config */}), true);