Spaceport is used to run Hercules and its infrastructure on a single host for development purposes.
Hercules is a system for reliable delivery of telemetry events from microservices to storage and analytics engines. Spaceport contains Hercules components and infrastructural services which are configured to work with each other out-of-the-box.
Hercules contributors can also use Spaceport to fix bugs or develop new Hercules components.
Gate is an entrance of Hercules for telemetry events. Gate has http API.
There are several event types which are used for handling in Spaceport: logs, metrics and traces.
-
Hercules delivers log events to Elasticsearch - search engine for collecting and storing logs. You can see these log events in web application Kibana.
-
Hercules delivers metric events to Graphite - metrics collection and analysis system. These metric events are visualized in web interface Grafana.
-
Hercules collects trace events to DB. Cassandra is used as trace DB in Spaceport. Hercules contains Tracing API for reading traces. It is http API which returns traces as json. Spaceport contains web application Contrails for traces visualizing.
You can tune Hercules using Management API (http API).
Docker (and docker-compose) are prerequisites. Check that you have them in your PATH:
$ docker --version
Docker version 20.10.0, build 7287ab3

$ docker-compose --version
docker-compose version 1.27.4, build 40524192
Go to the directory where the Spaceport project will be located.
Clone this repository:
$ git clone https://github.com/vostok/spaceport.git
Go to the root directory of Spaceport project.
You can use utility make to run Spaceport. Run the command make to download and run all necessary containers. Wait for the command to complete.
The full launch of the services may take another minute.
Beware. You won't be able to run Spaceport on a very old or weak machine. Mid-2014 MacBook Pro with 8GB RAM shows acceptable performance.
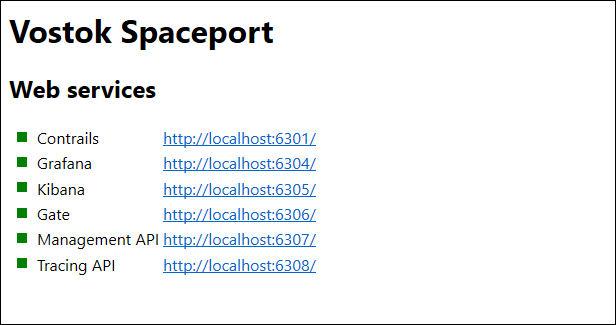
Go to localhost:6300 to check if all components are up and running. The indicators in front of the component names should be green.
Other commands are also available:
make downwill stop and remove all containersmake pullwill pull latest versions of containers and overwrite your changes to containers
If you don't have utility make, look inside the Makefile for commands.
Spaceport provides several end-user applications.
- Grafana at localhost:6304 to explore and plot metrics
- Kibana at localhost:6305 to explore logs
- Management API at localhost:6307 to manage Hercules
- Tracing API at localhost:6308 to see traces as json
- Contrails at localhost:6301 to visualize traces
You can test Spaceport work. Go to root directory of Spaceport project and run test script:
$ sh test.sh
Test script will send one test log event, one test metric event and one test trace event to Hercules. See below how to check if the Spaceport is working properly.
Go to Kibana to see test log event: localhost:6305.
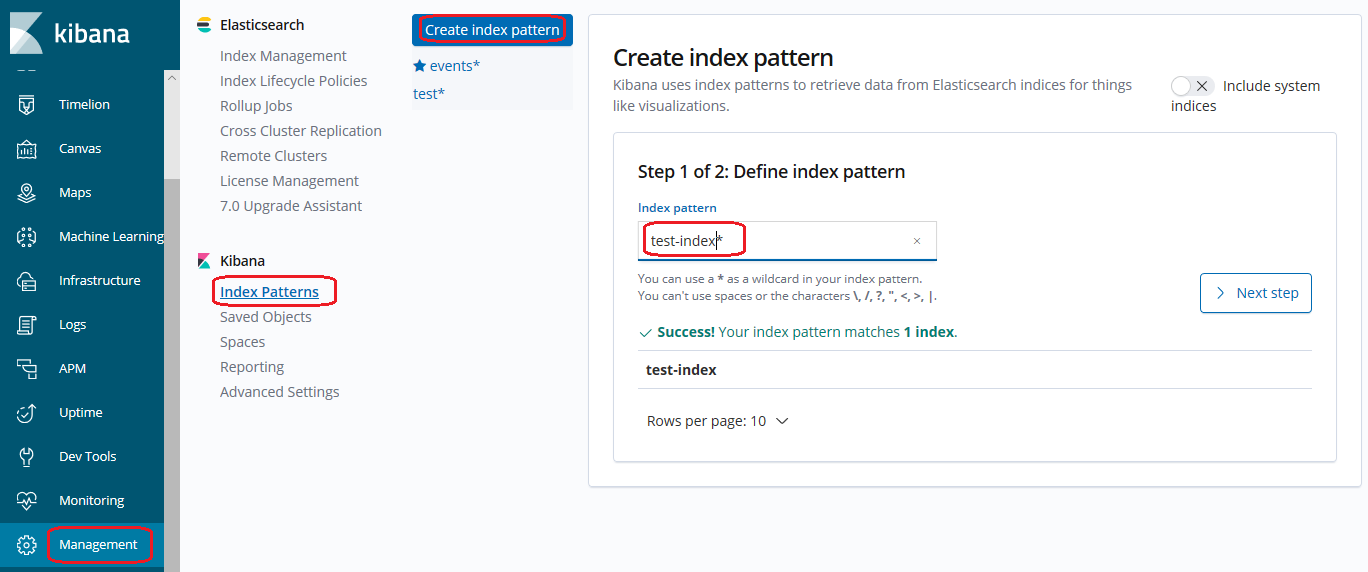
Create index-pattern if you are for first time in Kibana: go to Management menu, then click Index Patterns and Create index pattern.
Enter test-index* and click Next step.
Select @timestamp as timer filter field on the next step and click Create index pattern.
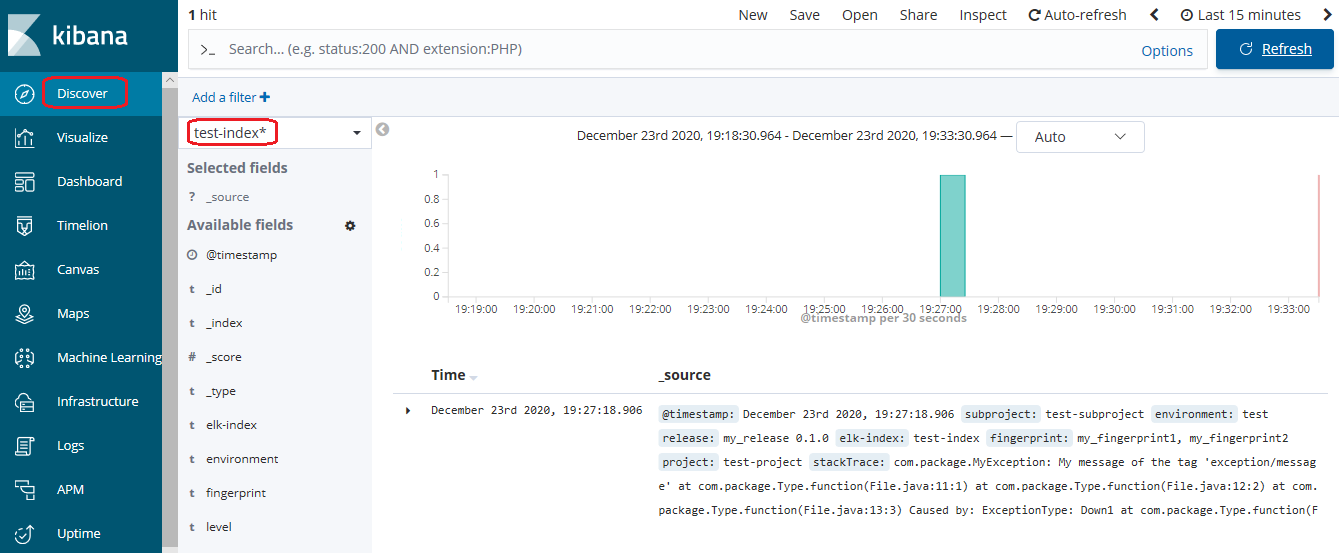
Go to Discover menu, then select index pattern: test-index*.
If successful, you will see the timing diagram and log event information below. You can change displayed time period in the upper right corner of the window.
Go to Grafana to see test metric event: localhost:6304.
Grafana will ask for login and password if you are for first time in Grafana. Entry login: admin, password: admin.
Then Grafana will ask you to set new password. Entry new or old password.
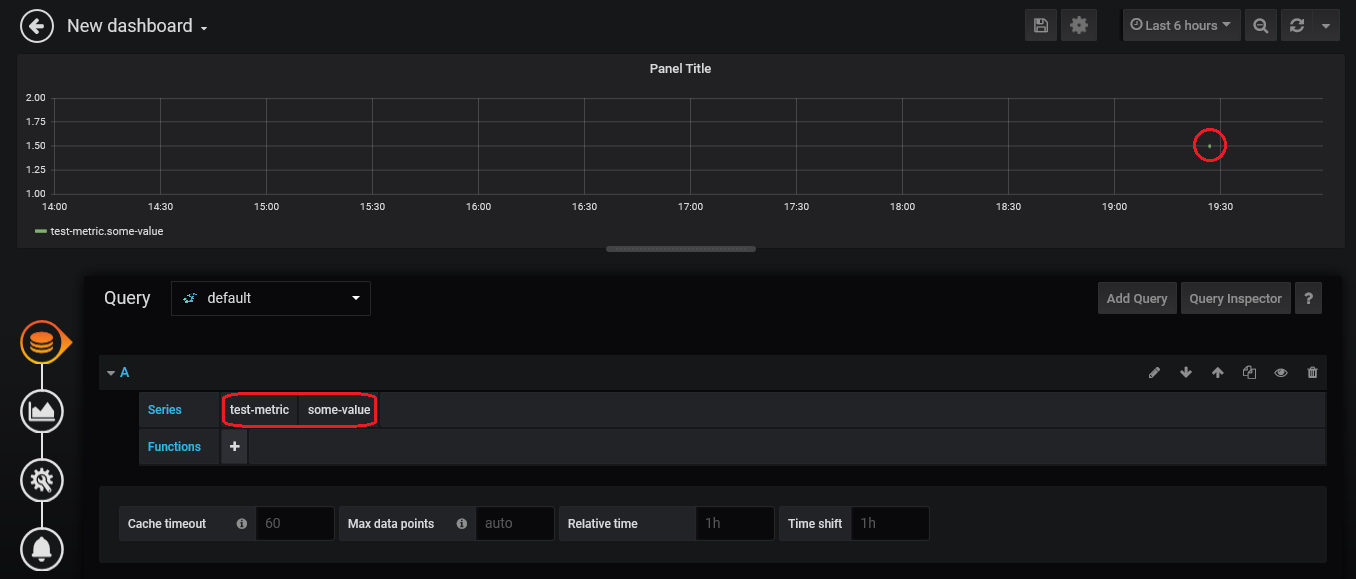
Click New dashboard on new window. Click Add query on next window.
Then click Select metric in Series row on new window.
Select test-metric on drop-down list. Then select some-value on the right similarly.
If successful, you will see point on the graph. keep in mind that points may be displayed with a delay of several minutes.
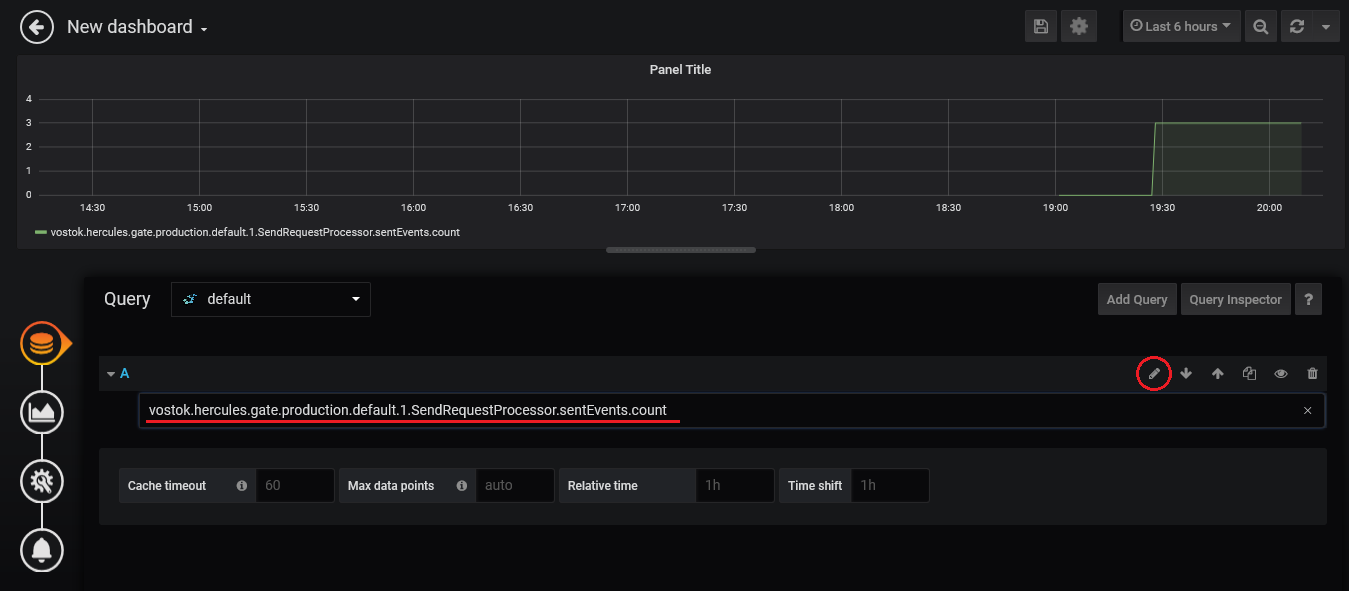
You can see metrics of Hercules components, it may be Gate for example.
Click to the pencil icon on the last Grafana window of test metric.
Entry query: vostok.hercules.gate.production.default.1.SendRequestProcessor.sentEvents.count
You can see test trace.
Find line with traceId among the logs of test script (look it in the terminal where you have launched test script).
The line looks like this:
2020-12-24T08:50:30.292Z [main] DEBUG r.k.v.h.cli.common.EventSamples - Trace event is generated with id: d85f68a3-ba77-404d-8759-4a3c5bfa241a, traceId: f8bf1d3b-74ca-4be5-97d1-7fbd84324a4c
Copy value of traceId from this line.
Submit request to Tracing API with copied value instead of <traceId> in sample:
curl "http://vm-hercules-sp:6308/trace?traceId=<traceId>"
If successful, you will see json with trace information like this:
{"result":[{"beginTimestamp":"2020-12-10T11:08:44.000000000+03:00","endTimestamp":"2020-12-10T11:10:43.000000000+03:00","traceId":"f8bf1d3b-74ca-4be5-97d1-7fbd84324a4c","spanId":"f419a60e-160d-4fc2-aa92-aa20234f9f28","annotations":{"application":"TestApplication","some_key":"test"},"parentSpanId":"4ebf52fe-ee9b-4ab9-a3a9-8ab751380819"}]}
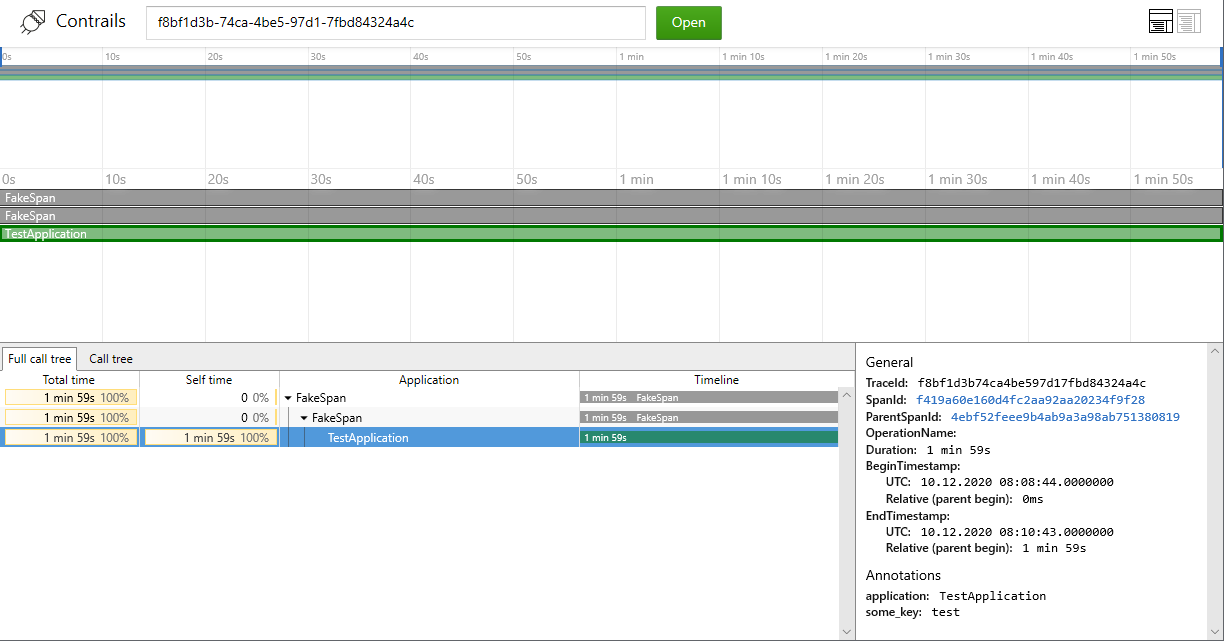
You can see the trace in Contrails.
Go to localhost:6301. Entry copied traceId value.
If successful, you will see diagram. Click to TestApplication line to see trace details.
###To add new stream
By default, stream name should contains prefix 'logs', 'metrics' or 'traces'.
Submit request to Management API with stream name instead of <stream name>:
curl -v -X POST 'management-api:6307/streams/create' --header 'Content-Type: text/plain' -H 'Authorization: Hercules masterApiKey 123' --data '{
    "type": "base",
    "name": "<stream name>",
    "partitions": 1,
    "shardingKey": [],
    "ttl": 86400000
}'
More informations in Management API documentation.
###To add new apiKey
Submit request to Management API with new apiKey instead of <apiKey> and stream prefix instead of <prefix>:
curl -v -X POST 'management-api:6307/rules/set?key=<apiKey>&pattern=<prefix>*&rights=rwm' -H 'Authorization: Hercules masterApiKey 123'
More informations in Management API documentation.
###To use custom stream name:
If your stream name don't start with default prefix (logs*, metrics* or traces*),
change value in line sink.pattern=<prefix name>.
To change prefix for logs, edit file
/etc/properties/elastic-sink/application.properties.
To change prefix for metrics, edit file
/etc/properties/graphite-sink/application.properties.
To change prefix for traces, edit file
/etc/properties/tracing-sink/application.properties.
###To configure events Edit properties file:
/etc/properties/gateway-client/log/application.properties - for logs
/etc/properties/gateway-client/metric/application.properties - for metrics
/etc/properties/gateway-client/trace/application.properties - for traces
You can configure:
gate-client.sender.stream - stream in Kafka used for events writing
gate-client.sender.type - event type. Default value: log. Values:
log- log-event for ElasticSearch and Sentrytrace- trace-eventmetric- metric-event
gate-client.sender.apiKey - API-key of specified stream
gate=client.sender.url - URL of Hercules Gate server
gate-client.sender.eventCount - event count per sending request. Default value: 1
gate-client.sender.requestCount - sending request count. Default value: 1
You can manage your events by changing file test.sh or write your own script.
