A Python package for running experiments with machine learning regressors on time-series data.
-
Lasso, ElasticNet, KernelRidge, Knn, Adaboost, Gradient Boosting, Random Forest, Support Vector, XGBoost, (bidirectional) LSTM regression algorithms
-
Seasonal decomposition
-
Feature selection using Pearson's r and recursive feature elimination
-
In-sample and out-of-sample forecast evaluation in terms of RMSE, MAE, MAPE, Mean Directional Accuracy
-
Multiprocessing with the multiprocessing package
-
Distributed processing with zmq and celery
-
Visualization of validation runs
-
Visualization of forecasted values
Settings for preprocessing steps and the learning algorithms are specified in settings.py:
-
data_file: the input CSV file
-
date_format: the format of the date string in the input file, e.g., "%d-%b-%y"
-
test_split: the test-train ratio, e.g., 0.2
-
difference: if data (both dependent and explanatory variables) should be differenced, 0 or 1
-
deseason: if the dependent variable should de-seasonalized, 0 or 1
-
seasonal_period: the number of seasonal periods, e.g., 4 for quarterly seasons
-
horizon: the forecast horizon, e.g., 3
-
feature_selection: the proportion of features to select: e.g., 0.5; 0 - no feature selection
-
rfe_step: the percentage of features to remove at each iteration when using Recurrent Feature Selection, e.g., 0.1; 0 - do not use RFE
-
use_exog: if exogenous features should be used, 0 or 1
-
lags: the number of lags, e.g. 7
-
scale_range: the range to which all features should be scaled, e.g., [0, 1]
-
n_jobs: the number of parallel jobs, e.g., 2
-
random_state: the random seed value, e.g., 7
Multiprocessing
To run experiments with, e.g., AdaBoost:
$ python run.py AdaBoost
Evaluation results are written to results.json and to a log file under ./logs.
ZeroMQ
In one console:
$ python run_zmq.py LSTM
In a different console, possibly on several different machine(s):
$ python workers_zmq.py LSTM
Evaluation results are written by run_zmq.py to results.json and to a log file under ./logs.
Celery
In one console:
$ python run_celery.py LSTM
In a different console, possibly on several different machine(s):
$ celery -A workers_celery worker
Evaluation results are written by run_celery.py to results.json and to a log file under ./logs.
Visualize validation results
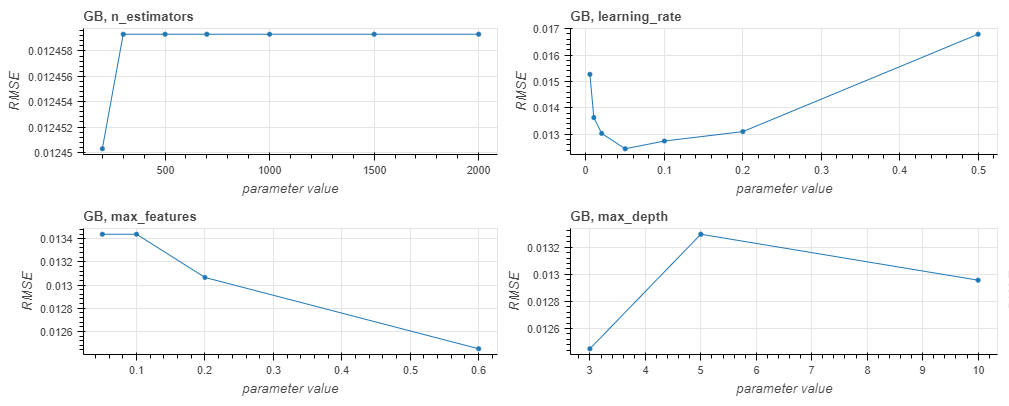
$ python validation_runs_viz.py GB
Retrieves validation results from results.json for the latest run of the Gradient Boosting regressor and produces plots showing forecast quality measures as a function of hyperparameter values, e.g.:
Visualize forecast values
$ python emp_intervals_viz.py GB
Produces plots with forecast values on the in-sample, validation, and out-of-sample sets. The plots include forecast confidence intervals and "traces" showing forecast values resulting from different random seed values. E.g.:
-
numpy
-
pandas
-
sklearn
-
tensorflow
-
statsmodels
-
bokeh
-
zmq (optional, required only for distributed processing)
-
celery (optional, required only for distributed processing)
-
xgboost (optional, required only for XGBoost)
All the packages come installed with Anaconda, except celery, tensorflow, and xgboost, which can be installed with conda or pip:
$ conda install -c conda-forge celery
$ conda install -c conda-forge xgboost
$ conda install -c conda-forge tensorflow
$ nosetests --logging-filter=-tensorflow,-matplotlib --with-coverage --cover-html --cover-package="utils,data,learner_configs" tests
The expected format is CSV. The first column should be called "date" and the last column should contain the target (dependent) variable and be called "dep_var".
If detrending or seasonal decomposition should be used, the "date" column must contain all consecutive dates, without any missing entries for e.g., weekends.
See example data files in ./examples.
examples/ise.csv: Istanbul Stock Exchange data, the original version is available from UCI Machine Learning Repository.
examples/AirQualityUCI.csv: Air Quality dataset, the original version is available from UCI Machine Learning Repository.

