Development on covid-visuals has ended for the time being. This repository is archived and read-only.
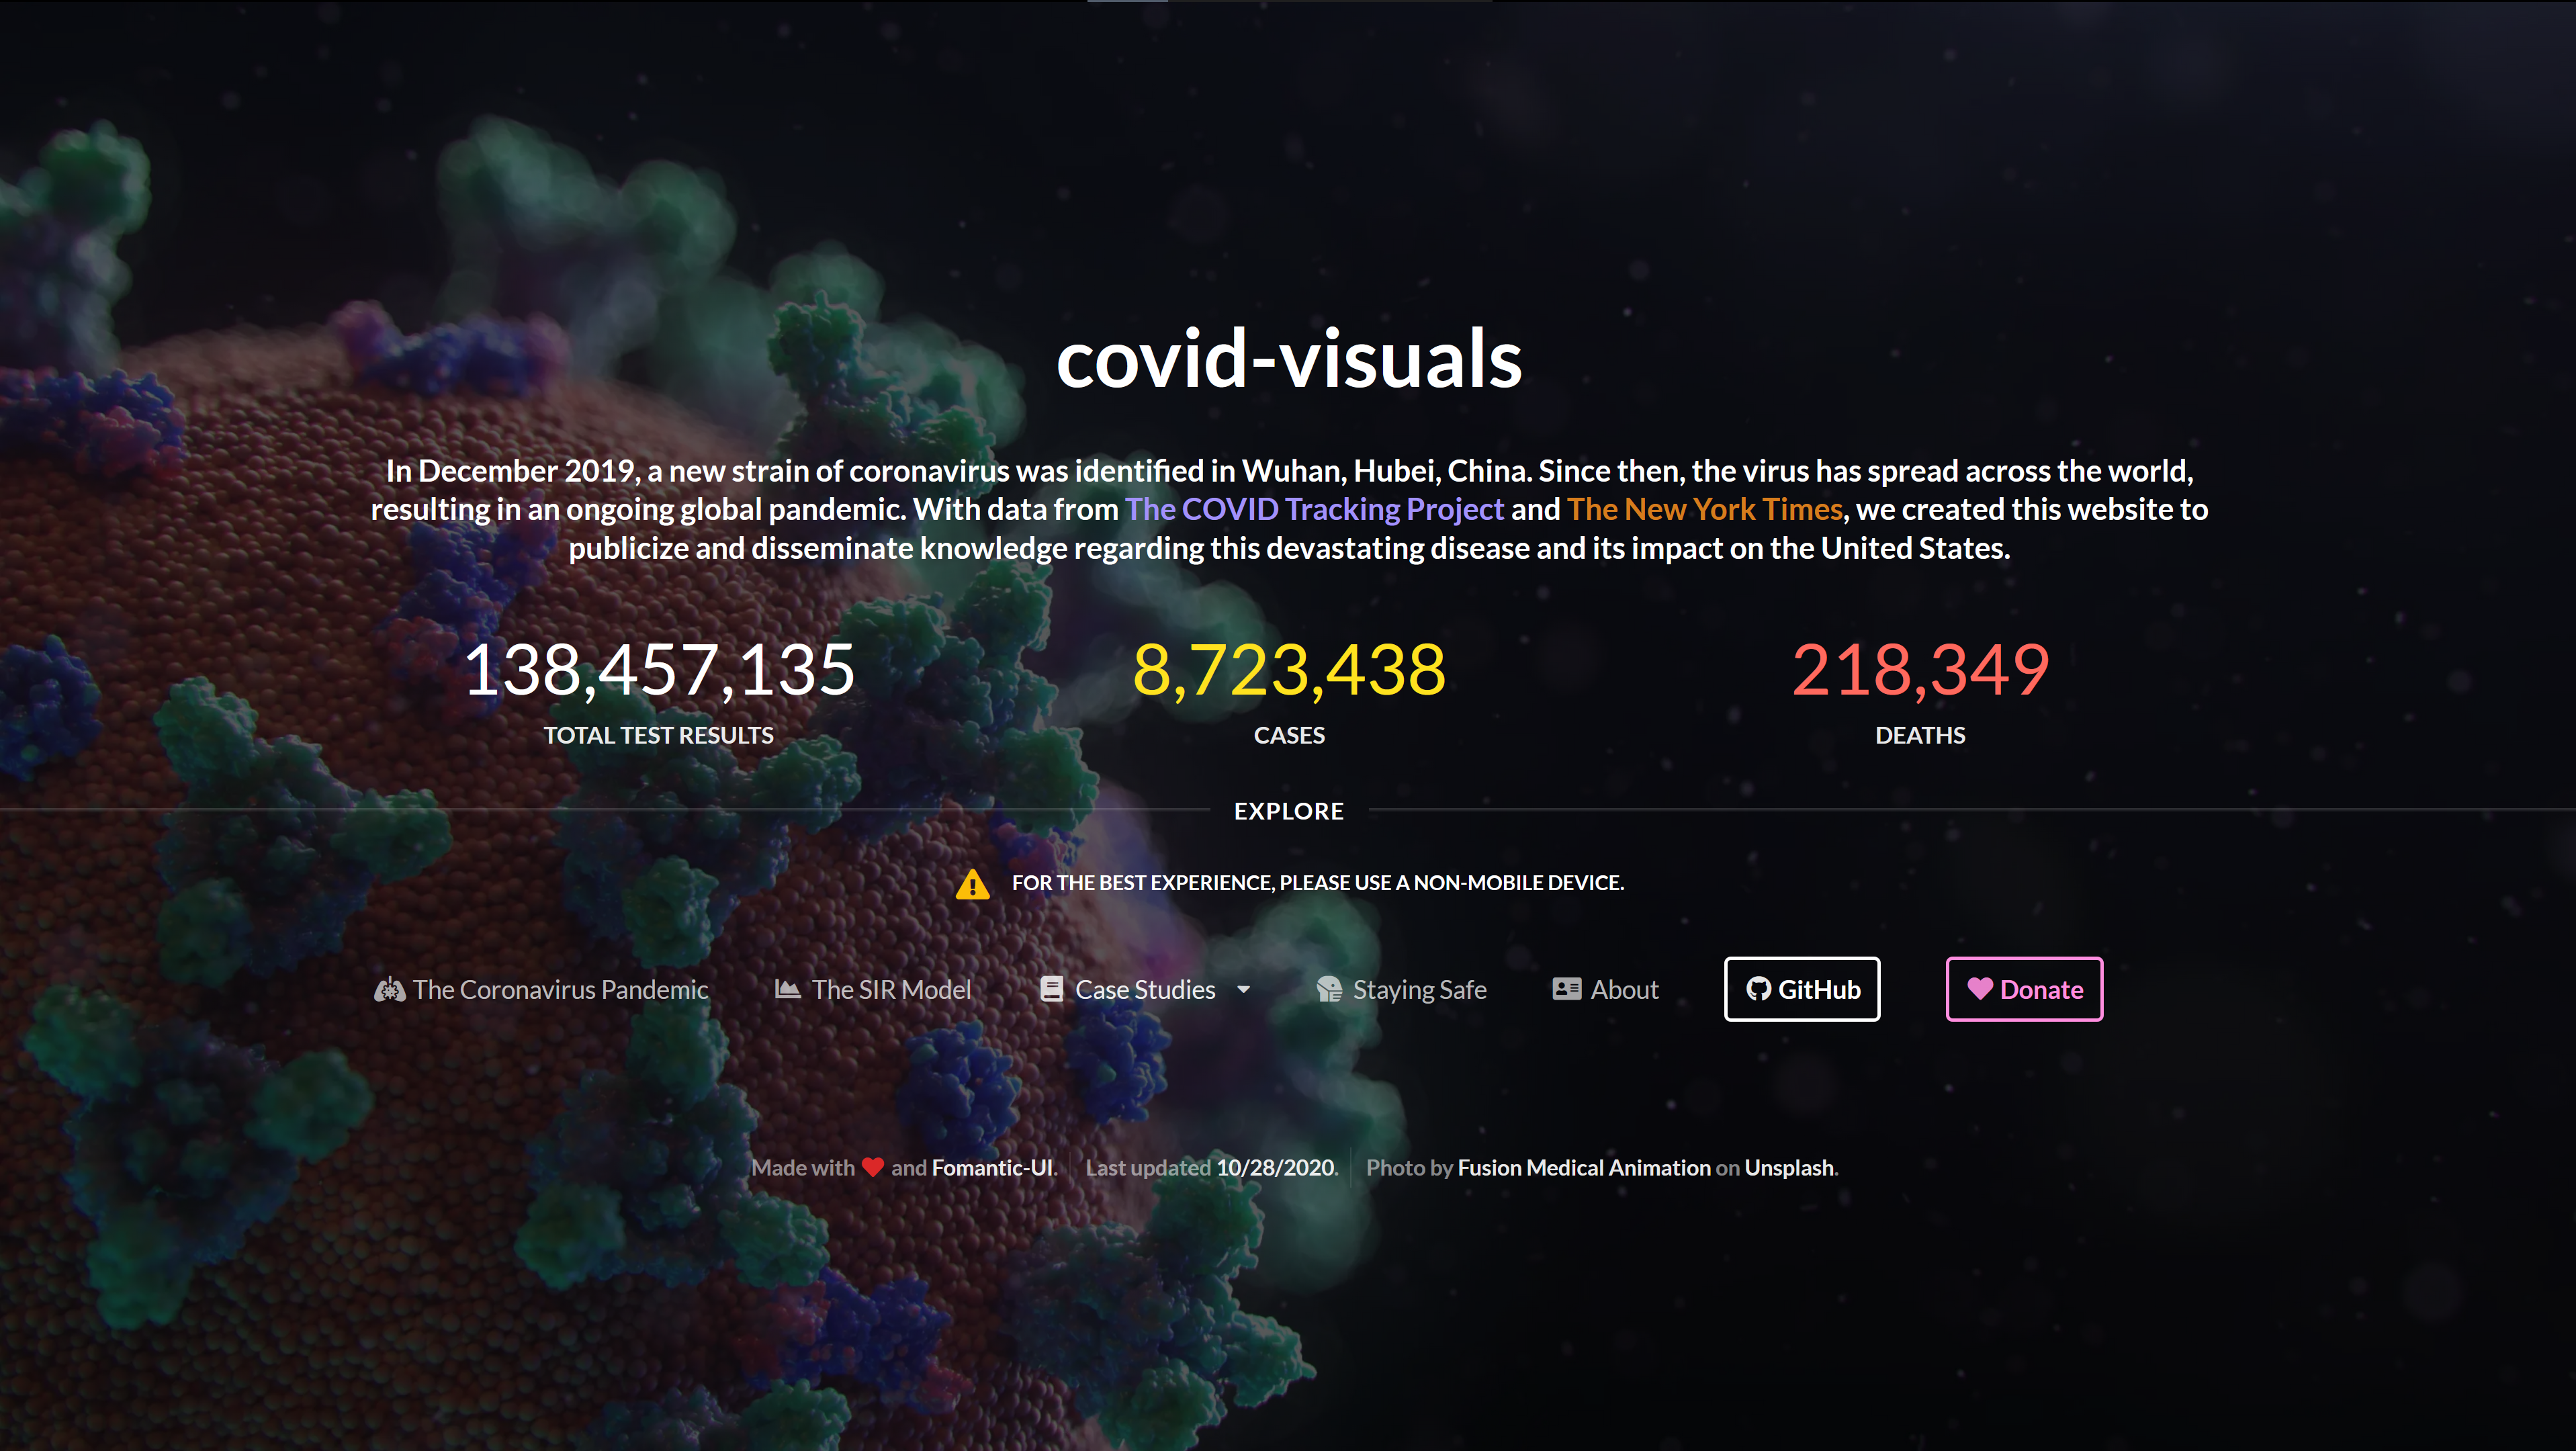
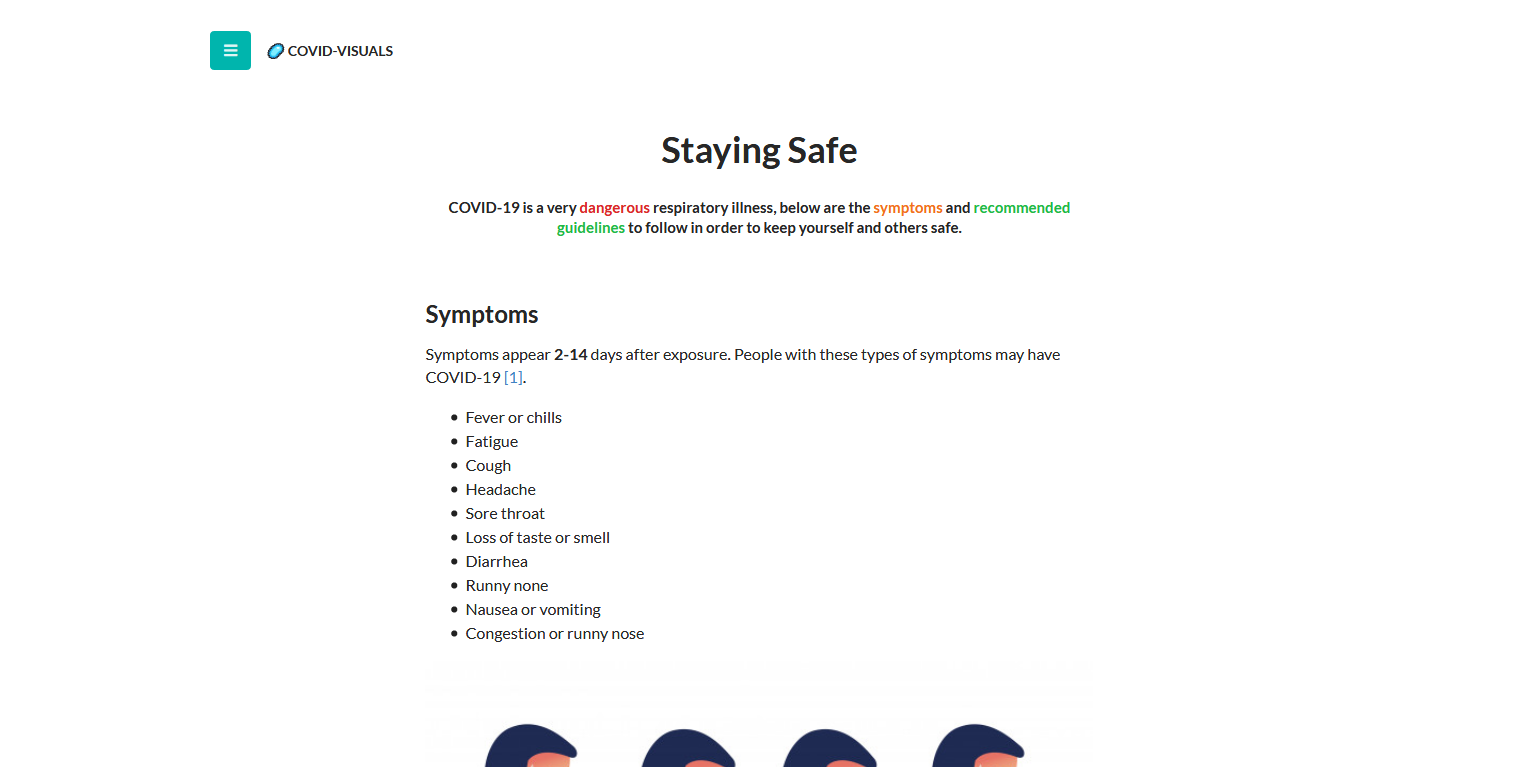
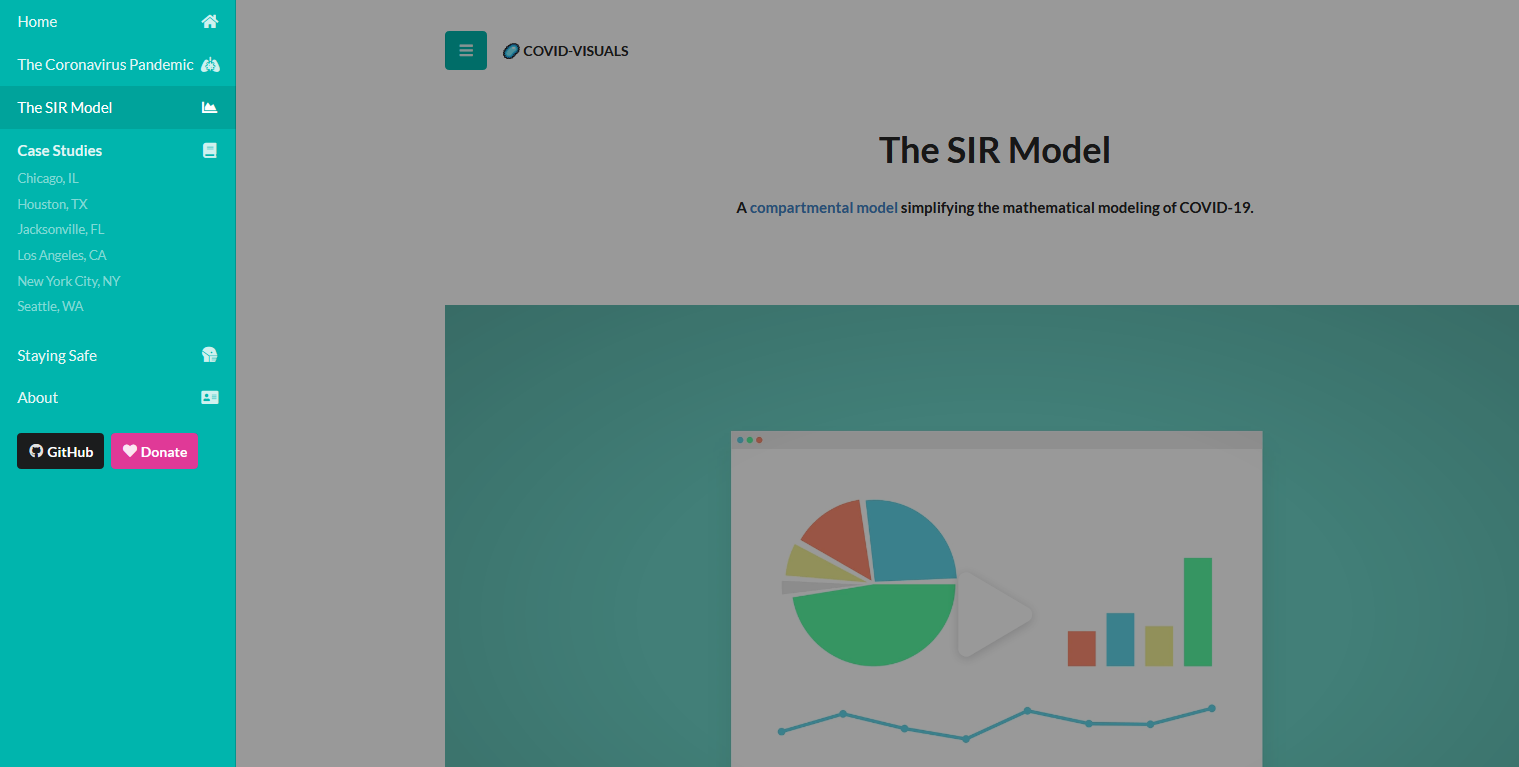
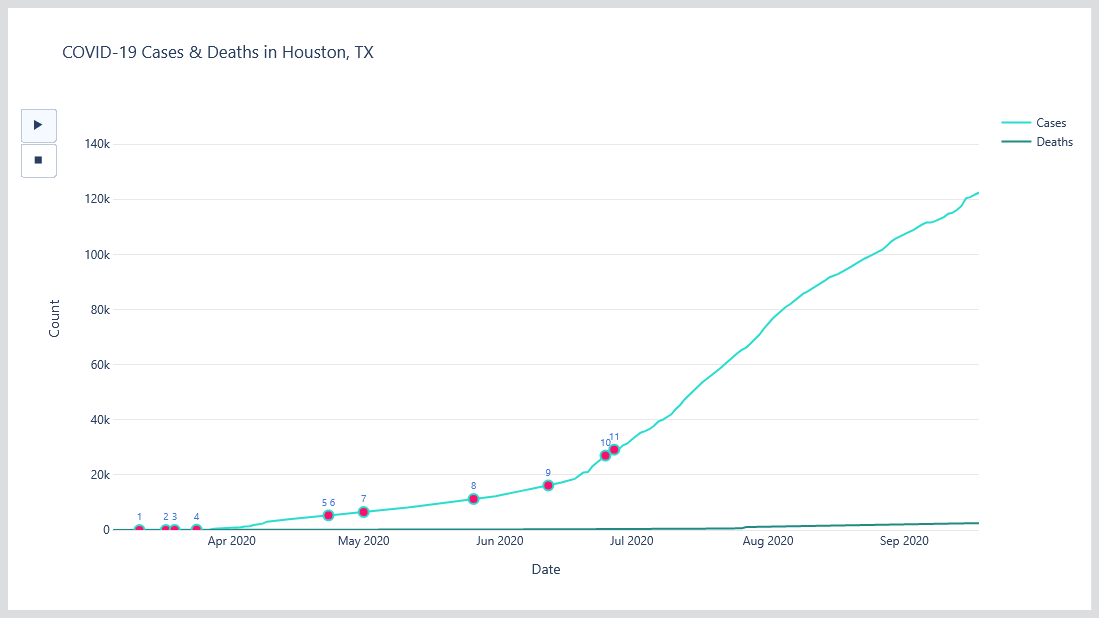
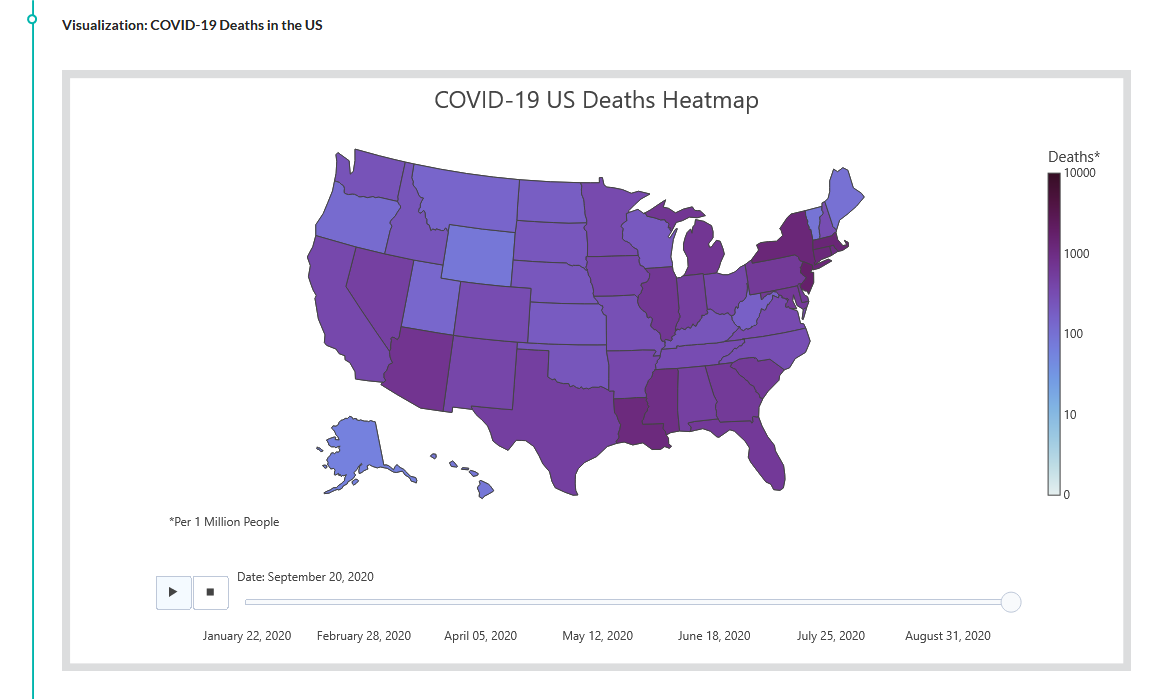
covid-visuals is a website documenting the spread of COVID-19 and its impacts on the United States through custom visuals and a timeline of major events.
- Python 3.8
- Plotly
- JQuery 3.3.1
- Fomantic-UI
- marked.js
- AOS - Animate on Scroll Library
- HTML / CSS / JS
$ git clone https://github.com/vskbellala/covid-visuals.git
$ cd covid-visuals/
$ pip install -r requirements.txt
$ python3 update.py
$ cd docs/plots/
- Clone this repository and navigate to the root directory.
- Run
pip install -r requirements.txtto install dependencies. - Run
python3 update.pyto update plots. - Navigate to
docs/plots/and open a plot's HTML file to view them in the browser!
We are not open to contributing at this time, but if you have any suggestions or comments, let us know by opening a GitHub Issue.
We greatly thank the following organizations for making this project possible. Their datasets have been invaluable to us.
