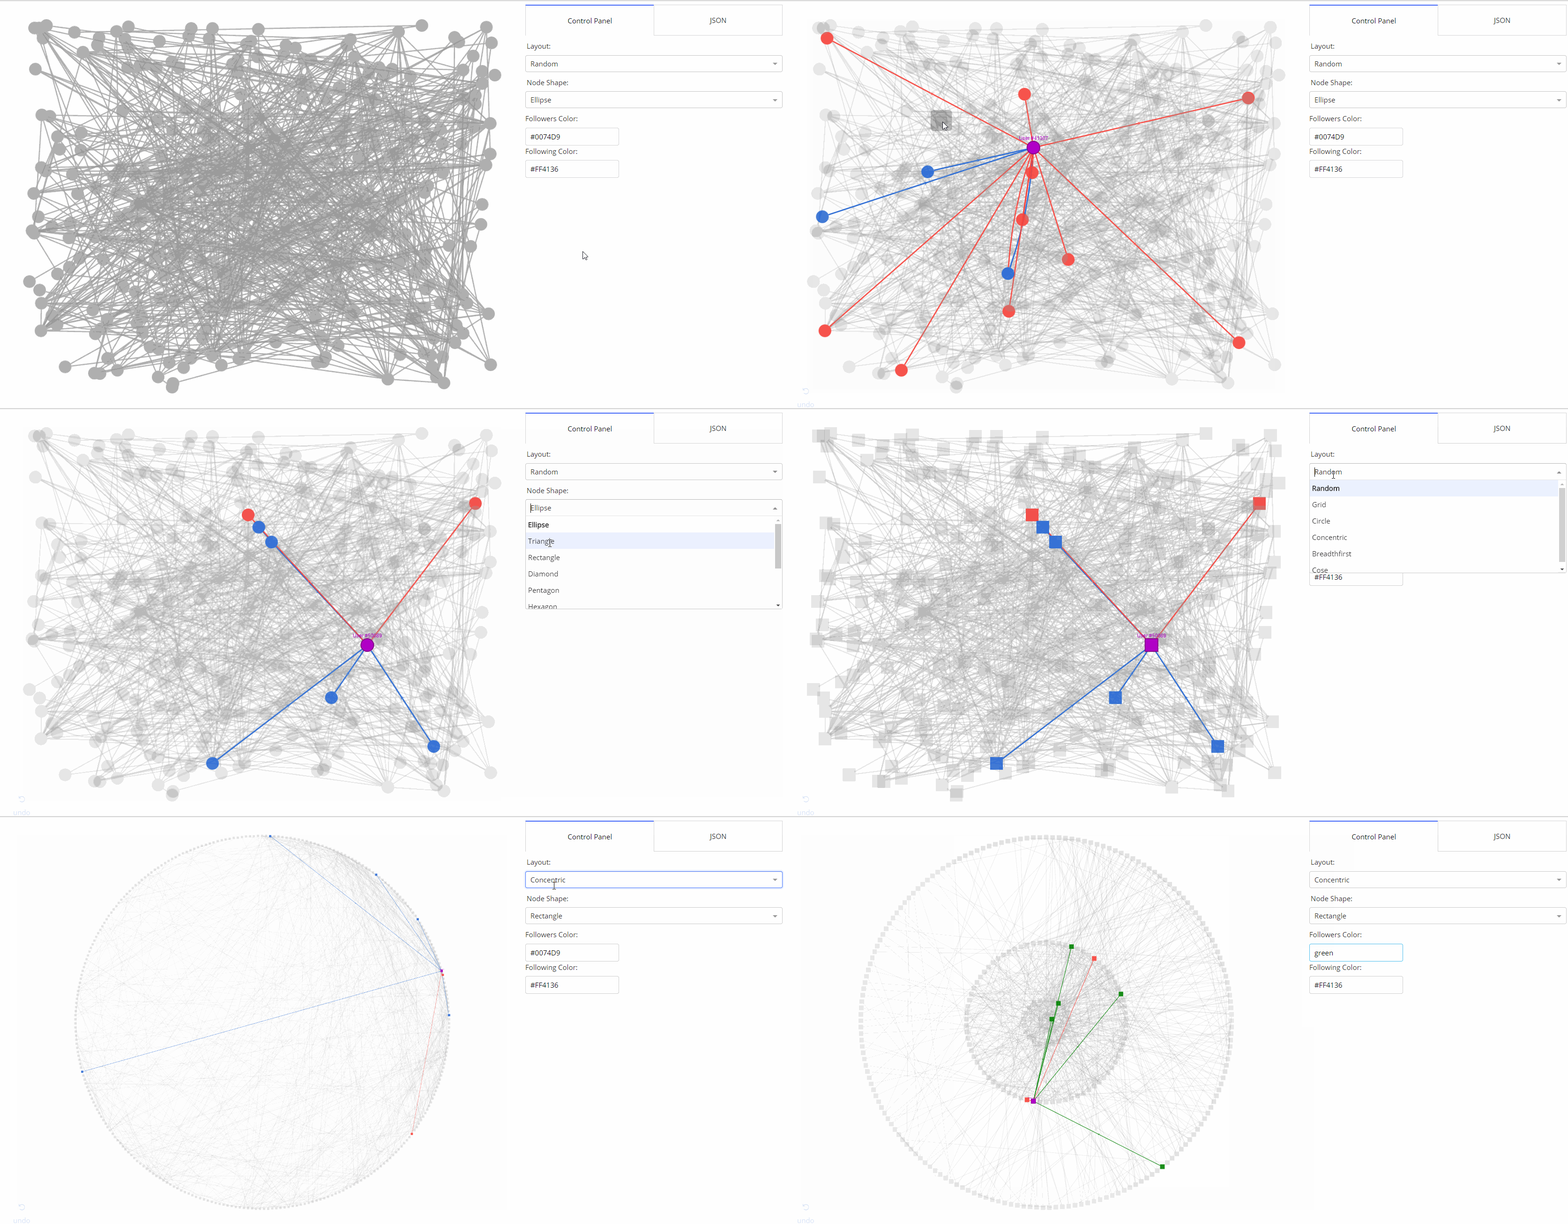
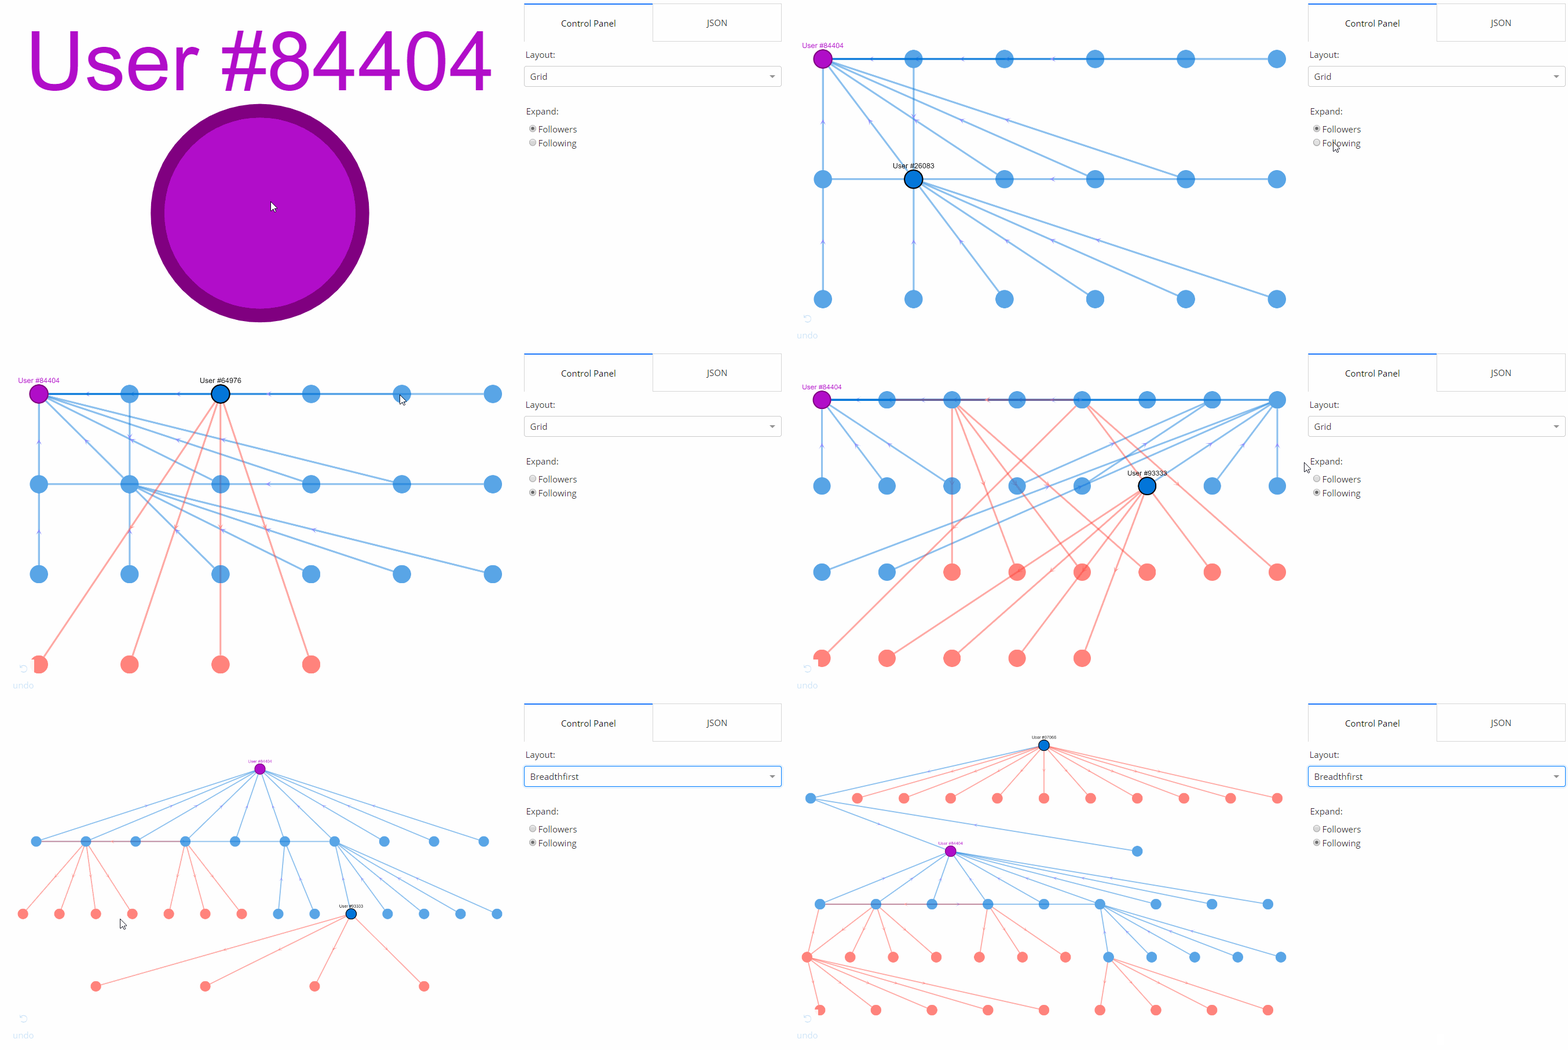
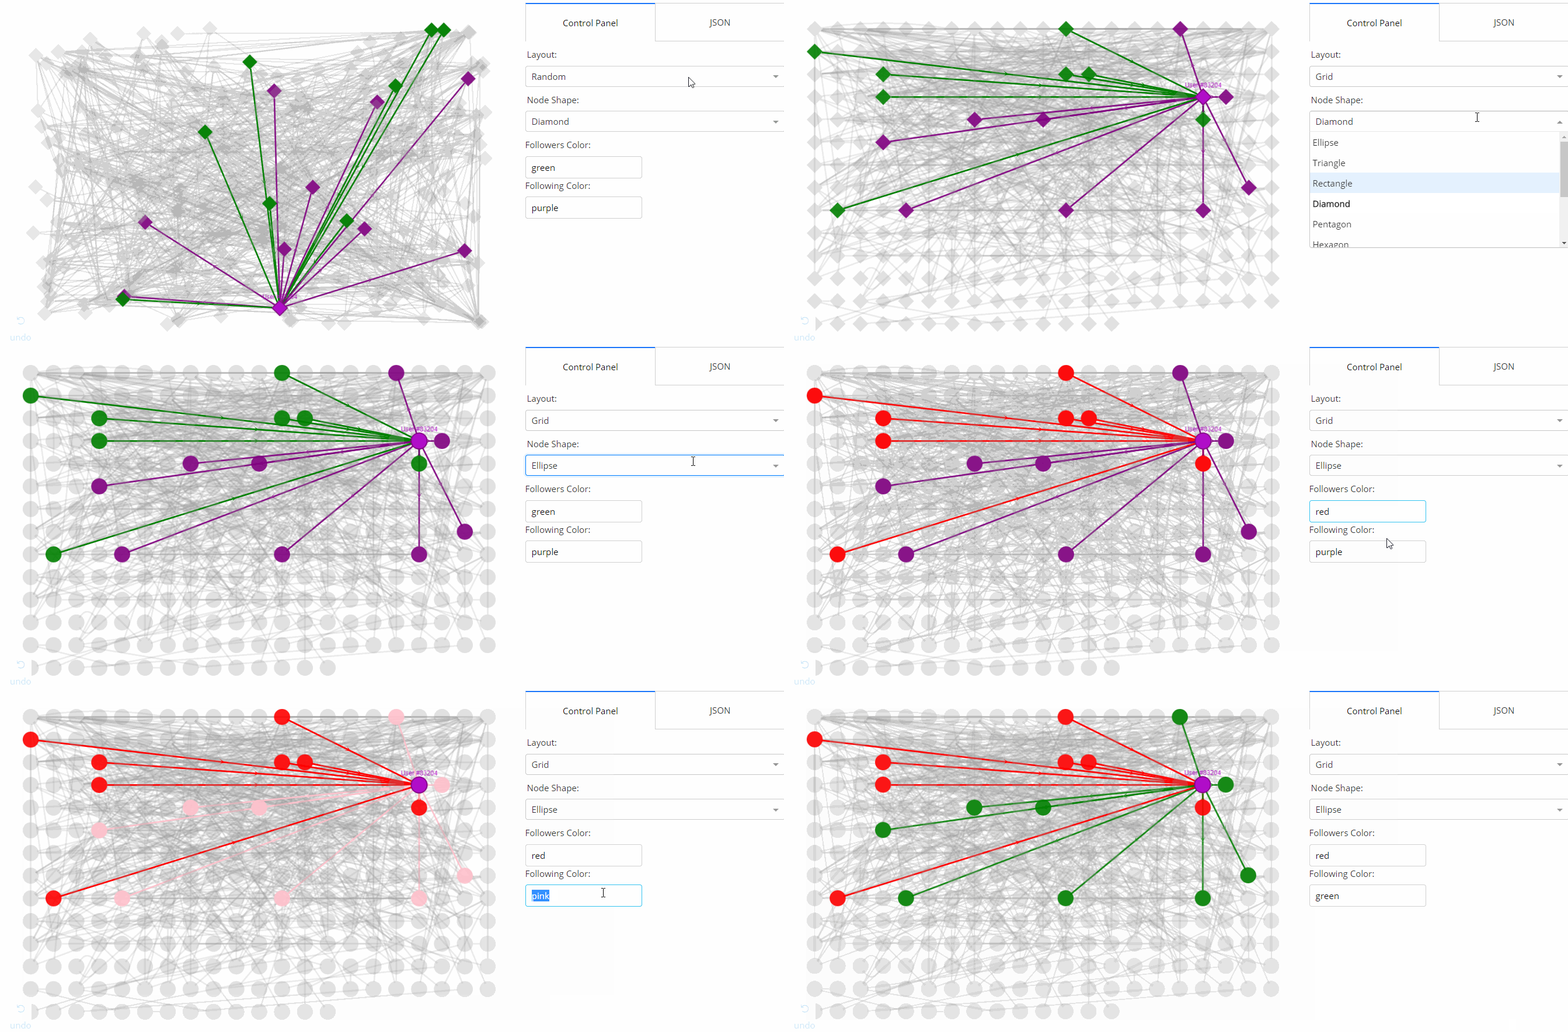
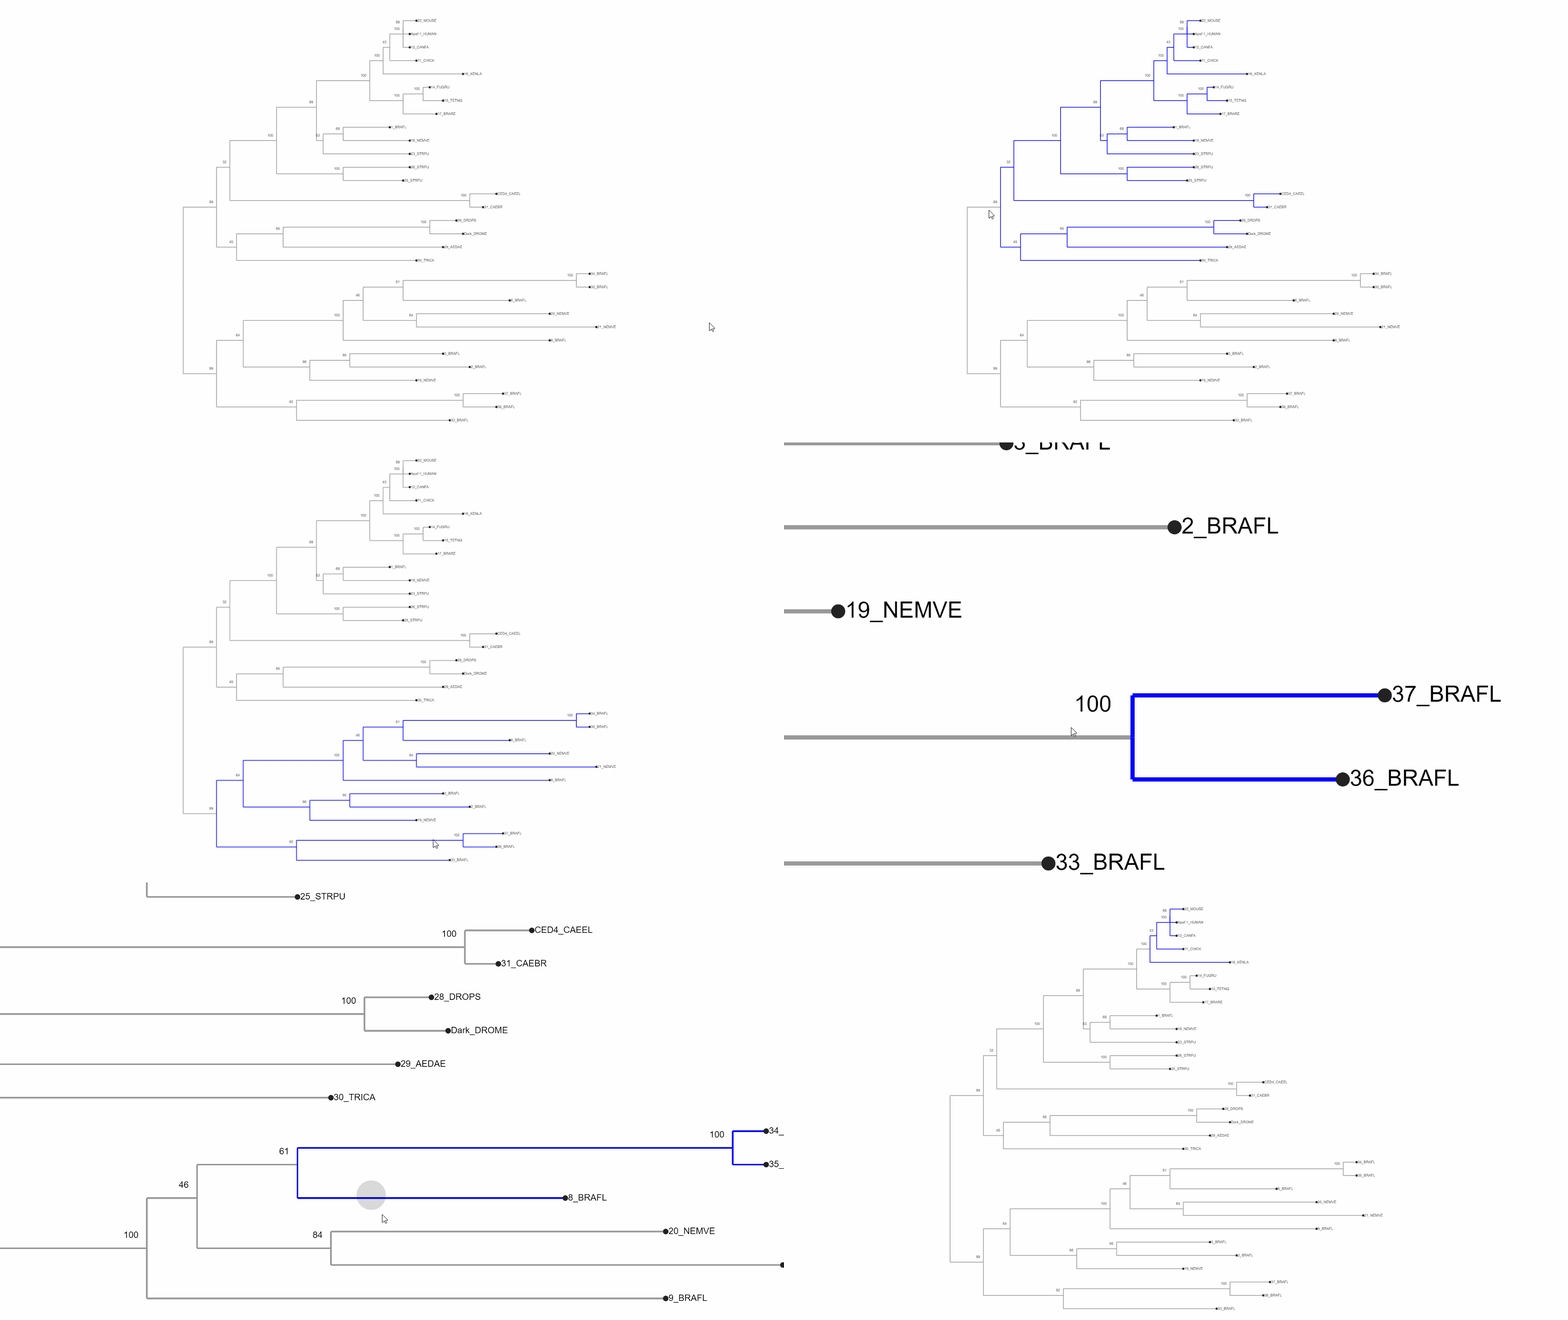
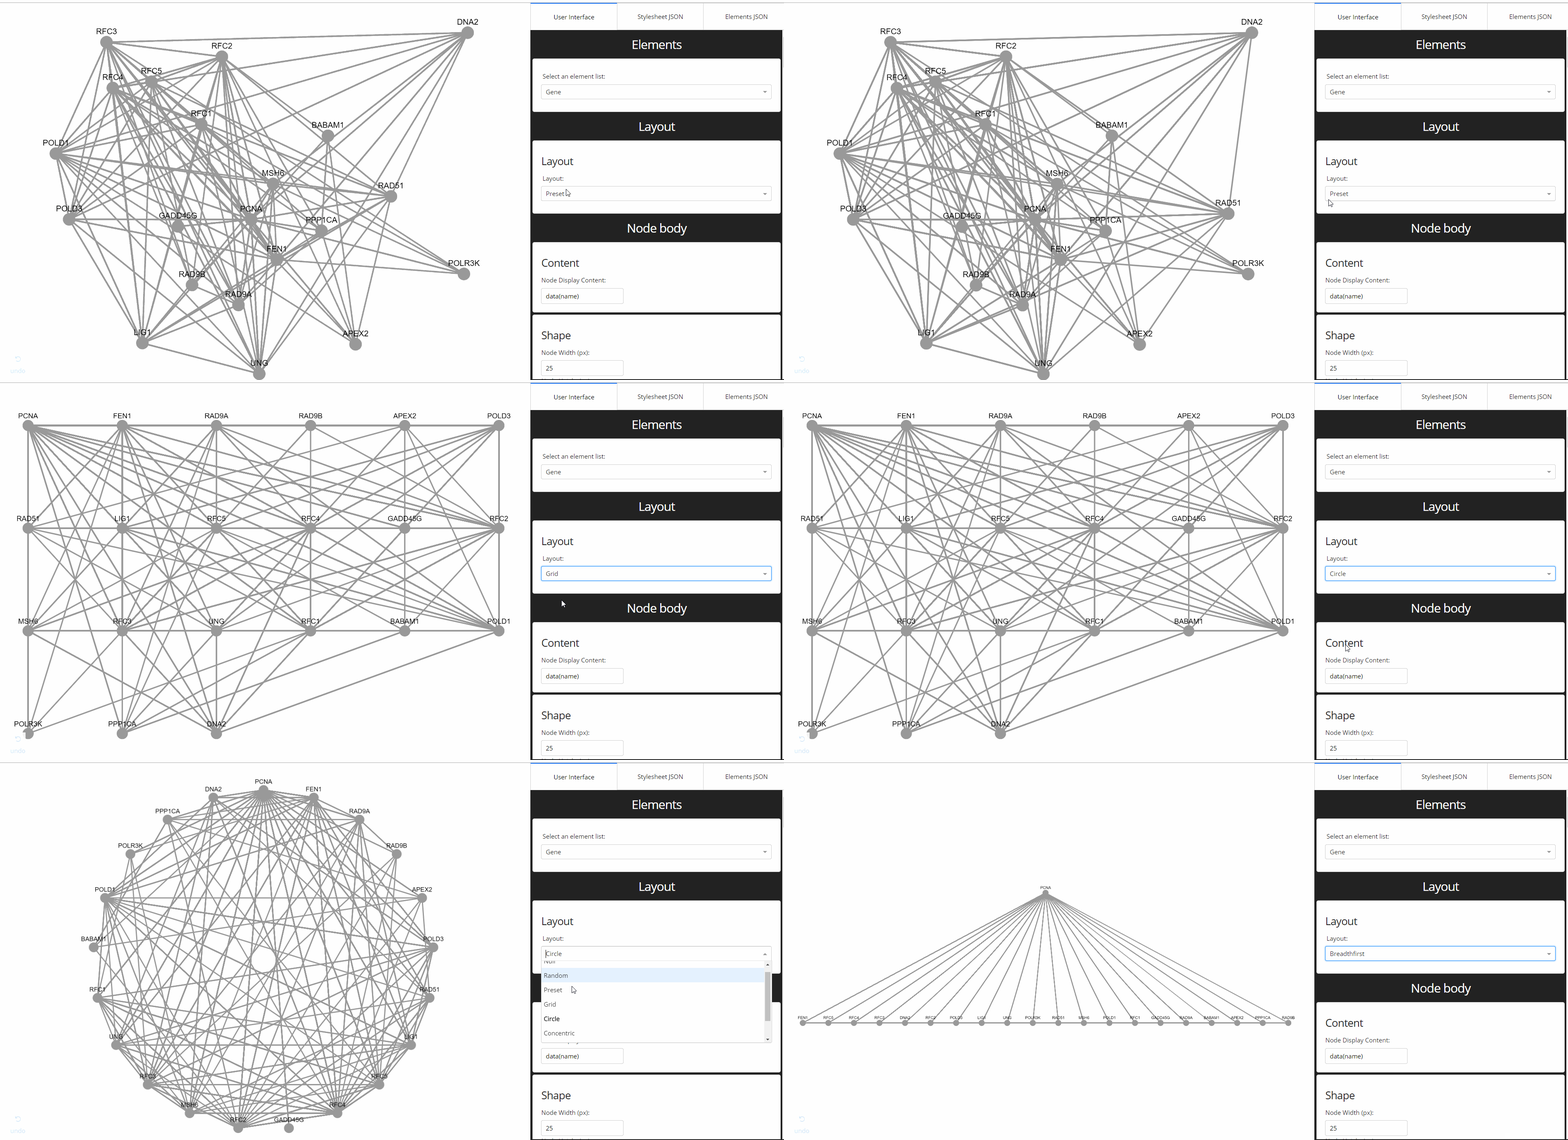
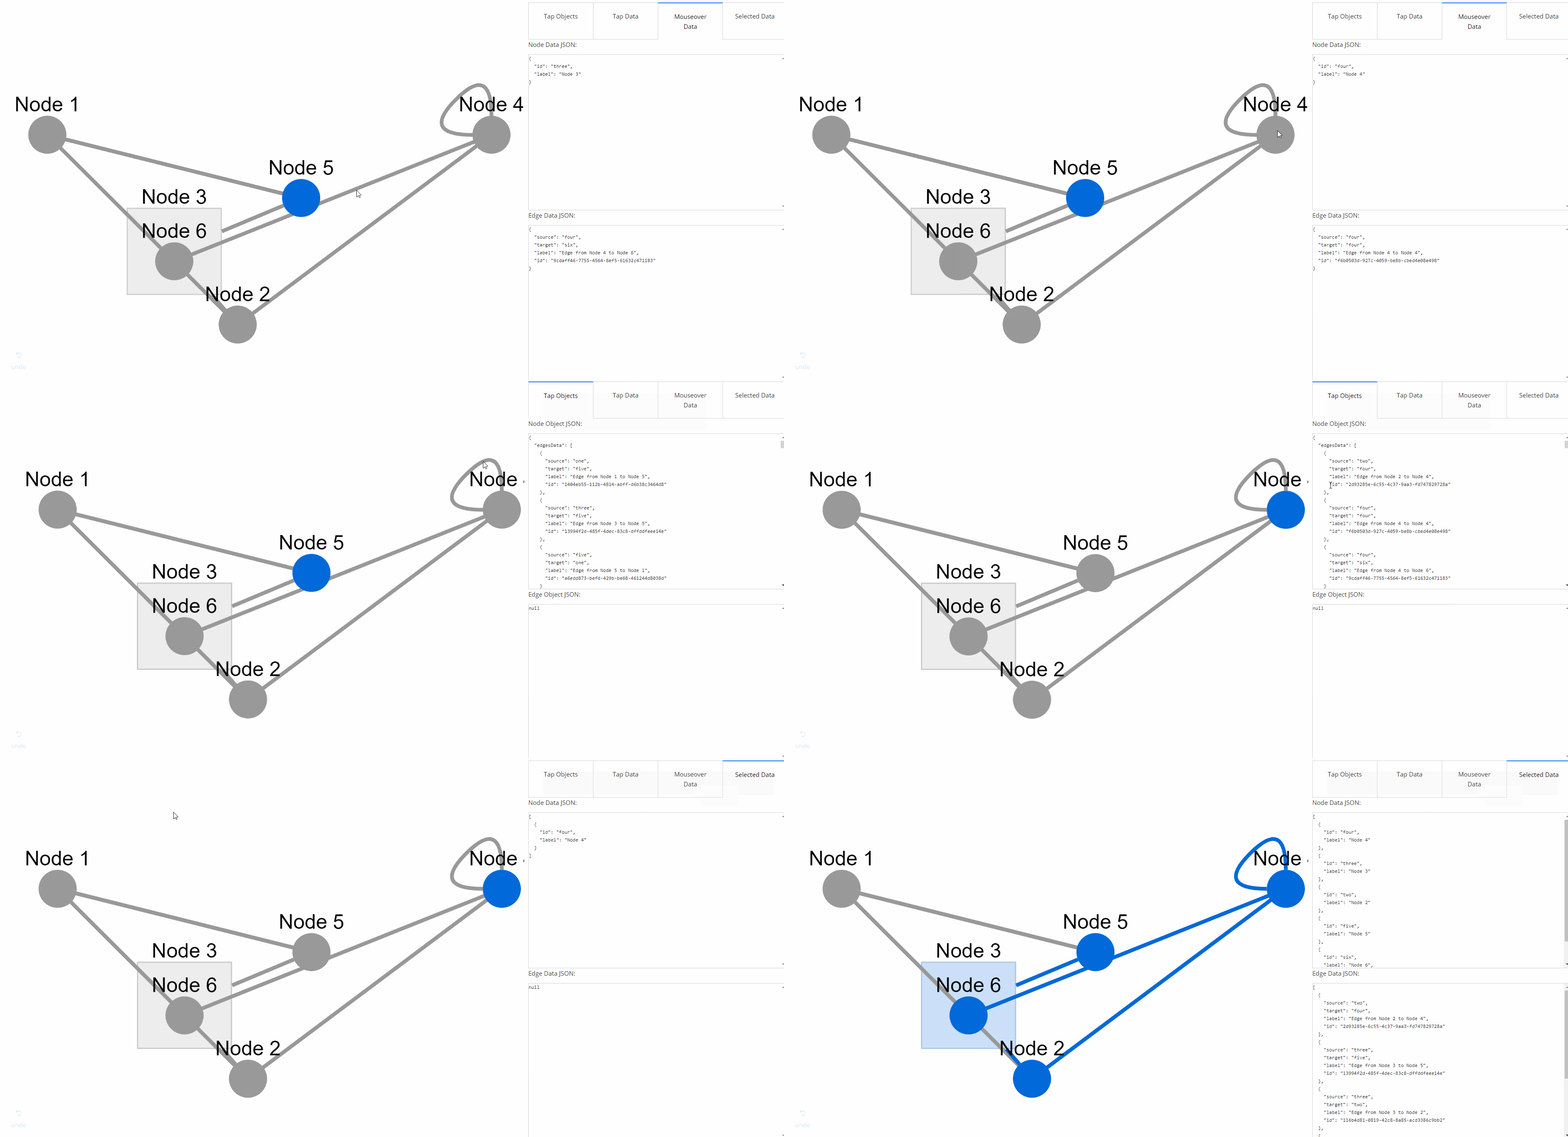
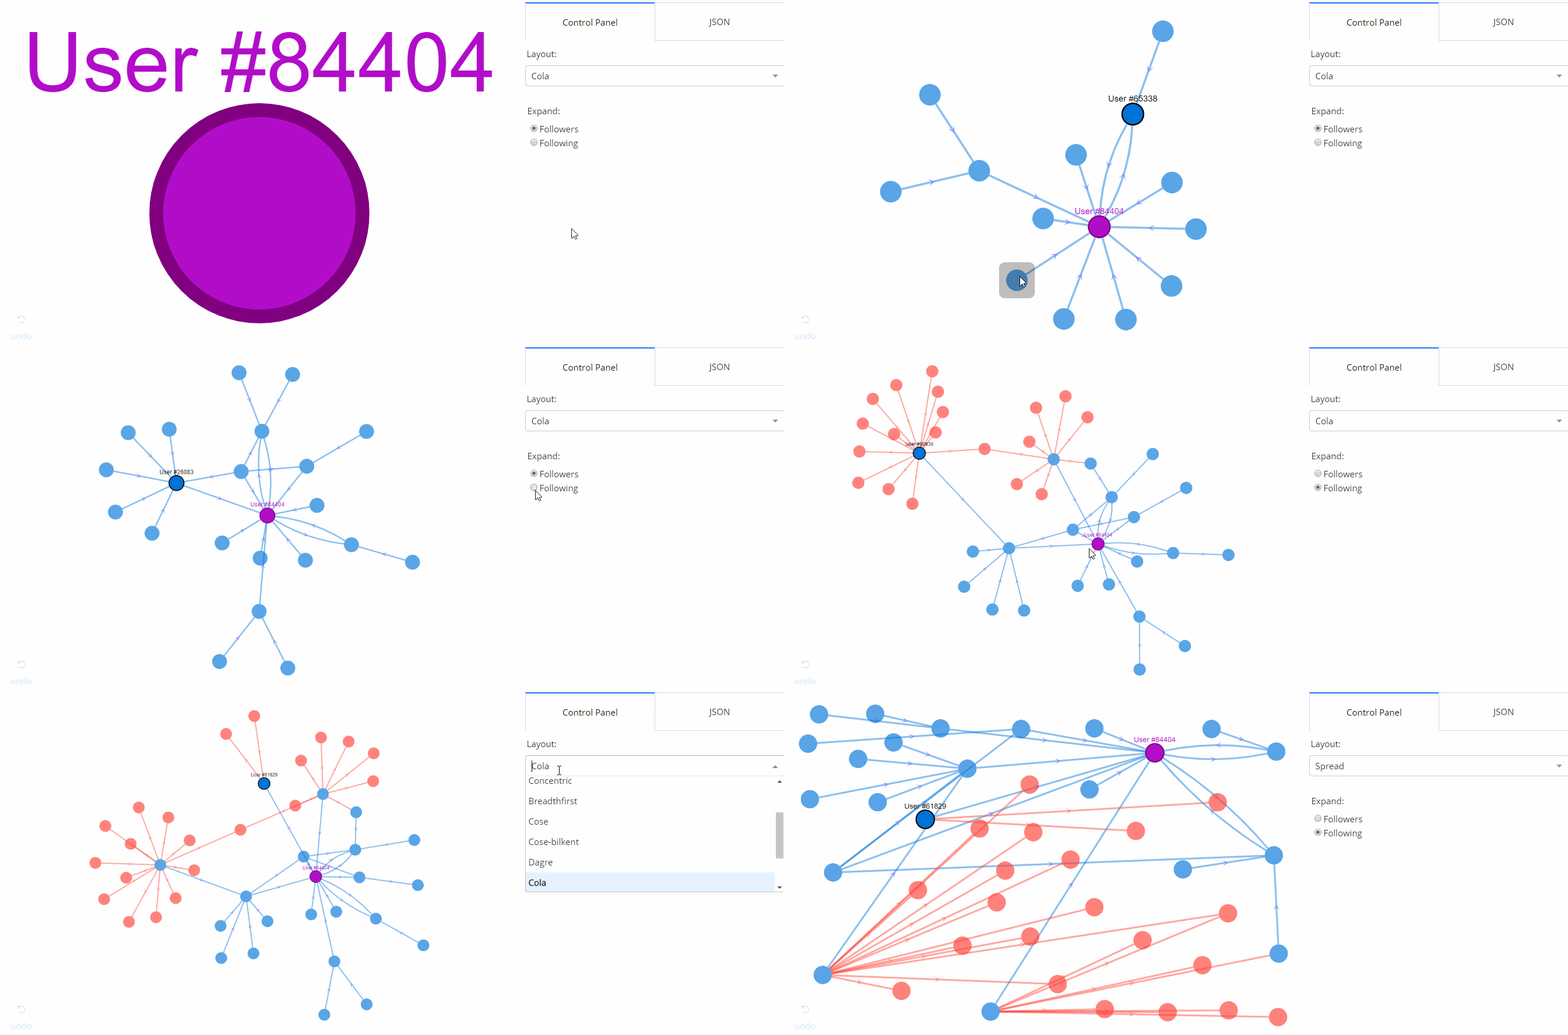
A Dash component library for creating interactive and customizable networks in Python, wrapped around Cytoscape.js.
- 🌟 Medium Article
- 📣 Community Announcement
- 💻 Github Repository
- 📚 User Guide
- 🗺 Component Reference
- 📺 Webinar Recording
Make sure that dash and its dependent libraries are correctly installed:
pip install dash
If you want to install the latest versions, check out the Dash docs on installation.
Install the library using pip:
pip install dash-cytoscape
Create the following example inside an app.py file:
import dash
import dash_cytoscape as cyto
import dash_html_components as html

app = dash.Dash(__name__)
app.layout = html.Div([
    cyto.Cytoscape(
        id='cytoscape',
        elements=[
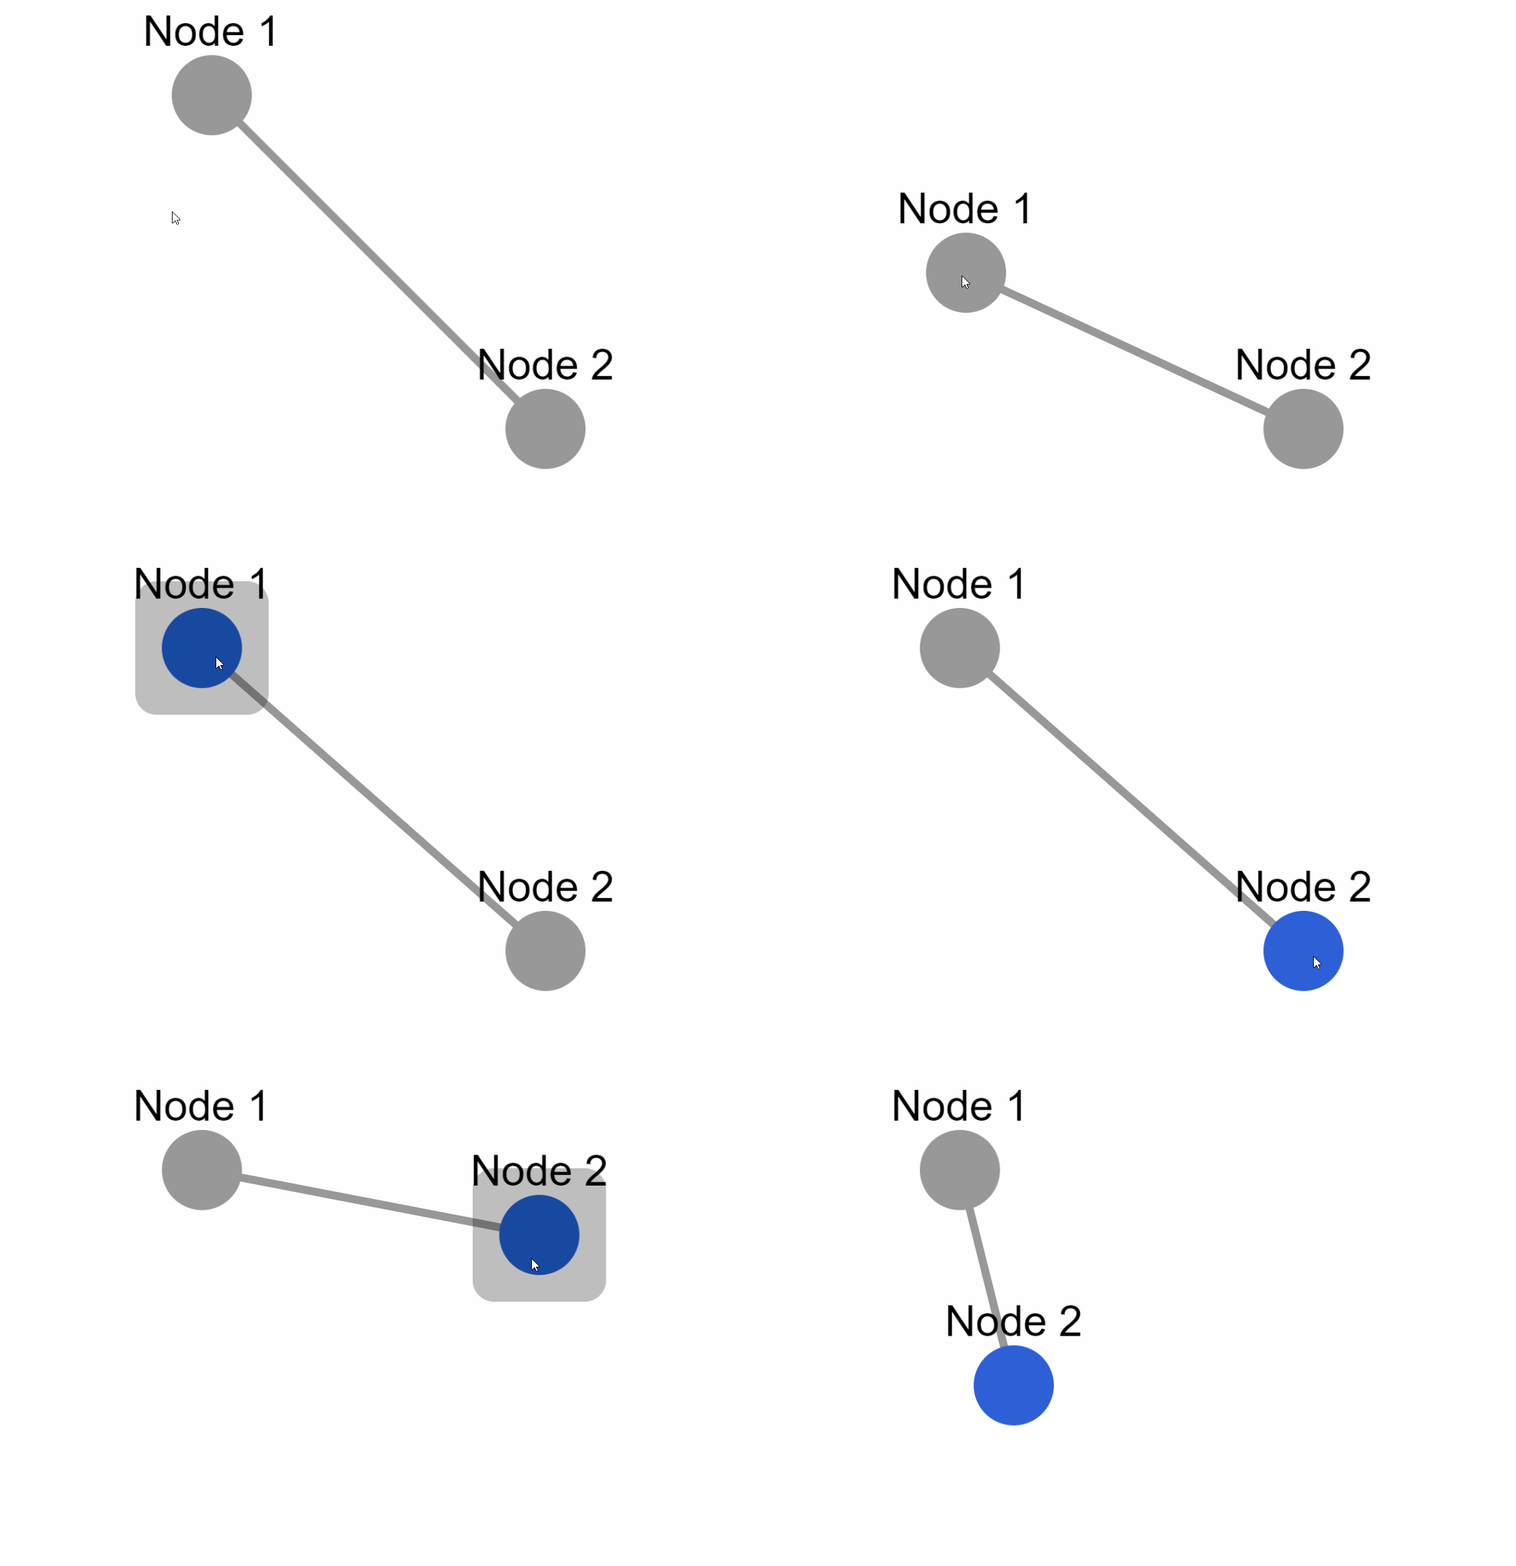
            {'data': {'id': 'one', 'label': 'Node 1'}, 'position': {'x': 50, 'y': 50}},
            {'data': {'id': 'two', 'label': 'Node 2'}, 'position': {'x': 200, 'y': 200}},
            {'data': {'source': 'one', 'target': 'two','label': 'Node 1 to 2'}}
        ],
        layout={'name': 'preset'}
    )
])

if __name__ == '__main__':
app.run_server(debug=True)You can also add external layouts. Use the cyto.load_extra_layouts() function to get started:
import dash
import dash_cytoscape as cyto
import dash_html_components as html

cyto.load_extra_layouts()

app = dash.Dash(__name__)
app.layout = html.Div([
    cyto.Cytoscape(...)
])
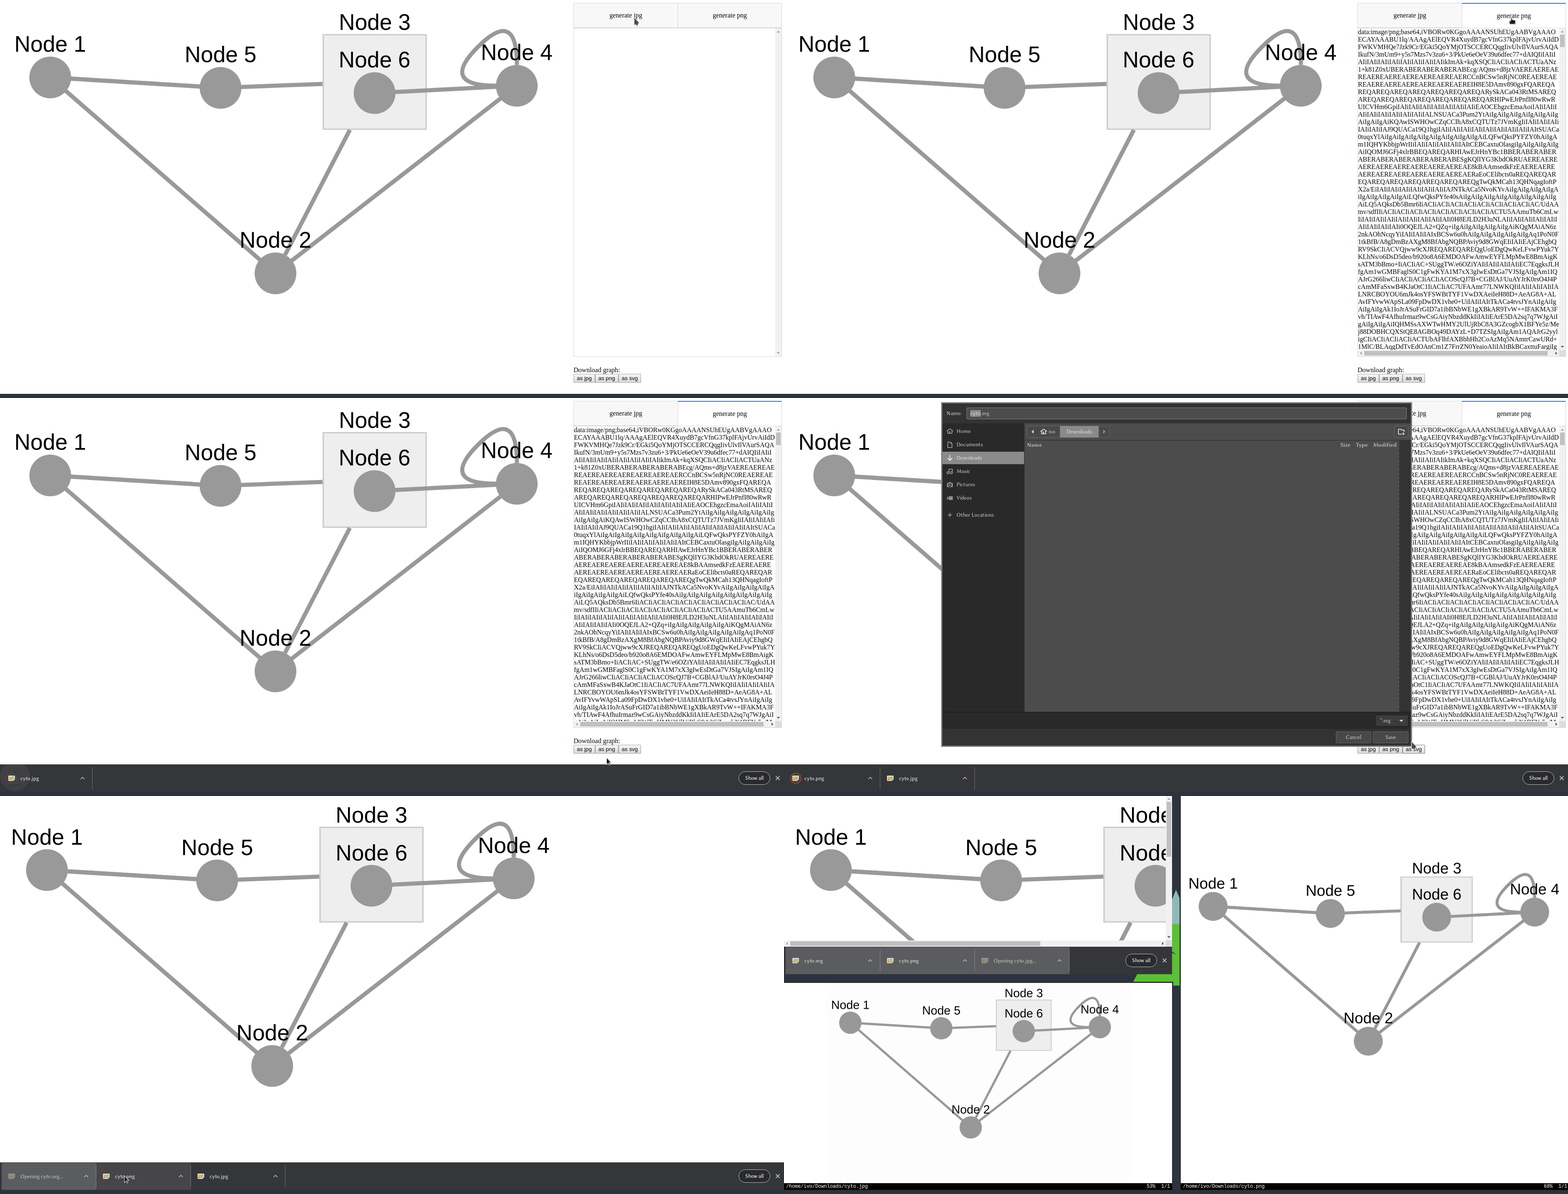
Calling cyto.load_extra_layouts() also enables generating SVG images.
install.packages(c("devtools", "dash"))Install the library using devtools:
devtools::install_github("plotly/dash-cytoscape")
Create the following example inside an app.R file:
library(dash)
library(dashHtmlComponents)
library(dashCytoscape)

app <- Dash$new()

app$layout(
  htmlDiv(
    list(
      cytoCytoscape(
        id = 'cytoscape-two-nodes',
        layout = list('name' = 'preset'),
        style = list('width' = '100%', 'height' = '400px'),
        elements = list(
          list('data' = list('id' = 'one', 'label' = 'Node 1'), 'position' = list('x' = 75, 'y' = 75)),
          list('data' = list('id' = 'two', 'label' = 'Node 2'), 'position' = list('x' = 200, 'y' = 200)),
          list('data' = list('source' = 'one', 'target' = 'two'))
        )
      )
    )
  )
)

app$run_server()The Dash Cytoscape User Guide contains everything you need to know about the library. It contains useful examples, functioning code, and is fully interactive. You can also use the component reference for a complete and concise specification of the API.
To learn more about the core Dash components and how to use callbacks, view the Dash documentation.
For supplementary information about the underlying Javascript API, view the Cytoscape.js documentation.
Make sure that you have read and understood our code of conduct, then head over to CONTRIBUTING to get started.
Instructions on how to run tests are given in CONTRIBUTING.md.
Dash, Cytoscape.js and Dash Cytoscape are licensed under MIT. Please view LICENSE for more details.
See https://plotly.com/dash/support for ways to get in touch.
Huge thanks to the Cytoscape Consortium and the Cytoscape.js team for their contribution in making such a complete API for creating interactive networks. This library would not have been possible without their massive work!
The Pull Request and Issue Templates were inspired from the scikit-learn project.
For an extended gallery, visit the demos' readme.


