This app collects and analyze data from the subreddit www.reddit.com/r/wallstreetbets/, a forum or subreddit on the social news website Reddit. The subreddit has gained a lot of popularity since the GameStop short squeeze. Due to the forums ability to impact the market it could be of interest to know what finanical instruments, also known as tickers, is currently being discussed to anticipate increased volatility.
The ticker hype aleart dashboard consist of 3 different docker containers:
- Postgres Database
- Data-Collector
- Data collection from IEX Cloud API to get offical tickers. Using the IEX Cloud Python SDK.
- Data collection from Reddit API to get all tickers mentioned in comments. Using the PRAW: The Python Reddit API Wrapper
- ETL process to filter out comments that contain offical tickers.
- Write data to Postgresql database.
- Dashboard
- Plotly Dash dashboard to show the most mentioned tickers.
The following utilities are prerequisites to installing the app:
- git
- Docker
- User accounts for both IEXCloud and Reddit (both available for free)
Installation of the app requires cloning of the core repository. This uses Git. This will bring down all the necessary files and enter the app folder.
git clone https://github.com/vstiern/wsb-hype-alert.git
cd wsb-hype-alert
Install docker for your platform Docker.
This app uses two apis. To get access to these services the user need to create a personal account. The client values/tokens need to be entered into the file config.ini under the correct header.
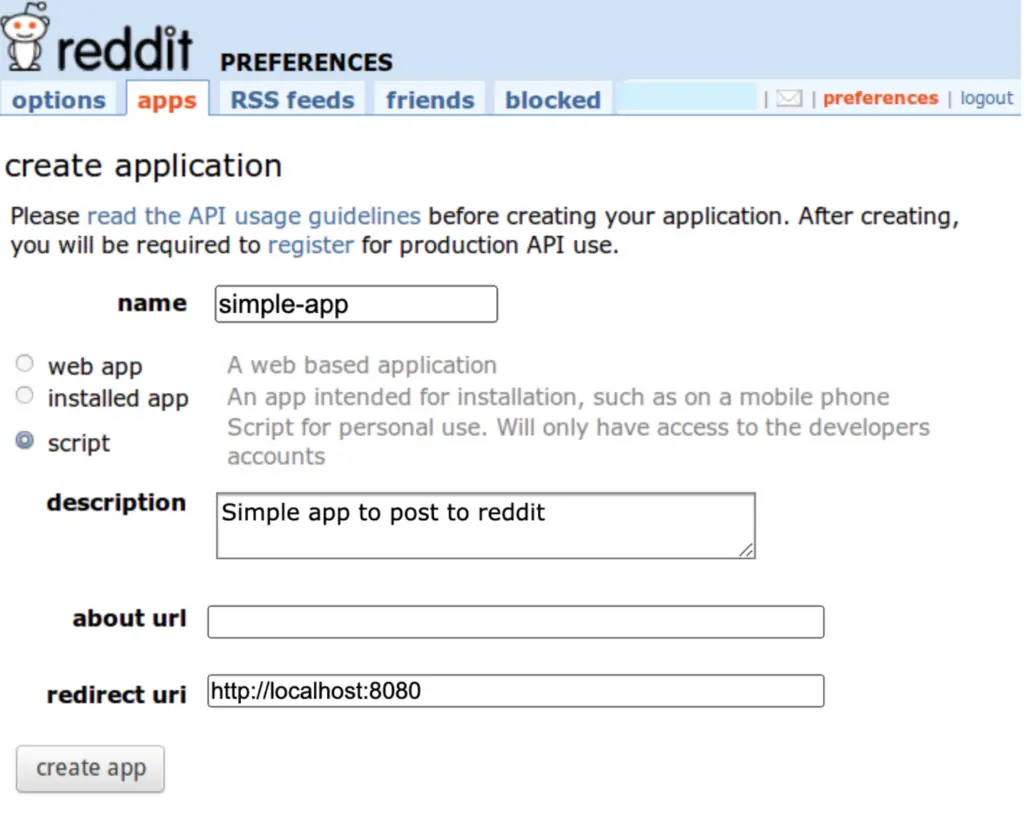
- Login to Reddit.
- Go to Reddit Apps.
- Select “script” as the type of app.
- Name the app and give it a description.
- Set the redirect url to be http://localhost:8080.
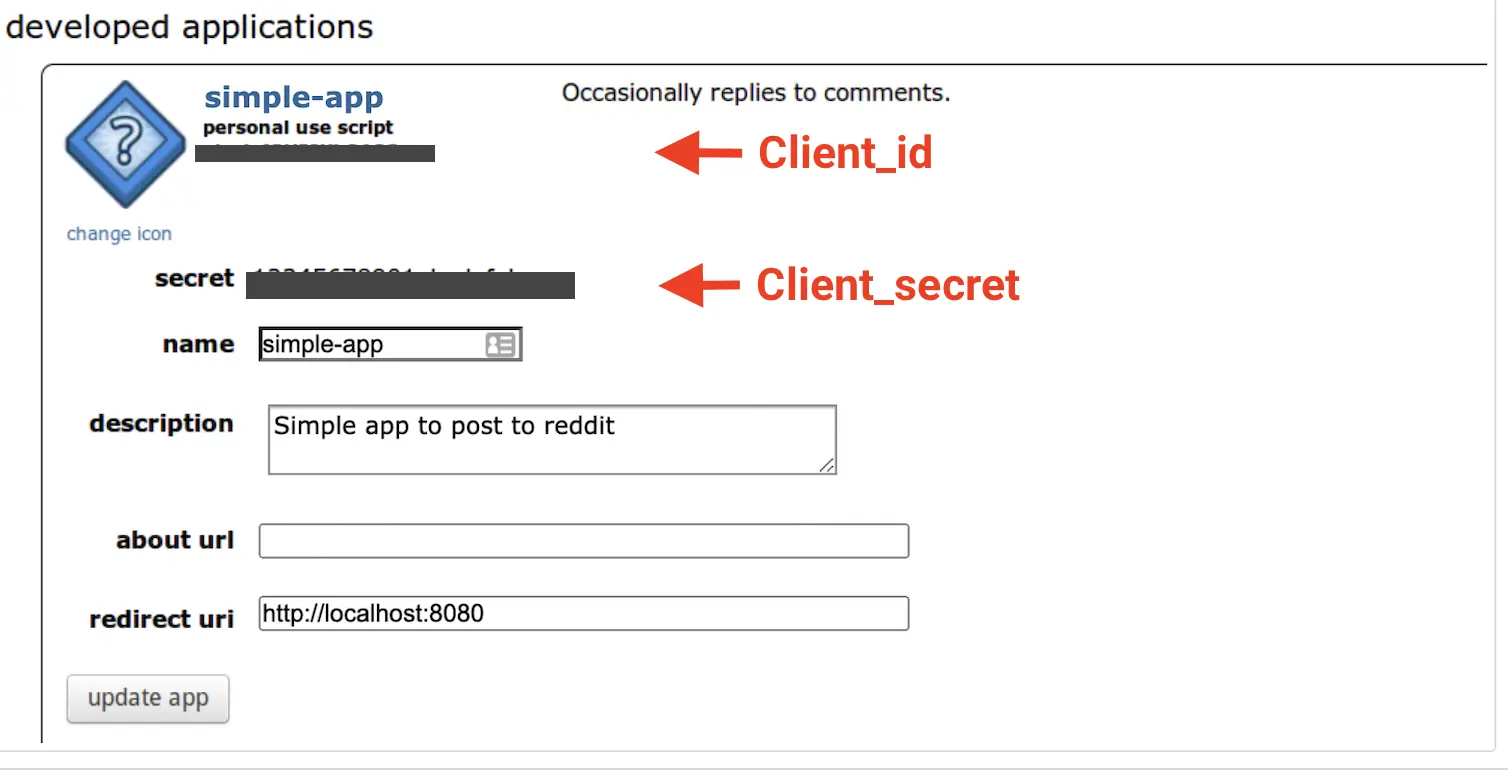
- Enter the values of client_id and client_secret to the file
config.iniunder the [reddit] header. Also enter username and password for the users reddit account in this section.
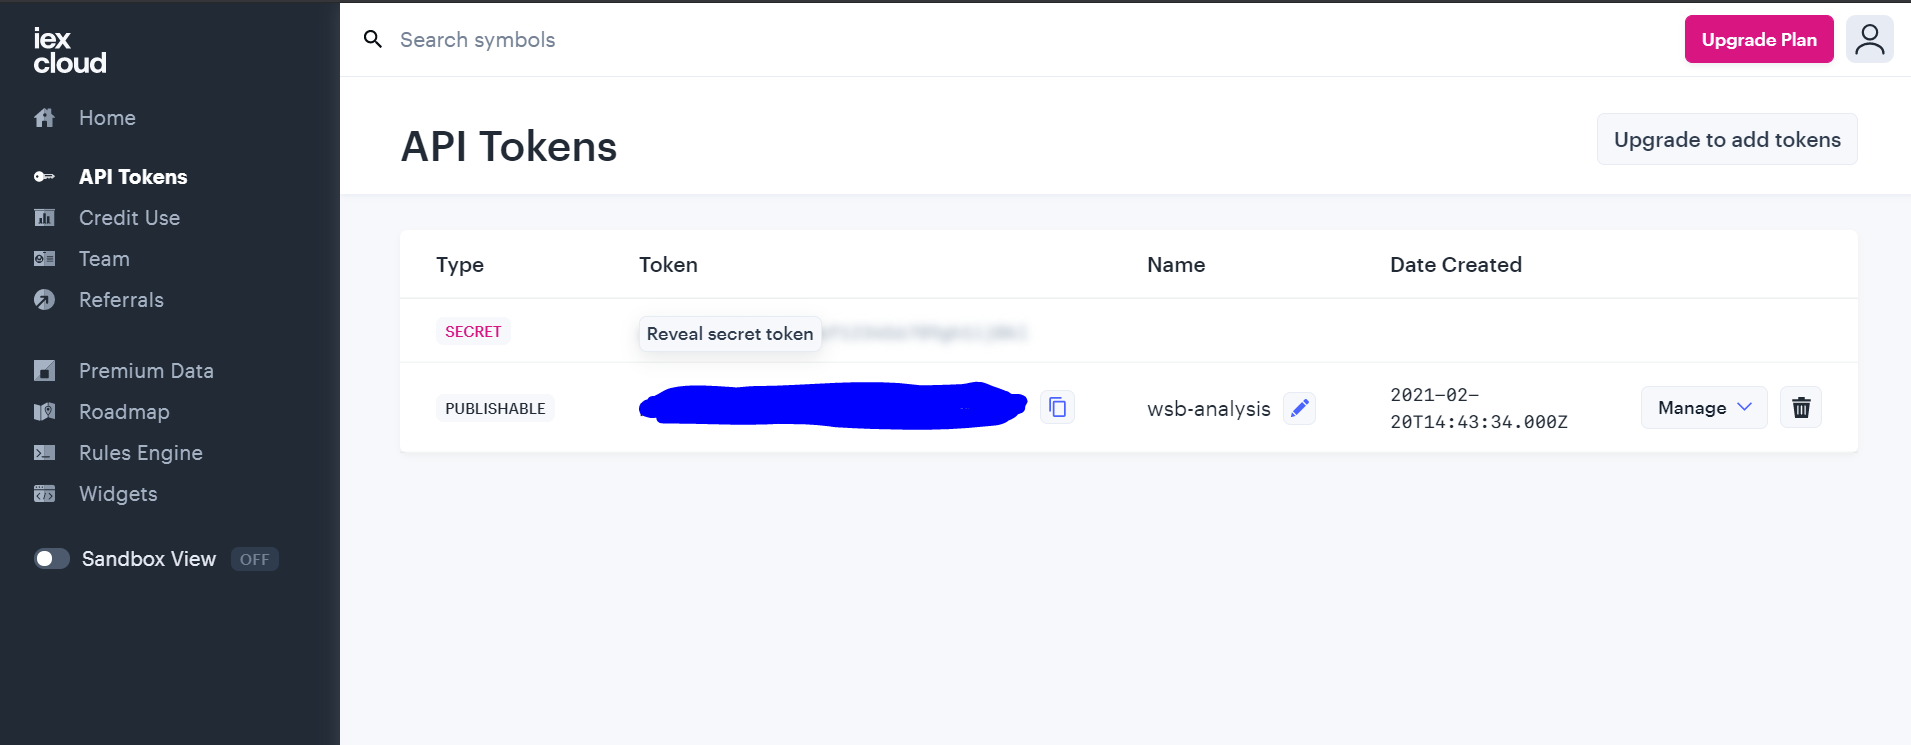
- Login to IEX Cloud.
- Go to API Tokens
- Enter the value of PUBLISHABLE to the file
config.iniunder the [iexfinance] header.
Open the data-collector config file data_collector/config.ini and fill in the respective fields
from both IEX Cloud and Reddit.
Finally, to start the app run the following command in the project directory. When all containers are up and running go to the dashboard url: http://127.0.0.1:8050/.
docker-compose up
The dashboard the shows the top 10 most mentioned tickers. The user can select what tickers to include and whether to see the number of times a ticker has been mentioned (count) or the aggregated score (upvotes - downvotes) for all the comments that mentions the ticker. By hovering over or clicking on a specific ticker in the top graph the graph below will show a breakdown by date and hour for the selected feature - count or score. Double click to reset the graph from zoom in. The dashboard will show new data from the subreddit every 5min. The new data will only be visable if its part of the top 10 most mentioned tickers.
The app is an early proof of concept and might not be very stable. Here are some things to keep in mind at this stage.
Notice that the first time using the app the there will not be any reddit data collected. The dashboard will pull new data from the database every 2min. The data-collector runs continously and more data will appear. The data stored in the database is saved loccally and can be accessed again after the app been closed and opened.
The rate of comment extraction might vary depending on usage of api account. The PRAW package currently handles all rate limits currently. Optimization to be improved.
The app only extracts mentioned tickers from comments and not the original submission. The data comes from the page sorting hot, which displays the most commented and upvoted submissions. The app extracts all comments from the current top submission. The app only counts unique ticker mention per comment.
This app has a lot of more potential and the following features are in the development pipeline:
- Price data - Show intraday price data against count/score. This would allow the user to see how the market price is moving in accordance with the forums activity.
- Sentiment analysis - Rather than just observing the number of comments that mentions a ticker, it would be interesting to analyze the context and to see whether the forum has a positive or negative sentiment to the price of a ticker.
- Use more sources - what tickers have been mentioned on other subreddits, Twitter and forums. The more sources we can analyze, the more hype and risk can be mitigated.


